【WebGIS】Vue3使用 VueLeaflet + 天地图 搭建地图可视化平台(基础用法)
初始化
创建项目
nodejs18.0.6npm9.5.1
引入地图服务
VueLeaflet
GitHub - vue-leaflet/vue-leaflet: vue-leaflet 与 vue3 兼容
Vue Leaflet (vue2-leaflet)
package.josn安装版本
直接添加四个依赖
{// ..."scripts": {// ...},"dependencies": {"leaflet-velocity": "^2.1.4","ts-debounce": "^4.0.0",// ...},"devDependencies": {"@types/leaflet": "^1.9.0","leaflet": "^1.9.4",// ... }
}- 直接在 src 目录下引入
VueLeaflt包本地 VueLeaflt组件压缩包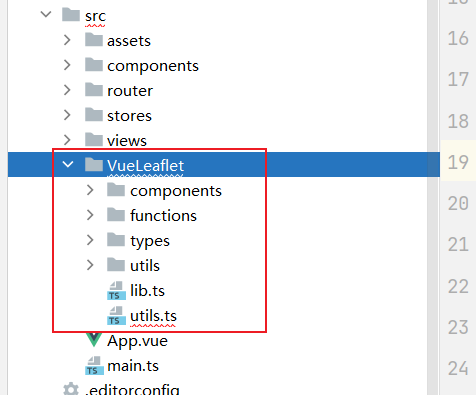
- 新建 map 地图组件使用 VueLeaflet 地图框架
<template><div id="map"><div class="map-container"><!-- 地图组件 --><div class="map"><l-mapref="map"v-model:zoom="zoom":center="mapCenter":attribution-control="false":zoom-control="false"><l-layer-group v-for="(item, index) in baseLayers" :key="index"><!-- 地图底图 --><l-layer-group><l-tile-layerv-if="item.show":url="item.url"layer-type="base":name="item.name"></l-tile-layer></l-layer-group></l-layer-group></l-map></div></div></div></template>JavaScript 引入
<script setup lang="ts">
import { ref, onUnmounted } from 'vue'
import { LMap, LLayerGroup, LTileLayer } from '@/VueLeaflet/components/index'
import 'leaflet/dist/leaflet.css'</srcipt>- 切记使用标签时需要先引入
import {LMap,LLayerGroup,LTileLayer,// ...
} from '@/VueLeaflet/components/index';
天地图
天地图 开发管理平台 (tianditu.gov.cn)
天地图API (tianditu.gov.cn)
创建应用获取 key 密钥, 绘制地图地图
// 获取env密钥
const TIANDITU_KEY = import.meta.env.VITE_TIANDITU_KEY;// 地图底图
const baseLayers = ref([{index: 1,name: '行政图',url: `https://t0.tianditu.gov.cn/DataServer?T=vec_w&X={x}&Y={y}&L={z}&tk=${TIANDITU_KEY}`,// url: '/map/{z}/{x}/{y}.png',// 矢量注记anno: `https://t0.tianditu.gov.cn/DataServer?T=cva_w&X={x}&Y={y}&L={z}&tk=${TIANDITU_KEY}`,show: true,},{index: 2,name: '影像图',url: `https://t0.tianditu.gov.cn/DataServer?T=img_w&X={x}&Y={y}&L={z}&tk=${TIANDITU_KEY}`,anno: `https://t0.tianditu.gov.cn/DataServer?T=cia_w&X={x}&Y={y}&L={z}&tk=${TIANDITU_KEY}`,show: false,},{index: 3,name: '地形图',url: `https://t0.tianditu.gov.cn/DataServer?T=ter_w&X={x}&Y={y}&L={z}&tk=${TIANDITU_KEY}`,anno: `https://t0.tianditu.gov.cn/DataServer?T=cta_w&X={x}&Y={y}&L={z}&tk=${TIANDITU_KEY}`,show: false,},
])
结合组件
创建地图组件map 使用VueLeaflet嵌套天地图服务
供其他页面使用
<template><div id="map"><div class="map-container"><!-- 地图组件 --><div class="map"><l-mapref="map"v-model:zoom="zoom":center="mapCenter":attribution-control="false":zoom-control="false"><l-layer-group v-for="(item, index) in baseLayers" :key="index"><!-- 地图底图 --><l-layer-group><l-tile-layerv-if="item.show":url="item.url"layer-type="base":name="item.name"></l-tile-layer><!--   省市标注图层    --><l-tile-layerv-if="item.anno && item.show":url="item.anno"layer-type="annotation":name="item.name + '标注'"></l-tile-layer></l-layer-group></l-layer-group></l-map></div></div></div></template><script setup lang="ts">
import { ref, onUnmounted } from 'vue'
import { LMap, LLayerGroup, LTileLayer } from '@/VueLeaflet/components/index'
import 'leaflet/dist/leaflet.css'const map = ref()
const mapCenter = ref([24.611, 113.5387])
const zoom = ref(9)const TIANDITU_KEY = import.meta.env.VITE_TIANDITU_KEY;// 地图底图
const baseLayers = ref([{index: 1,name: '行政图',url: `https://t0.tianditu.gov.cn/DataServer?T=vec_w&X={x}&Y={y}&L={z}&tk=${TIANDITU_KEY}`,// url: '/map/{z}/{x}/{y}.png',// 矢量注记anno: `https://t0.tianditu.gov.cn/DataServer?T=cva_w&X={x}&Y={y}&L={z}&tk=${TIANDITU_KEY}`,show: true,},{index: 2,name: '影像图',url: `https://t0.tianditu.gov.cn/DataServer?T=img_w&X={x}&Y={y}&L={z}&tk=${TIANDITU_KEY}`,anno: `https://t0.tianditu.gov.cn/DataServer?T=cia_w&X={x}&Y={y}&L={z}&tk=${TIANDITU_KEY}`,show: false,},{index: 3,name: '地形图',url: `https://t0.tianditu.gov.cn/DataServer?T=ter_w&X={x}&Y={y}&L={z}&tk=${TIANDITU_KEY}`,anno: `https://t0.tianditu.gov.cn/DataServer?T=cta_w&X={x}&Y={y}&L={z}&tk=${TIANDITU_KEY}`,show: false,},
])</script><style lang="scss" scoped>
#map {
}.map-container {position: relative;height: 100vh;width: 100vw;overflow: hidden;
}.map {height: 100%;width: 100%;
}</style>
地图API处理
marker叠加标记点
基础叠加: 叠加marker图片
示例叠加 雷电图标 自动站图标, 提供 宽度、高度、经度、纬度、图标路径
<!-- marker图层 --><l-layer-group><l-markerv-for="(marker, markerIndex) in markers":key="markerIndex":lat-lng="[marker.latitude, marker.longitude]"><!-- 展示雷达 自动站 marker --><l-ico:icon-size="[marker.width, marker.height]":icon-anchor="[18, 18]":class-name="'my-div-icon'":icon-url="marker.iconPath"/></l-marker></l-layer-group>pinia全局管理 雷电数据内容
const getAllThunderData = () => {const width = 20;const height = 20;thunderData.value = thunderData.value.map((point, index) => ({...point,id: index + 1, // 累加idwidth,height: point.intensity < 0 ? height / 5 : height, // 负号是长方形iconPath:point.intensity >= 0? '/src/assets/images/icon/windArrow/positive.png' // intensity雷暴强度 >= 0: '/src/assets/images/icon/windArrow/negative.png',type: 'thunder',}));return thunderData.value;};
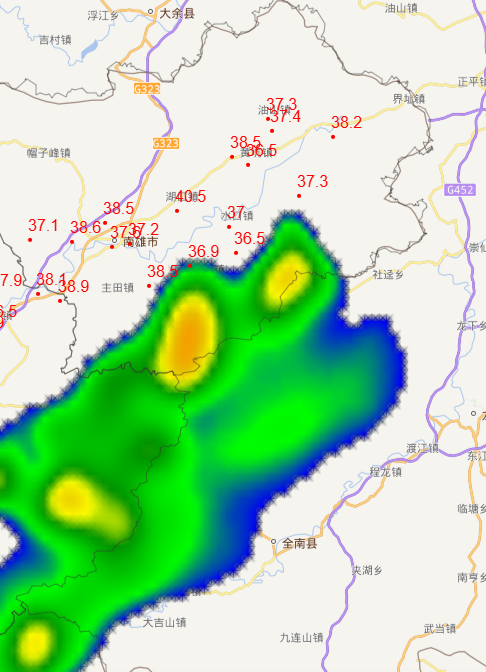
基础叠加: 显示数值,不显示图标
示例展示 降水数据,直接将降水数值叠加在地图上
也是使用 l-icon 标签,只不过不添加 :icon-url 字段
直接在icon里面使用 div 展示数据即可
<!-- marker图层 --><l-layer-group><l-markerv-for="(marker, markerIndex) in markers":key="markerIndex":lat-lng="[marker.latitude, marker.longitude]"><!-- 显示降水数值 --><l-iconv-if="marker.type === 'rain'":icon-size="[20, 28]":icon-anchor="[28, 28]":class-name="'my-div-icon'"><div class="rain-marker">{{ marker.rainfall }}</div></l-icon></l-marker></l-layer-group>绘制区域轮廓
DataV.GeoAtlas地理小工具系列 (aliyun.com)
访问网址, 下载所需区域的GeoJSON数据并保存, 最细颗粒度为 区
- 读取 assets 下的 json 数据
import {LGeoJson,
} from '@/VueLeaflet/components/index';
import type { GeoJSON } from 'geojson';// GeoJSON 数据
const geoJsonData = ref<GeoJSON | null>(null);// 样式
const geoJsonOptions = ref({style: {color: '#3388ff',weight: 2,opacity: 1, // 边界透明度fillColor: '#3388ff',fillOpacity: 0.2 // 填充透明度}
});// 加载  GeoJSON 数据
const loadGeoJsonData = async () => {try {const response = await fetch('/src/assets/json/xxxx.json');const data = await response.json();geoJsonData.value = data;} catch (error) {console.error('加载 GeoJSON 数据失败:', error);}
};onMounted(() => {loadGeoJsonData();
});
- 在地图上进行绘制
<l-layer-group v-for="(item, index) in baseLayers" :key="index"><!-- GeoJSON 图层轮廓 --><l-layer-group><l-geo-jsonv-if="geoJsonData":geojson="geoJsonData":options="geoJsonOptions"/></l-layer-group>// ......