地图可视化实践录:leaflet学习之综合示例工程设计
本文介绍笔者设计的一个综合示例工程。
背景
从前面的demo可以看到,很多示例都是直接硬编码的,不方便修改,而且还有较多重复的模块。经过思索,决定重新设计工程,使其具有通用性。
设计
- 依然使用纯前端实现demo功能,没有后端介入。html文件负责页面展示,js文件负责实现共用的功能函数。
- 设计输入框和输出框,用于交互数据。
- 设计下拉框选择不同的功能。不同功能使用不同函数实现,为方便操作,每个功能都尽量给出可用的示例。各函数相对独立,方便后续添加更多功能。
- 提供2个按钮实现展示和清除图层功能。
- 所有的经纬度顺序均为:经度、纬度。此为GeoJSON采用的坐标顺序,但leaflet刚好与之相反,转换的动作在实现业务时进行,对外则使用统一的顺序。
- 多个经纬度,无特殊说明情况下,使用分号间隔。
- 底图统一使用高德地图。
- 一般情况下,使用leaflet的fitBounds函数将图形缩放定位到恰当的位置。
共用的功能有:
- 地图展示
- 各类画线的封装
- GeoJSON展示封装
本文参考上一个demo,实现:坐标定位、绘制各类图形(圆形、矩形、多边形),显示GeoJSON,等。其它新功能,陆续再加。
实现
页面设计
主体部分还是保持先前的内容,如地图占满全屏幕,地图ID为map,等。由于新加了文本框,需单独设置css样式,具体如下:
<head><meta charset="utf-8" /><title>地图综合示例</title><style>body {margin: 0;padding: 0;}#map {width: 100vw;height: 100vh;}#inputPanel { position: absolute; top: 10px; left: 10px; width: 180px; background: white; padding: 10px; z-index: 1000;border: 1px solid #ccc;}#txtInput {width: 100%;height: 150px;font-family: monospace;}#txtOutput {width: 100%;height: 150px;font-family: monospace;}</style>
</head>
body部分除了文本框外,还有下拉框和交互命令,具体如下:
<body><div id="map"></div><div id="inputPanel">一个输入框 <textarea id="txtInput" placeholder="请输入内容..."></textarea>一个输出框<textarea id="txtOutput" placeholder="请等待内容输出..."></textarea><select id="functionSelect" onchange="onFunctionChange()"><option value="坐标定位">坐标定位</option><option value="绘制圆形">绘制圆形</option><option value="绘制矩形">绘制矩形</option><option value="绘制折线">绘制折线</option><option value="绘制多边形">绘制多边形</option><option value="显示GeoJSON-默认">显示GeoJSON-默认</option><option value="显示GeoJSON-自定义">显示GeoJSON-自定义</option></select><br><br><button onclick="handleCmd()">提交</button><button onclick="clearMap()">清除图层</button></div>
</body>
可以看到,handleCmd实现响应了用户的点击提交事件,clearMap可清理已画了的线或图形。
图层管理
设计单独清理图层的目的是可以叠加各种图形。具体管理相关代码如下:
var currentLayer = null;const multiLayers = [];// 清除所有图层
function clearAllLayers() {multiLayers.forEach(layer => {if (layer && mymap.hasLayer(layer)) {mymap.removeLayer(layer);}});multiLayers.length = 0;
}// 添加图层
function addToLayers(layer) {if (layer) {multiLayers.push(layer);mymap.addLayer(layer);}
}function clearMap() {if (currentLayer) {mymap.removeLayer(currentLayer);currentLayer = null;}clearAllLayers();
}
帮助信息
demo的作用不仅仅是demo,更是要方便自己使用,因此,单独实现帮助信息函数,在下拉框选择时即可显示。具体如下:
// 本函数仅是显示输入示例,无实例用处
function onFunctionChange() {const select = document.getElementById('functionSelect');const input = document.getElementById('txtInput');const output = document.getElementById('txtOutput');input.placeholder = "使用说明见下框,可复制进行测试"switch(select.value) {case '坐标定位':output.value = '请输入坐标 [经度, 纬度]\n示例:108.331032, 22.829035';break;case '绘制圆形':output.value = '请输入圆心坐标经纬度和半径(单位为米),以逗号隔开\n示例:108.414116,22.880920, 3000';break;case '绘制矩形':output.value = '请输入矩形左下角、右上角2组经纬度字符串,以逗号隔开\n示例:104.450893, 20.899288, 112.06185, 26.385566';break;case '绘制折线':output.value = `请输入折线经纬度字符串数组,每组用分号隔开\n格式:lng,lat;lng,lat;\n示例:108.482437,22.857195;
108.479004,22.818593;
108.405533,22.798338;`;break;case '绘制多边形':output.value = `请输入多边形经纬度字符串数组,每组用分号隔开\n格式:lng,lat;lng,lat;示例:108.064957,22.870481;
108.084183,22.864155;
108.109589,22.831883;
108.128128,22.840426;
108.130188,22.828086;
108.114738,22.812897;
108.112335,22.802136;
108.169327,22.758770;
108.202801,22.778872;
108.190269,22.813213;
108.160057,22.842958;
108.118515,22.848020;
108.103409,22.875226;
108.071823,22.878389;
`;break;case '显示GeoJSON-默认':output.value = '请输入 GeoJSON 数据...\n示例:{"type":"FeatureCollection","features":[...]}';break;case '显示GeoJSON-自定义':output.value = '请输入 GeoJSON 数据...\n示例:{"type":"FeatureCollection","features":[...]}';break;}
}
响应用户事件
handleCmd根据用户选择的下拉框参数,调用对应的函数,是总入口。
// 统一处理命令
function handleCmd() {const select = document.getElementById('functionSelect');const input = document.getElementById('txtInput').value;const output = document.getElementById('txtOutput');var info = "未未定返回信息"if (input=="") {document.getElementById('txtOutput').value = "输入内容为空";return;}// 先处理自定义的字符串var info = handleCustomCmd(input);if (info != ""){output.value = info;return;}try {switch(select.value) {case '坐标定位':info = flyToLocation(input);break;case '绘制圆形':info = drawCircle(input);break;case '绘制矩形':info = drawRectangle(input);break;case '绘制折线':info = drawPolyLine(input);break;case '绘制多边形':info = drawPolygon(input);break;case '显示GeoJSON-默认':info = showGeoJSON(input);break;case '显示GeoJSON-自定义':info = showMyGeoJSON(input);break;}output.value = info;} catch (error) {output.value = `错误: ${error.message}`;}
}
业务处理
marker标记定位
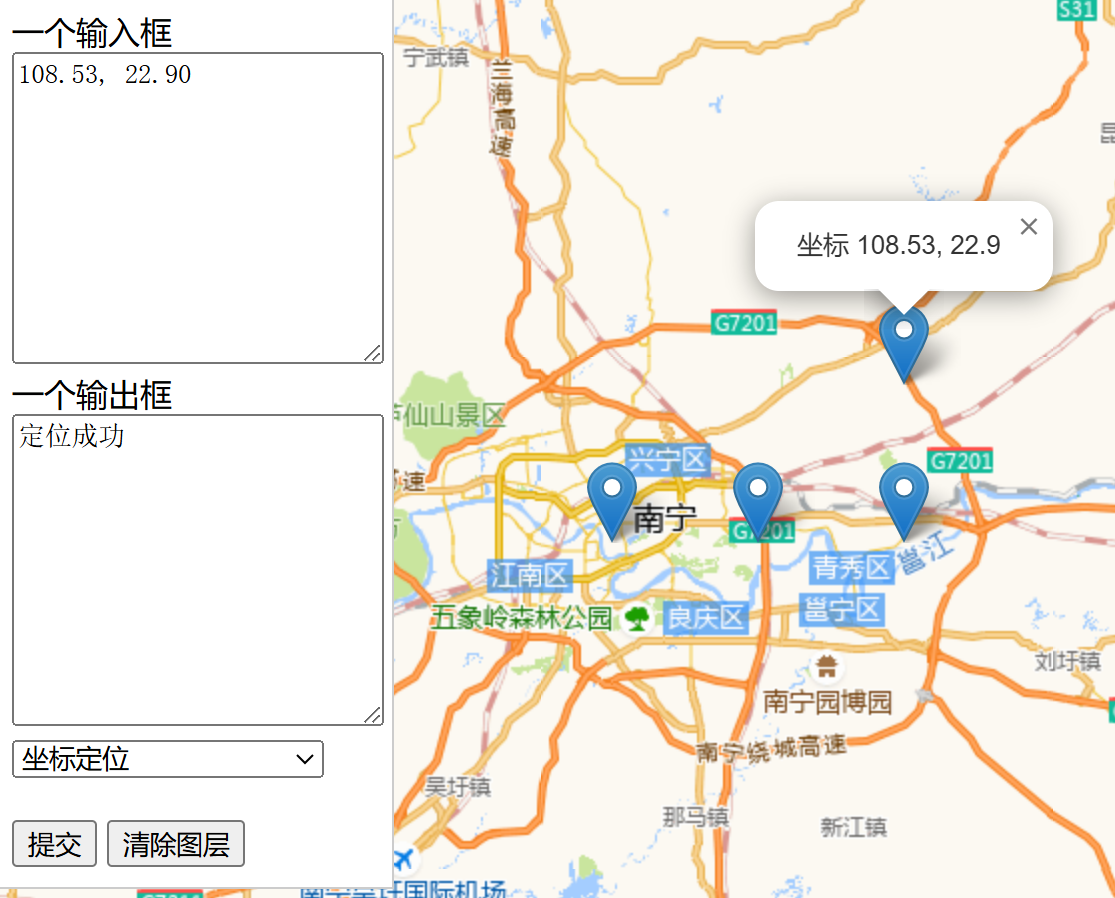
功能:在用户指定的经纬度显示marker图标。可以尝试不同的经纬度,了解这2个数值在地图上的变化。
函数如下:
/*
坐标定位
支持:
z,lng,lat  或 lng,lat
如不指定等级,按当前缩放等级
*/
function flyToLocation(inputStr) {// 以当前等级为默认等级z = mymap.getZoom();var lng, latvar vLine = inputStr.split(',')if (vLine.length == 2) {lng = parseFloat(vLine[0]);lat = parseFloat(vLine[1]);} else if (vLine.length == 3) {z = parseInt(vLine[0], 10);lng = parseFloat(vLine[1]);lat = parseFloat(vLine[2]);} else {return '参数不合规'}info = `坐标 ${lng}, ${lat}`const center = [lat, lng]var marker = L.marker(center, {})marker.bindPopup(info)addToLayers(marker)mymap.flyTo(center, z)return '定位成功'
}
使用如下经纬度数据测试:
108.33, 22.80
108.43, 22.80
108.53, 22.80
108.53, 22.90
效果图:
绘制圆形
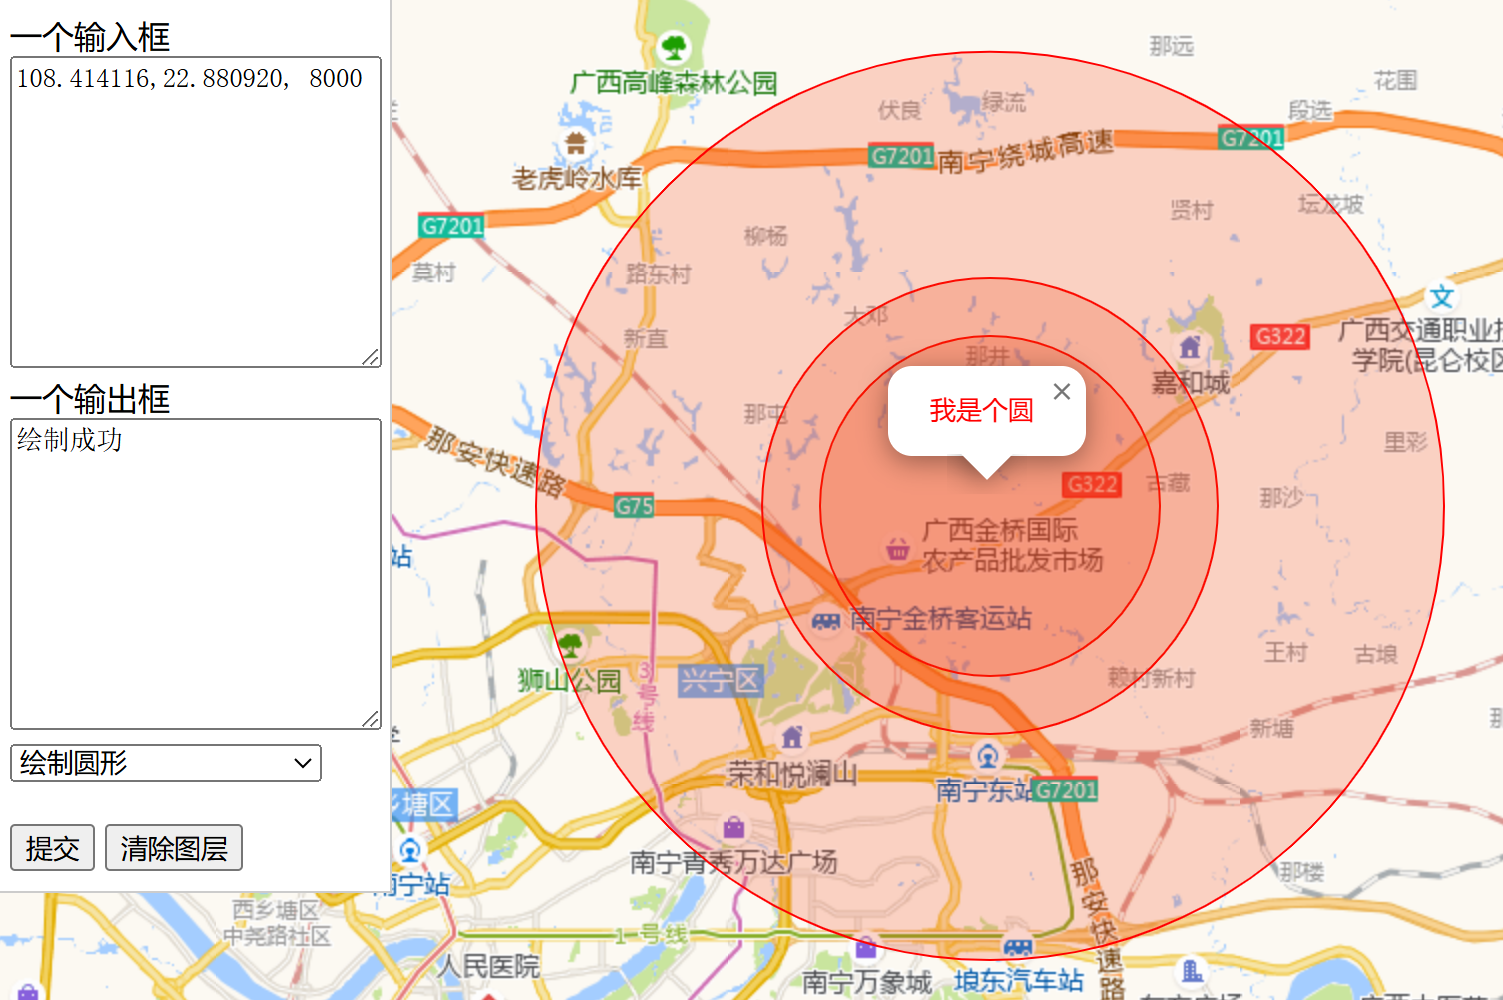
功能:根据用户指定的经纬度和半径(单位为米)绘制圆形。
代码:
function drawCircle(inputStr) {console.log('绘制圆形:', inputStr);z = mymap.getZoom();var lng, lat, radius;var vLine = inputStr.split(',')if (vLine.length == 3) {lng = parseFloat(vLine[0]);lat = parseFloat(vLine[1]);radius = parseInt(vLine[2], 10);} else {return '参数不合规'}var circle = L.circle([lat, lng], {color: 'red', // 边框颜色weight: 1,   // 边框宽度fillColor: '#f03000', // // 填充颜色fillOpacity: 0.2, // 填充透明度radius: radius // 半径(米)}).addTo(mymap);circle.bindPopup("<font color='red'>我是个圆</font>")return '绘制成功'
}
测试数据:
108.414116,22.880920, 3000
108.414116,22.880920, 4000
108.414116,22.880920, 8000
效果图:
绘制矩形
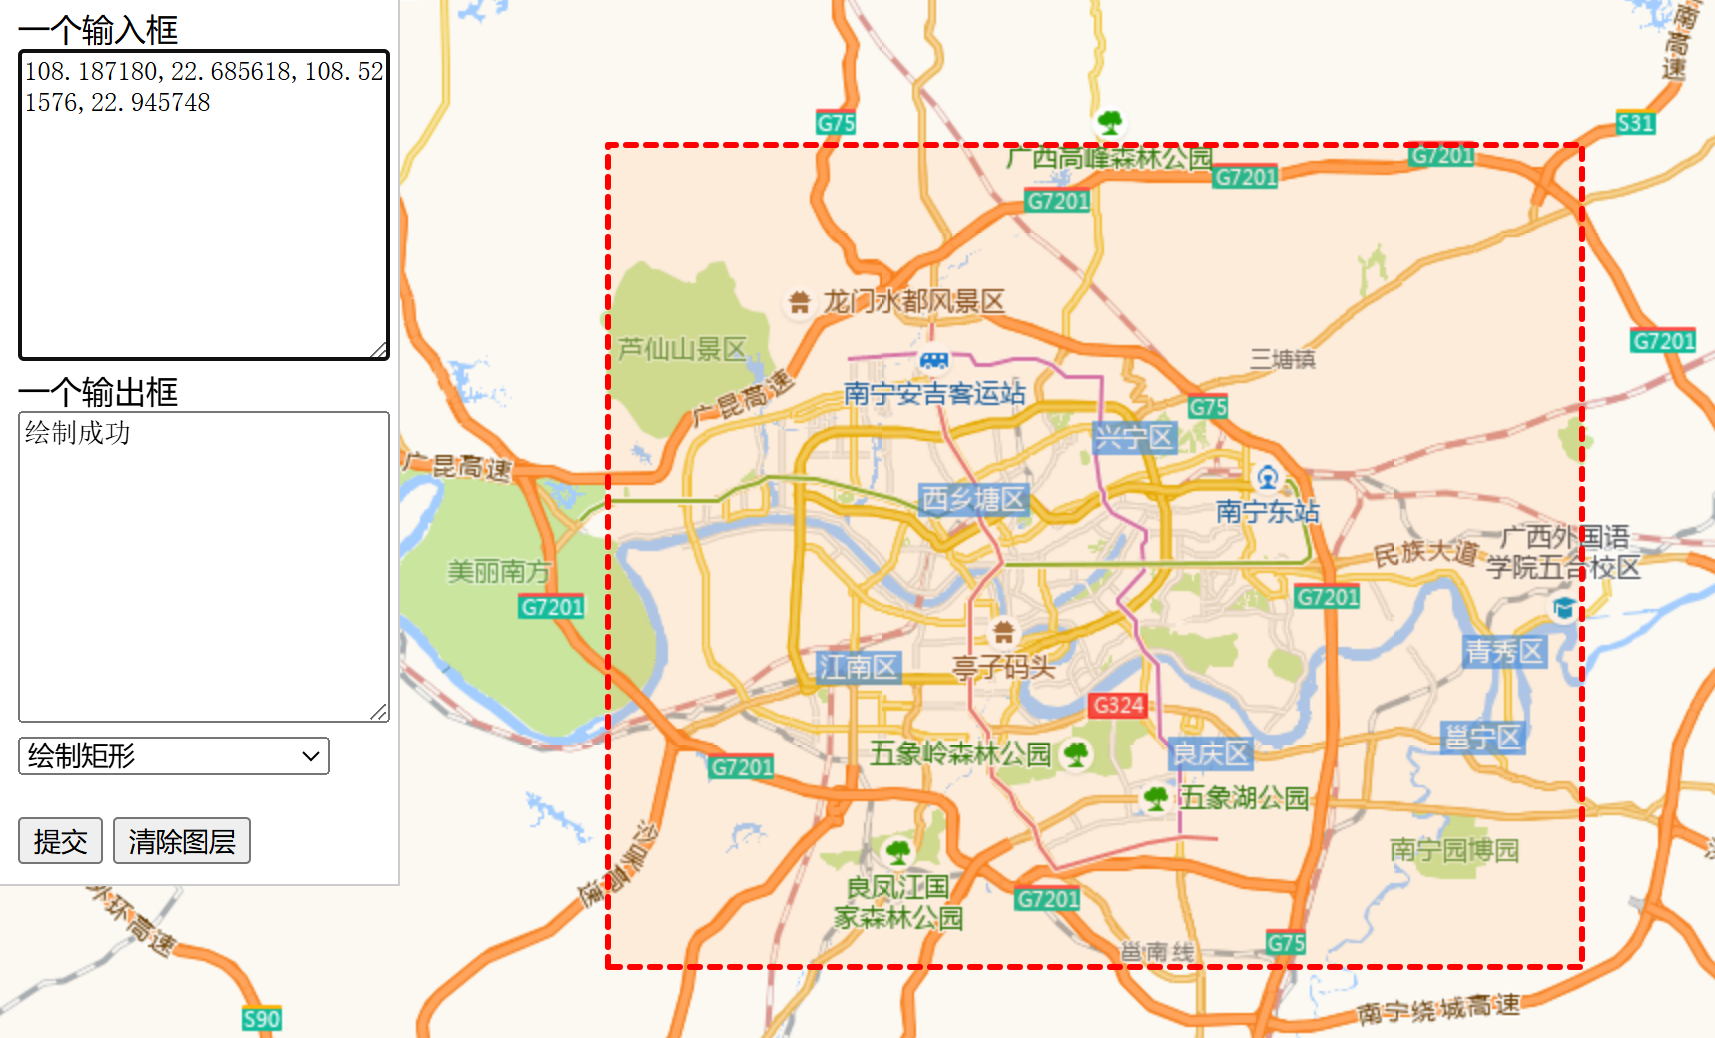
功能:根据用户指定的经纬度绘制矩形,坐标为左下角和右上角,共2组坐标,4个值,使用逗号分隔。格式:lng,lat;lng,lat;
代码:
function drawRectangle(inputStr) {console.log('绘制矩形:', inputStr);const object = drawMyRectangle(inputStr, { color: "red", weight: 3})addToLayers(object)mymap.fitBounds(object.getBounds());return '绘制成功'
}/*** 在地图上绘制矩形形* @param {string} coordStr - 坐标字符串,左下角、左上角坐标,格式:"lng,lat,lng,lat"* @param {object} options - 样式选项(可选)* @returns {L.Rectangle} 返回矩形对象*/
function drawMyRectangle(coordStr, options = {}) {// // 矩形// const rectangleBounds = [//     [22.864787, 108.187866],  // 西南角 (左下角)//     [22.910333, 108.237991]   // 东北角 (右上角)// ];const points = coordStr.split(',')// 按leaflet经纬度顺序调整const rectangleBounds = [[points[1],points[0]],[points[3],points[2]],];// L.rectangle(边界坐标, 样式选项)rectangle = L.rectangle(rectangleBounds, {// 填充相关样式fillColor: options.fillColor || '#ff7800',    // 填充颜色 - 橙色fillOpacity: options.fillOpacity || 0.1,        // 填充透明度 - 10% 透明// 边框相关样式color: options.color || '#ff0000',        // 边框颜色 weight: options.weight || 3,               // 边框宽度// opacity: options.opacity || 0.8,            // 边框透明度// 其他可选样式dashArray: options.dashArray || '5, 5',    // 虚线样式 - 5像素实线, 5像素空白...options})return rectangle;
}
测试数据:
108.187180,22.685618,108.521576,22.945748
效果图:
绘制折线
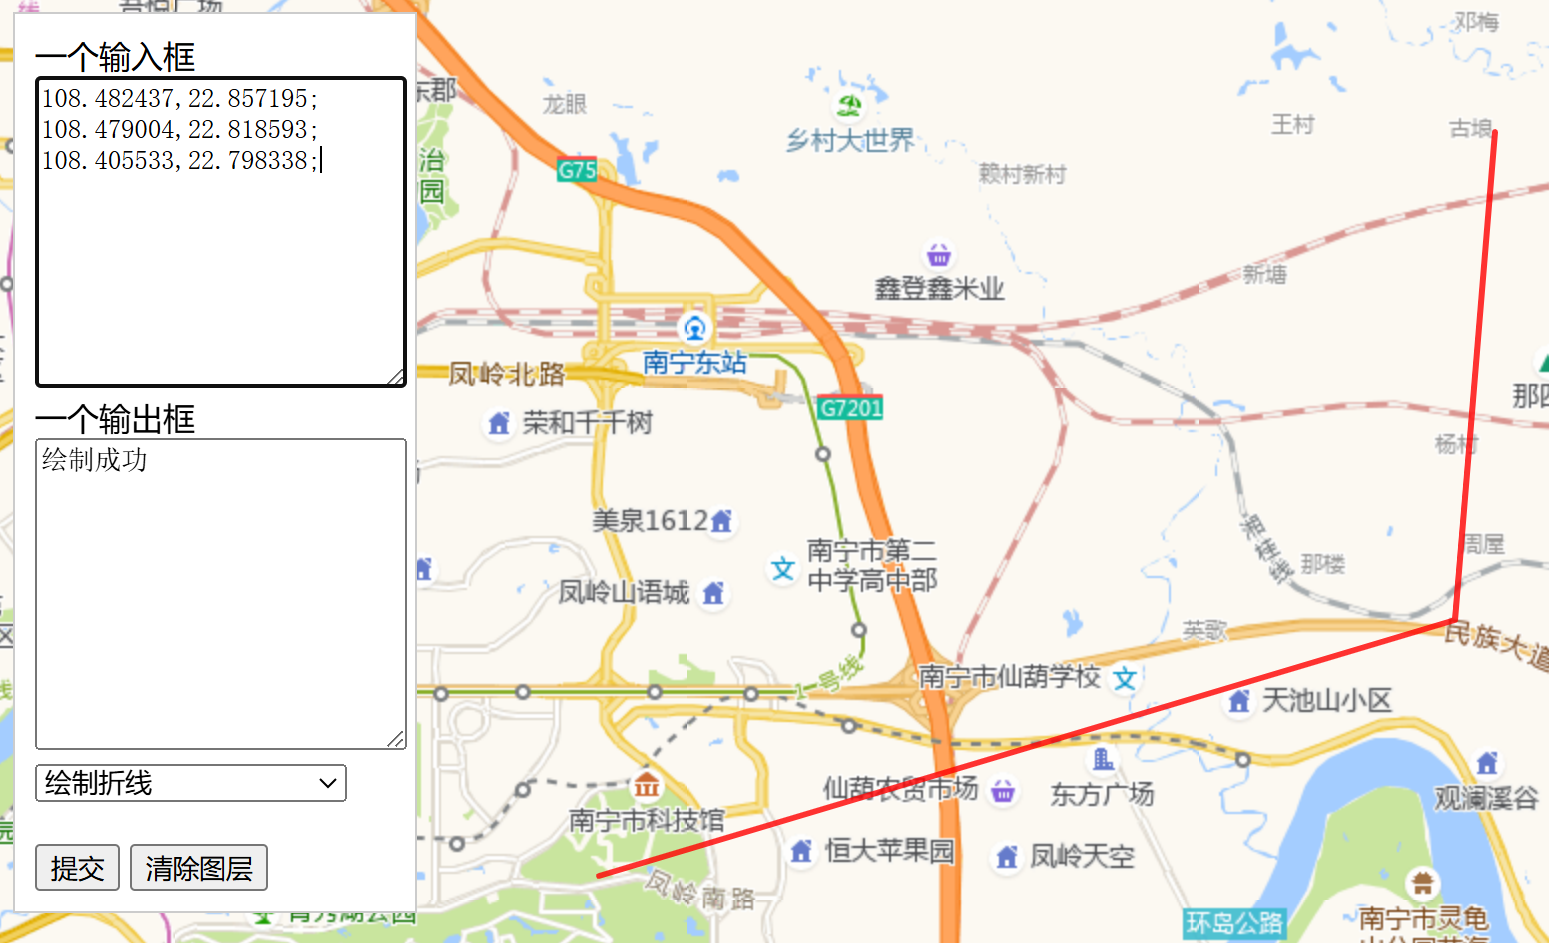
功能:根据用户指定的经纬度字符串绘制折线,每组经纬度用分号隔开,格式:lng,lat;lng,lat;。
代码:
function drawPolyLine(inputStr) {console.log('绘制折线:', inputStr);const object = drawMyPolyLine(inputStr, { color: "red", weight: 3})addToLayers(object)mymap.fitBounds(object.getBounds());return '绘制成功'
}function drawMyPolyLine(coordStr, options = {}) {// 清理输入:去除多余的空格和换行,按分号分割const cleanedStr = coordStr.trim().replace(/\r\n/g, '\n').replace(/\r/g, '\n');const coordPairs = cleanedStr.split(';').filter(pair => pair.trim() !== '');// 转换坐标格式:将 "经度,纬度" 转换为 Leaflet 需要的 [纬度, 经度]const latLngs = coordPairs.map(pair => {const [lng, lat] = pair.trim().split(',').map(coord => parseFloat(coord.trim()));return [lat, lng]; // 转换为 [纬度, 经度]});// 样式设置const defaultOptions = {color: options.color || '#ff00ff',weight: options.weight || 3,opacity: options.opacity || 0.8,fillColor: options.fillColor || '#ff00ff',fillOpacity: options.fillOpacity || 0.2,...options};// 创建折线const polyline = L.polyline([latLngs], defaultOptions);return polyline;
}
测试数据:
108.482437,22.857195;
108.479004,22.818593;
108.405533,22.798338;
效果图:
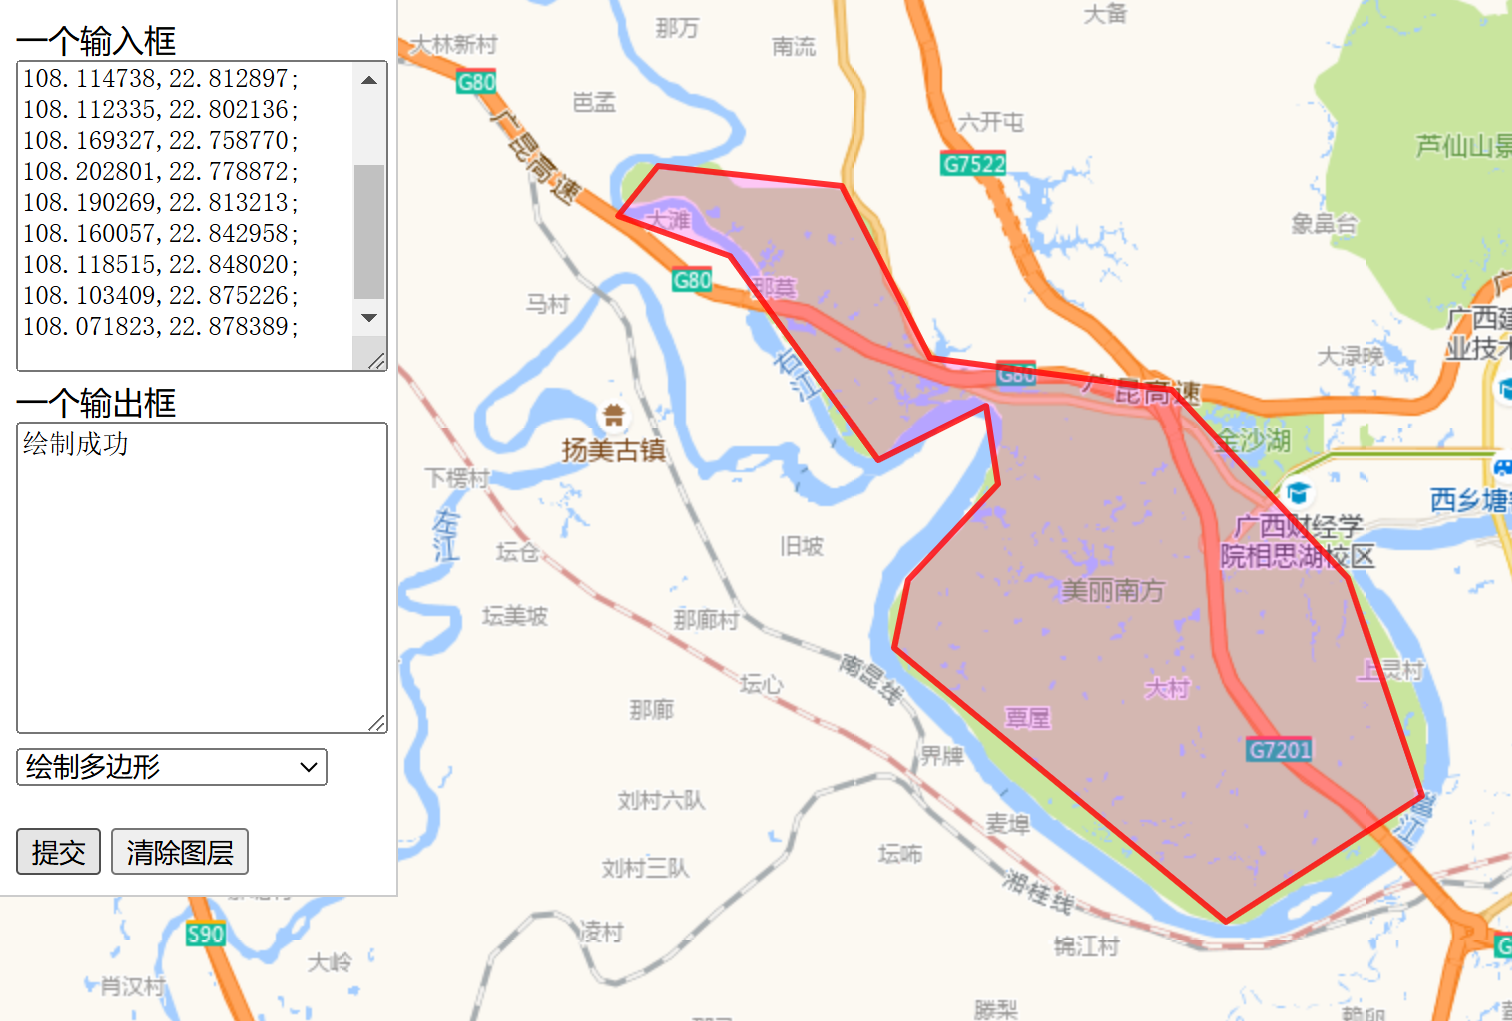
绘制多边形
功能:根据用户指定的经纬度字符串绘制折线,每组经纬度用分号隔开,格式:lng,lat;lng,lat;。
代码:
function drawPolygon(inputStr) {console.log('绘制多边形:', inputStr);const object = drawMyPolygon(inputStr, { color: "red", weight: 3})addToLayers(object)mymap.fitBounds(object.getBounds());return '绘制成功'
}/*** 在地图上绘制多边形* @param {string} coordStr - 坐标字符串,格式 "lng,lat;lng,lat;..."* @param {L.Map} map - Leaflet地图对象* @param {object} options - 多边形样式选项(可选)* @returns {L.Polygon} 返回多边形对象*/
function drawMyPolygon(coordStr, options = {}) {// 清理输入:去除多余的空格和换行,按分号分割const cleanedStr = coordStr.trim().replace(/\r\n/g, '\n').replace(/\r/g, '\n');const coordPairs = cleanedStr.split(';').filter(pair => pair.trim() !== '');// 转换坐标格式:将 "经度,纬度" 转换为 Leaflet 需要的 [纬度, 经度]const latLngs = coordPairs.map(pair => {const [lng, lat] = pair.trim().split(',').map(coord => parseFloat(coord.trim()));return [lat, lng]; // 转换为 [纬度, 经度]});// 样式设置const defaultOptions = {color: options.color || '#ff00ff',weight: options.weight || 3,opacity: options.opacity || 0.8,fillColor: options.fillColor || '#ff00ff',fillOpacity: options.fillOpacity || 0.2,...options};// 创建多边形const polygon = L.polygon([latLngs], defaultOptions);return polygon;
}
测试数据:
108.064957,22.870481;
108.084183,22.864155;
108.109589,22.831883;
108.128128,22.840426;
108.130188,22.828086;
108.114738,22.812897;
108.112335,22.802136;
108.169327,22.758770;
108.202801,22.778872;
108.190269,22.813213;
108.160057,22.842958;
108.118515,22.848020;
108.103409,22.875226;
108.071823,22.878389;
效果图:
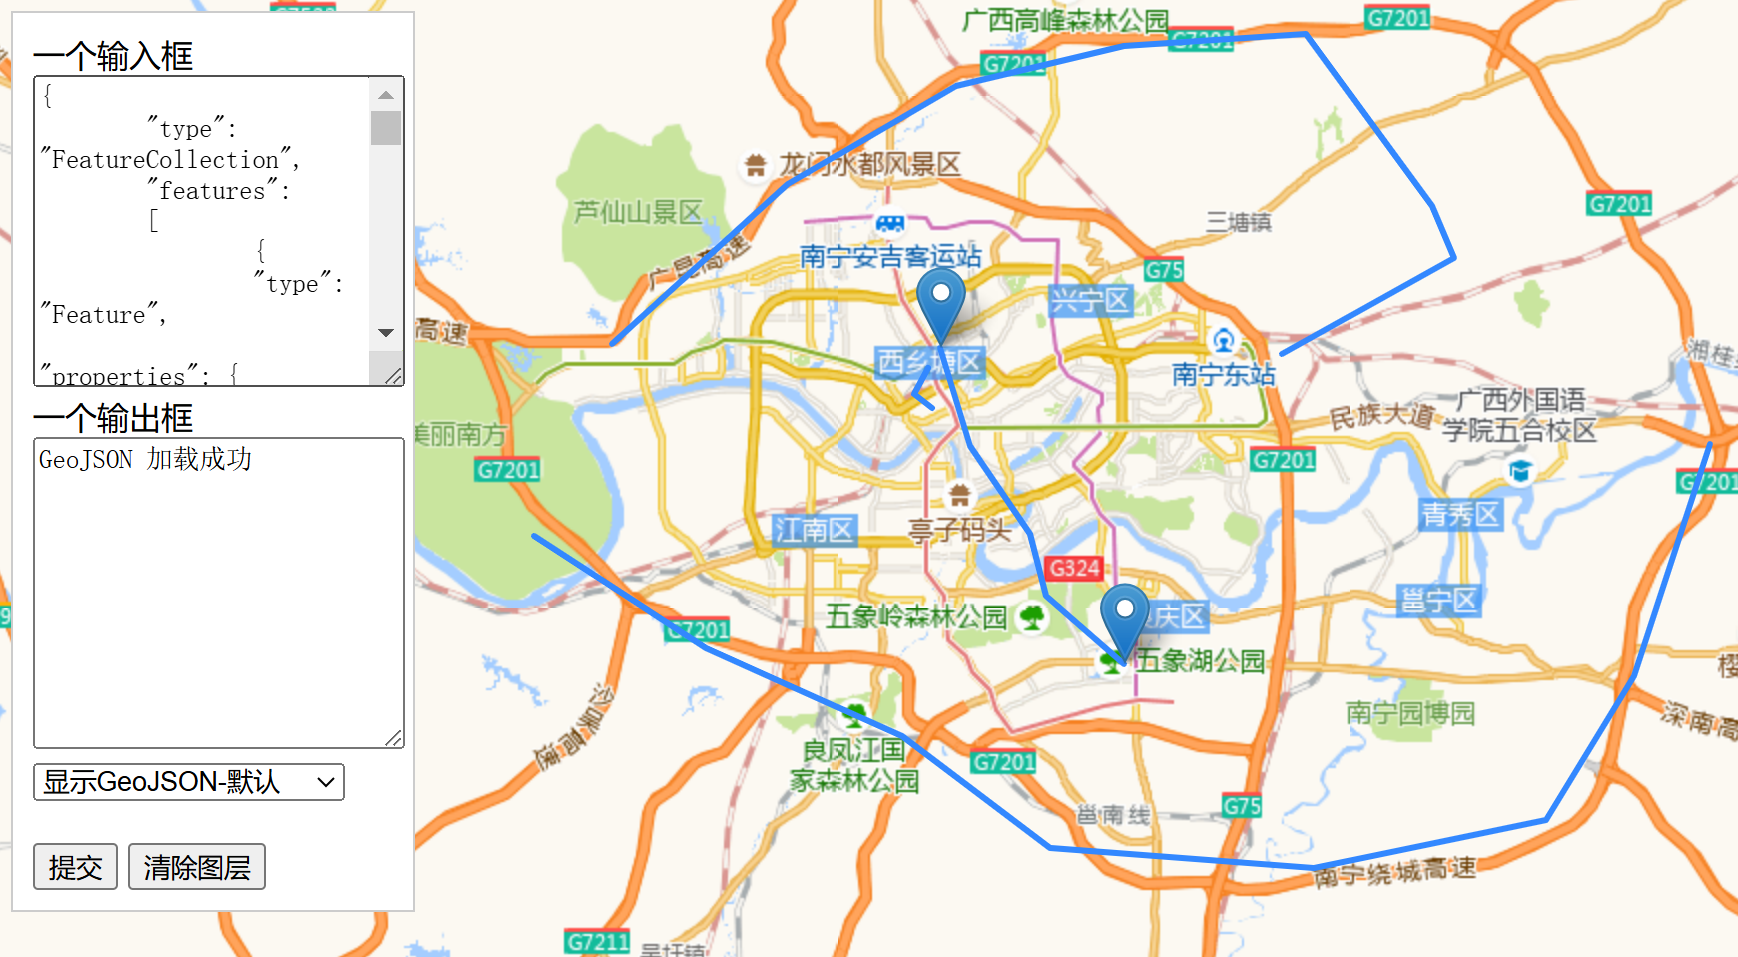
展示GeoJSON
功能:展示用户输入的GeoJSON的内容。
使用L.geoJSON即可,代码如下:
function showGeoJSON(inputStr) {try {const geojsonData = JSON.parse(inputStr);currentLayer = L.geoJSON(geojsonData).addTo(mymap);addToLayers(currentLayer);// 自动调整地图视野到恰当的位置mymap.fitBounds(currentLayer.getBounds());return "GeoJSON 加载成功";} catch (error) {return 'GeoJSON 格式错误: ' + error.message;}
}
测试数据:
{"type": "FeatureCollection","features":[{"type": "Feature","properties": {"color": "#FF00FF"},"geometry": {"type": "LineString","coordinates": [[108.316269, 22.838212],[108.326569, 22.807200],[108.347168, 22.779347],[108.352661, 22.759720],[108.379440, 22.738190]]}},{"type": "Feature","properties": {"color": "#00FF00"},"geometry": {"type": "LineString","coordinates": [[108.312063, 22.831725],[108.307085, 22.823340],[108.313522, 22.819226]]}},{"type": "Feature","properties": {"color": "#0000FF"},"geometry": {"type": "MultiLineString","coordinates": [[[108.203659,22.839477],[108.225632,22.857827],[108.263741,22.890093],[108.321762,22.921085],[108.379440,22.934049],[108.442268,22.937843],[108.485527,22.883450],[108.493080,22.866685],[108.433685,22.836313]],[[108.580627,22.807833],[108.554535,22.734390],[108.524323,22.688785],[108.444672,22.673580],[108.354034,22.679916],[108.303223,22.715390],[108.235931,22.743256],[108.176880,22.778714]]]}},{"type": "Feature","properties": {"name": "<b>广西的广西南宁</b><br>市"},"geometry": {"type": "Point","coordinates": [108.316269, 22.838212]}},{"type": "Feature","properties": {"name": "foobar<br>foo"},"geometry": {"type": "Point","coordinates": [108.37944, 22.73819]}}]
}
效果图:
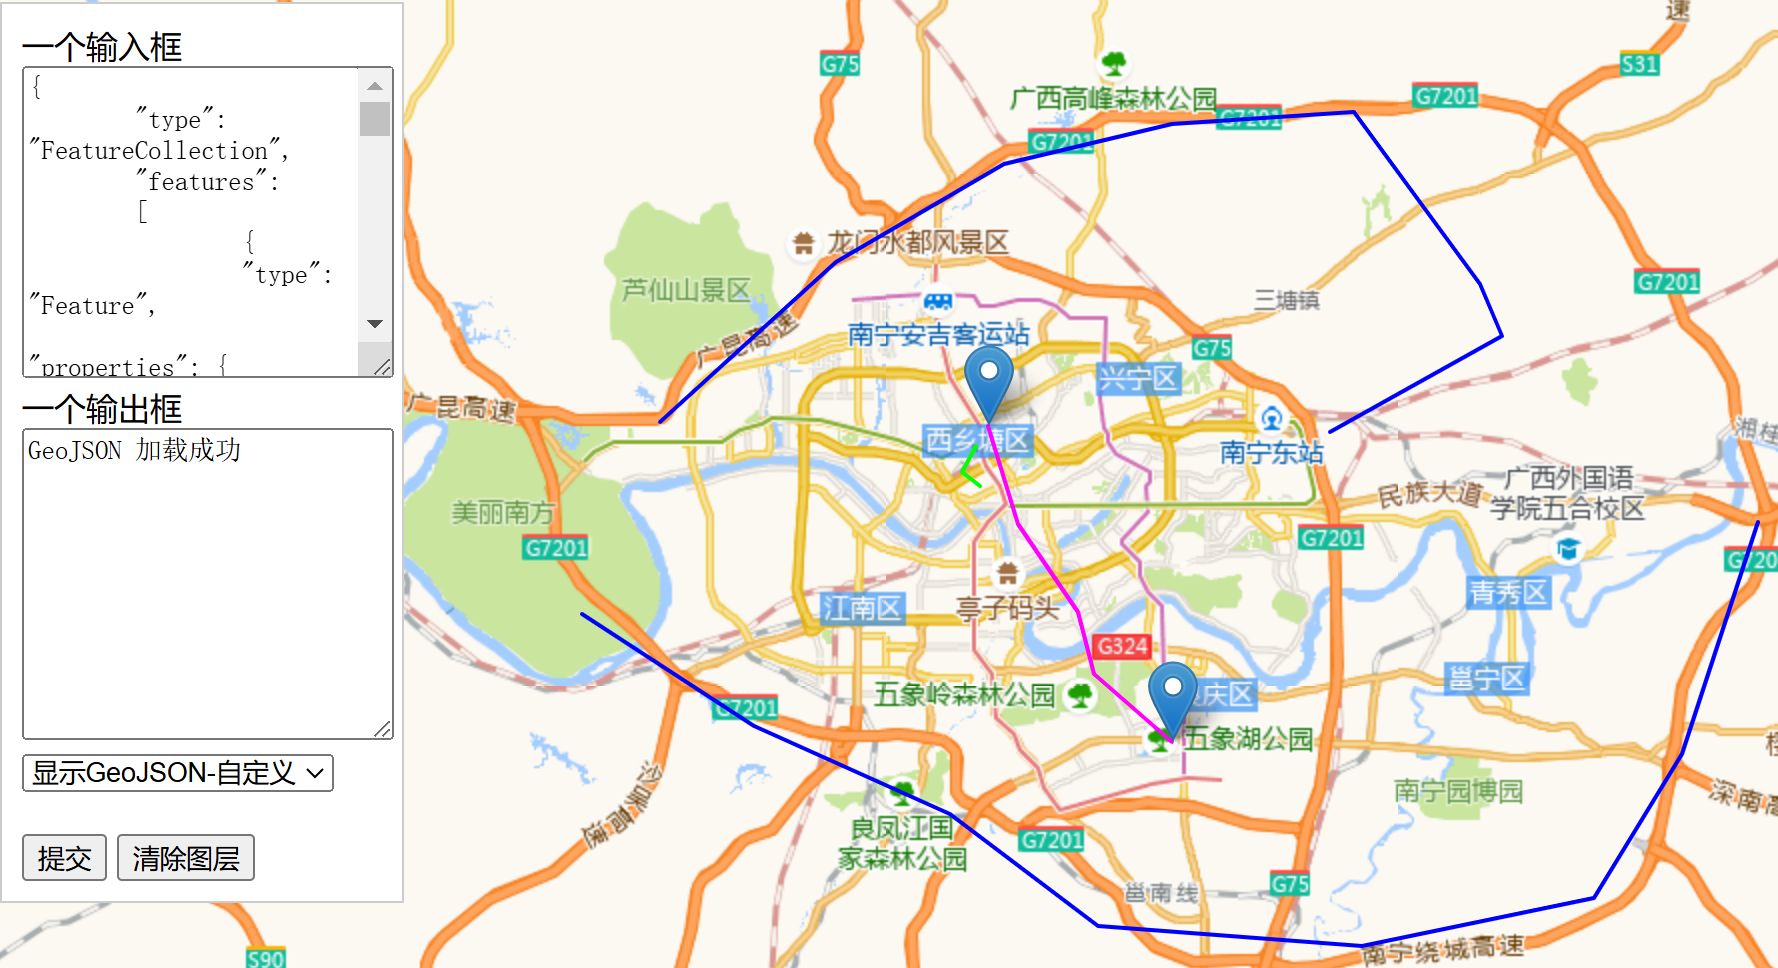
自定义方式展示GeoJSON
功能:功能同前,但展示的方式由函数drawOneLayer实现,功能更强大,可定制。
代码:
function showMyGeoJSON(inputStr) {try {const geojsonData = JSON.parse(inputStr);// console.log("geojsonData",geojsonData)currentLayer = drawOneLayer(mymap, geojsonData, {color: "#ff0000", weight: 2})addToLayers(currentLayer);// 自动调整地图视野到恰当的位置mymap.fitBounds(currentLayer.getBounds());return "GeoJSON 加载成功";} catch (error) {return 'GeoJSON 格式错误: ' + error.message;}
}function drawOneLayer(map, geoJson, {color = "#FF0000", weight = 2, dashArray = ""} = {}) {// 加载json数据var myLayer = L.geoJSON(geoJson, {// 端点// geoJsonPoint 为 geoJSON 的点point对象// geoJson 的坐标经纬度顺序是:经度、纬度,但到了本函数,似乎会自动转换经纬度顺序pointToLayer: function(geoJsonPoint, latlng) {// latlng 自动根据point类型的经纬度传入 像 [22.891922, 111.015295] 的类型var marker = L.marker(latlng, {//icon: myIcon, // 可以在此指定图标});if (geoJsonPoint.properties && geoJsonPoint.properties.name && geoJsonPoint.properties.name != "") {marker.bindPopup(geoJsonPoint.properties.name);}return marker},// 线条  样式,可通过 properties 自定义值设置style: function (feature) {// 有color才赋值if (feature.properties && feature.properties.color && feature.properties.color != "" ) {color = feature.properties.color;}return {color:  color, // feature.properties.color,weight: weight,opcacity: 0.3,fillColor: 'transparent', //区域填充颜色fillOpacity: 0, //区域填充颜色的透明dashArray: dashArray,// more...};},// other})// myLayer.addTo(map)return myLayer
}
测试数据:
{"type": "FeatureCollection","features":[{"type": "Feature","properties": {"color": "#FF00FF"},"geometry": {"type": "LineString","coordinates": [[108.316269, 22.838212],[108.326569, 22.807200],[108.347168, 22.779347],[108.352661, 22.759720],[108.379440, 22.738190]]}},{"type": "Feature","properties": {"color": "#00FF00"},"geometry": {"type": "LineString","coordinates": [[108.312063, 22.831725],[108.307085, 22.823340],[108.313522, 22.819226]]}},{"type": "Feature","properties": {"color": "#0000FF"},"geometry": {"type": "MultiLineString","coordinates": [[[108.203659,22.839477],[108.225632,22.857827],[108.263741,22.890093],[108.321762,22.921085],[108.379440,22.934049],[108.442268,22.937843],[108.485527,22.883450],[108.493080,22.866685],[108.433685,22.836313]],[[108.580627,22.807833],[108.554535,22.734390],[108.524323,22.688785],[108.444672,22.673580],[108.354034,22.679916],[108.303223,22.715390],[108.235931,22.743256],[108.176880,22.778714]]]}},{"type": "Feature","properties": {"name": "<b>广西的广西南宁</b><br>市"},"geometry": {"type": "Point","coordinates": [108.316269, 22.838212]}},{"type": "Feature","properties": {"name": "foobar<br>foo"},"geometry": {"type": "Point","coordinates": [108.37944, 22.73819]}}]
}
效果图:
小结
本文介绍了工程的主要设计方面。要特别说明的是,本工程实际主要关注的是GeoJSON的展示,使用文本框可以输入不同的数据,观察效果,笔者也收集了一些GeJSON,参考工程仓库的“数据目录”。
后续文章将重点关注业务功能,边角料的修改则忽略不提。
代码
文中列出了主要的代码片段,另有相关的工程demo,已上传到github仓库。因不定时更新,代码不一定与文中严格对应,以代码仓库为准。如使用,请自行根据实际情况修改。
仓库地址:https://github.com/latelee/mapdemo 。
本文demo文件:100.综合示例.html、utils.js,其它依赖组件文件。