m语言可视化log中的变量信息
前言
在项目开发及测试过程中,经常会和log信息打交道,比如:要查看某个变量的数值和趋势。相比逐行查找和分析,使用脚本来处理并可视化指定变量信息更加直观,且在对外作为自证材料时更显专业性和更具说服力。
由于目前工作中,多使用Matlab/Simulink开发SWC模块,本文就介绍m语言如何处理并可视化log中的变量信息。
m语言实现
log示例
可根据实际log内容,修改下文的解析代码
input_str = '2023-11-20 20:07:13,000 - log - INFO;
double = 1.1280
int = 1
hex = 0x1input_str = '2023-11-20 20:07:13,000 - log - INFO;
double = 25.1280
int = 10
hex = 0x10input_str = '2023-11-20 20:07:13,000 - log - INFO;
double = 3.1280
int = 2
hex = 0x2input_str = '2023-11-20 20:07:13,000 - log - INFO;
double = 45.1280
int = 20
hex = 0x20input_str = '2023-11-20 20:07:13,000 - log - INFO;
double = 5.1280
int = 3
hex = 0x3
解析int类型的数据
clear all; clc;
% 打开文件
filename  = 'log.txt'; file_id = fopen(filename, 'r');% 提取指定字符串后面的数字
str_pattern = '(?<=int = )(\d+)';% 读取文件内容
file_content = textscan(file_id, '%s', 'Delimiter', '\n');
file_content = file_content{1};j=1;
% 循环遍历每一行,提取匹配的浮点数并输出
for i = 1:length(file_content)current_line = file_content{i};str_match = regexp(current_line, str_pattern, 'match');% 转换匹配的数字if ~isempty(str_match)disp(str_match); disp(str_match{1});str_list(j) = str2double(str_match{1});j=j+1;end
end% 关闭文件
fclose(file_id);% 指定时间步长
step = 1;
for i = 1:length(str_list)Time(i) = step*i;
end
% 绘图
plot(Time, str_list, "r");
xlabel("Times"); ylabel("Value")
示例绘图结果
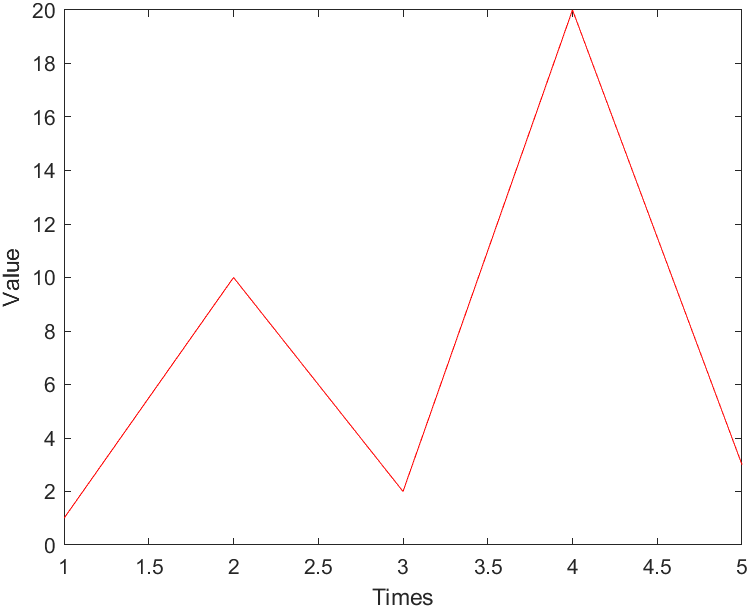
解析double类型的数据
clear all; clc;
% 打开文件
filename  = 'log.txt'; file_id = fopen(filename, 'r');% 提取指定字符串后面的数字
str_pattern = '(?<=double = )(\d+\.\d+)';% 读取文件内容
file_content = textscan(file_id, '%s', 'Delimiter', '\n');
file_content = file_content{1};j=1;
% 循环遍历每一行,提取匹配的浮点数并输出
for i = 1:length(file_content)current_line = file_content{i};str_match = regexp(current_line, str_pattern, 'match');% 转换匹配的数字if ~isempty(str_match)disp(str_match); disp(str_match{1});str_list(j) = str2double(str_match{1});j=j+1;end
end% 关闭文件
fclose(file_id);% 指定时间步长
step = 2;
for i = 1:length(str_list)Time(i) = step*i;
end
% 绘图
plot(Time, str_list, "r"); xlabel("Times"); ylabel("Value")
示例绘图结果
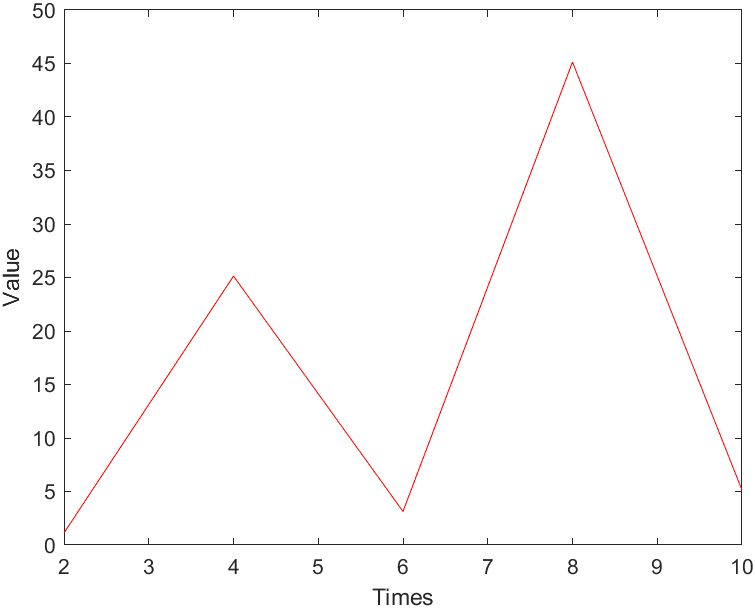
解析hex类型的数据
clear all; clc;
% 打开文件
filename  = 'log.txt'; file_id = fopen(filename, 'r');% 提取指定字符串(如:“str: ”)后面的数字
str_pattern = '(?<=hex = 0x)(\d+)';%好像只能借用整数来识别% 读取文件内容
file_content = textscan(file_id, '%s', 'Delimiter', '\n');
file_content = file_content{1};j=1;
% 循环遍历每一行,提取匹配的浮点数并输出
for i = 1:length(file_content)current_line = file_content{i};str_match = regexp(current_line, str_pattern, 'match');% 转换匹配的数字if ~isempty(str_match)disp(str_match); disp(str_match{1});%十六进制字符串转换为十进制数字str_list(j) = hex2dec(str_match{1});j=j+1;end
end% 关闭文件
fclose(file_id);% 指定时间步长
step = 10;
for i = 1:length(str_list)Time(i) = step*i;
end
plot(Time, str_list, "r");
xlabel("Times"); ylabel("Value")
示例绘图结果
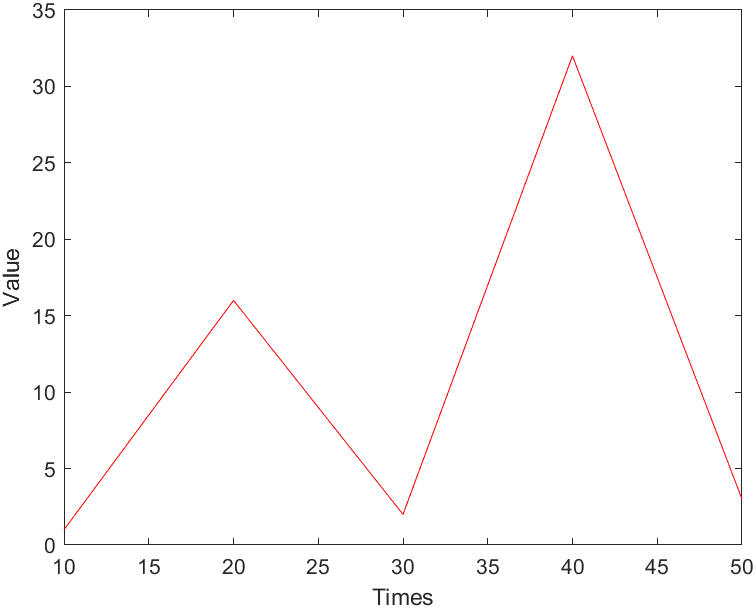
结论
可根据实际log内容,修改上述解析代码,实现对应数据的数值提取和数值趋势信息的可视化输出。