uni小程序中使用Echarts图表
前言
今天鸡米花给大家带来的是在uni里面使用echarts,能够完美支持和PC端一样的效果,我这边的工程是uni转为微信小程序,用的是vue3+vite来写的,然后实现了竖屏和横屏的展示方式,好了献上效果图。
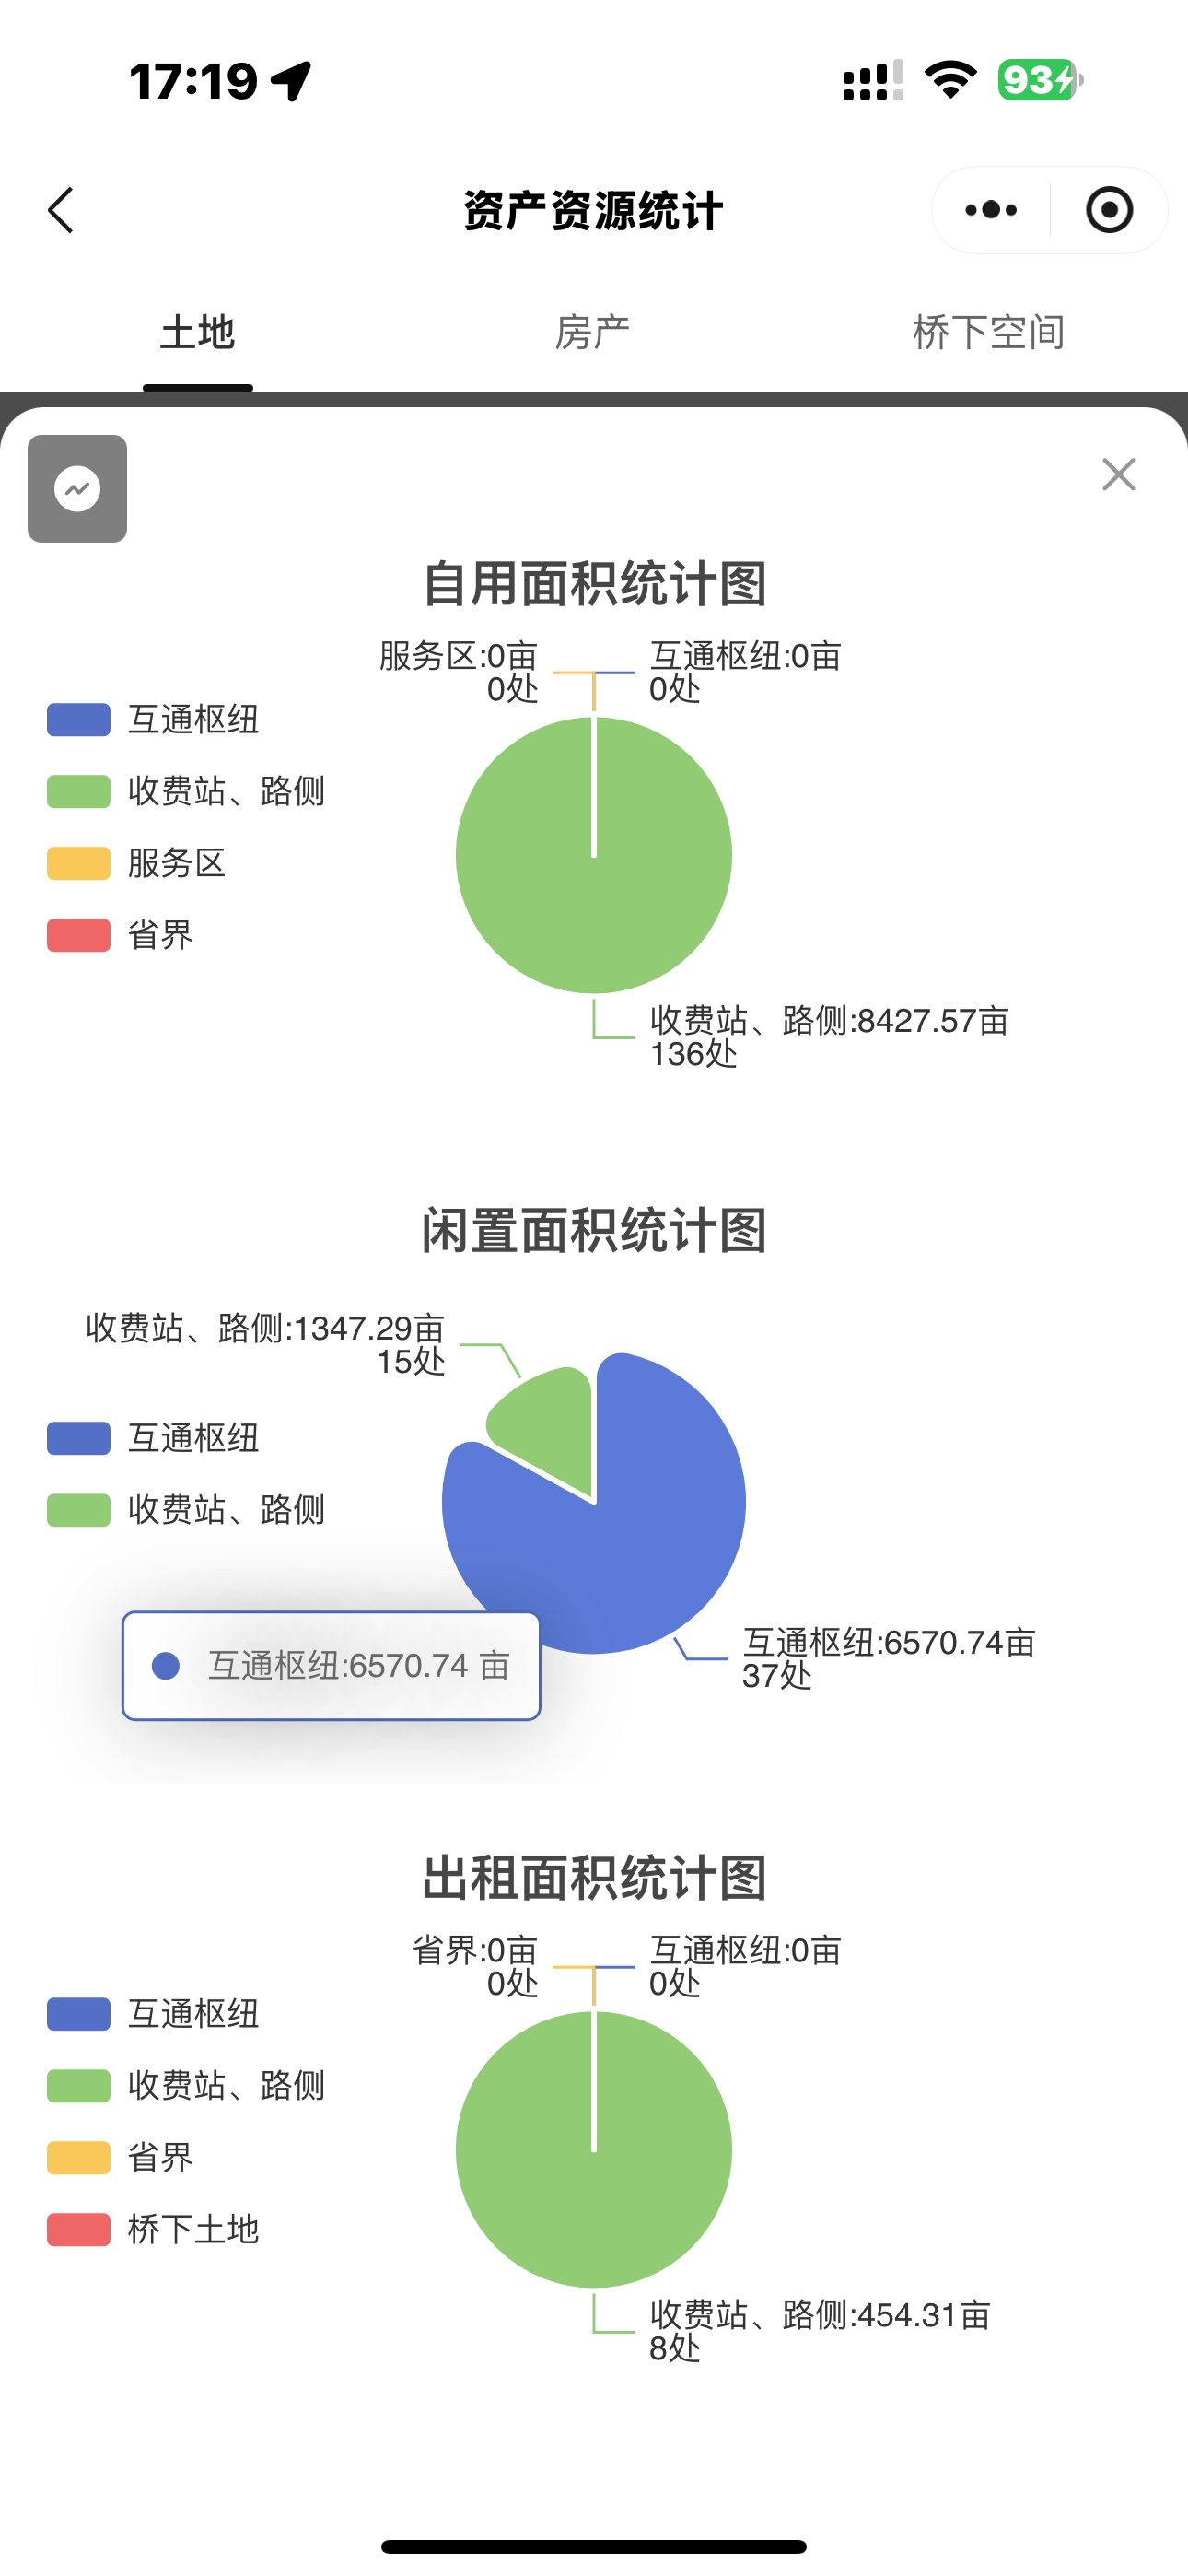
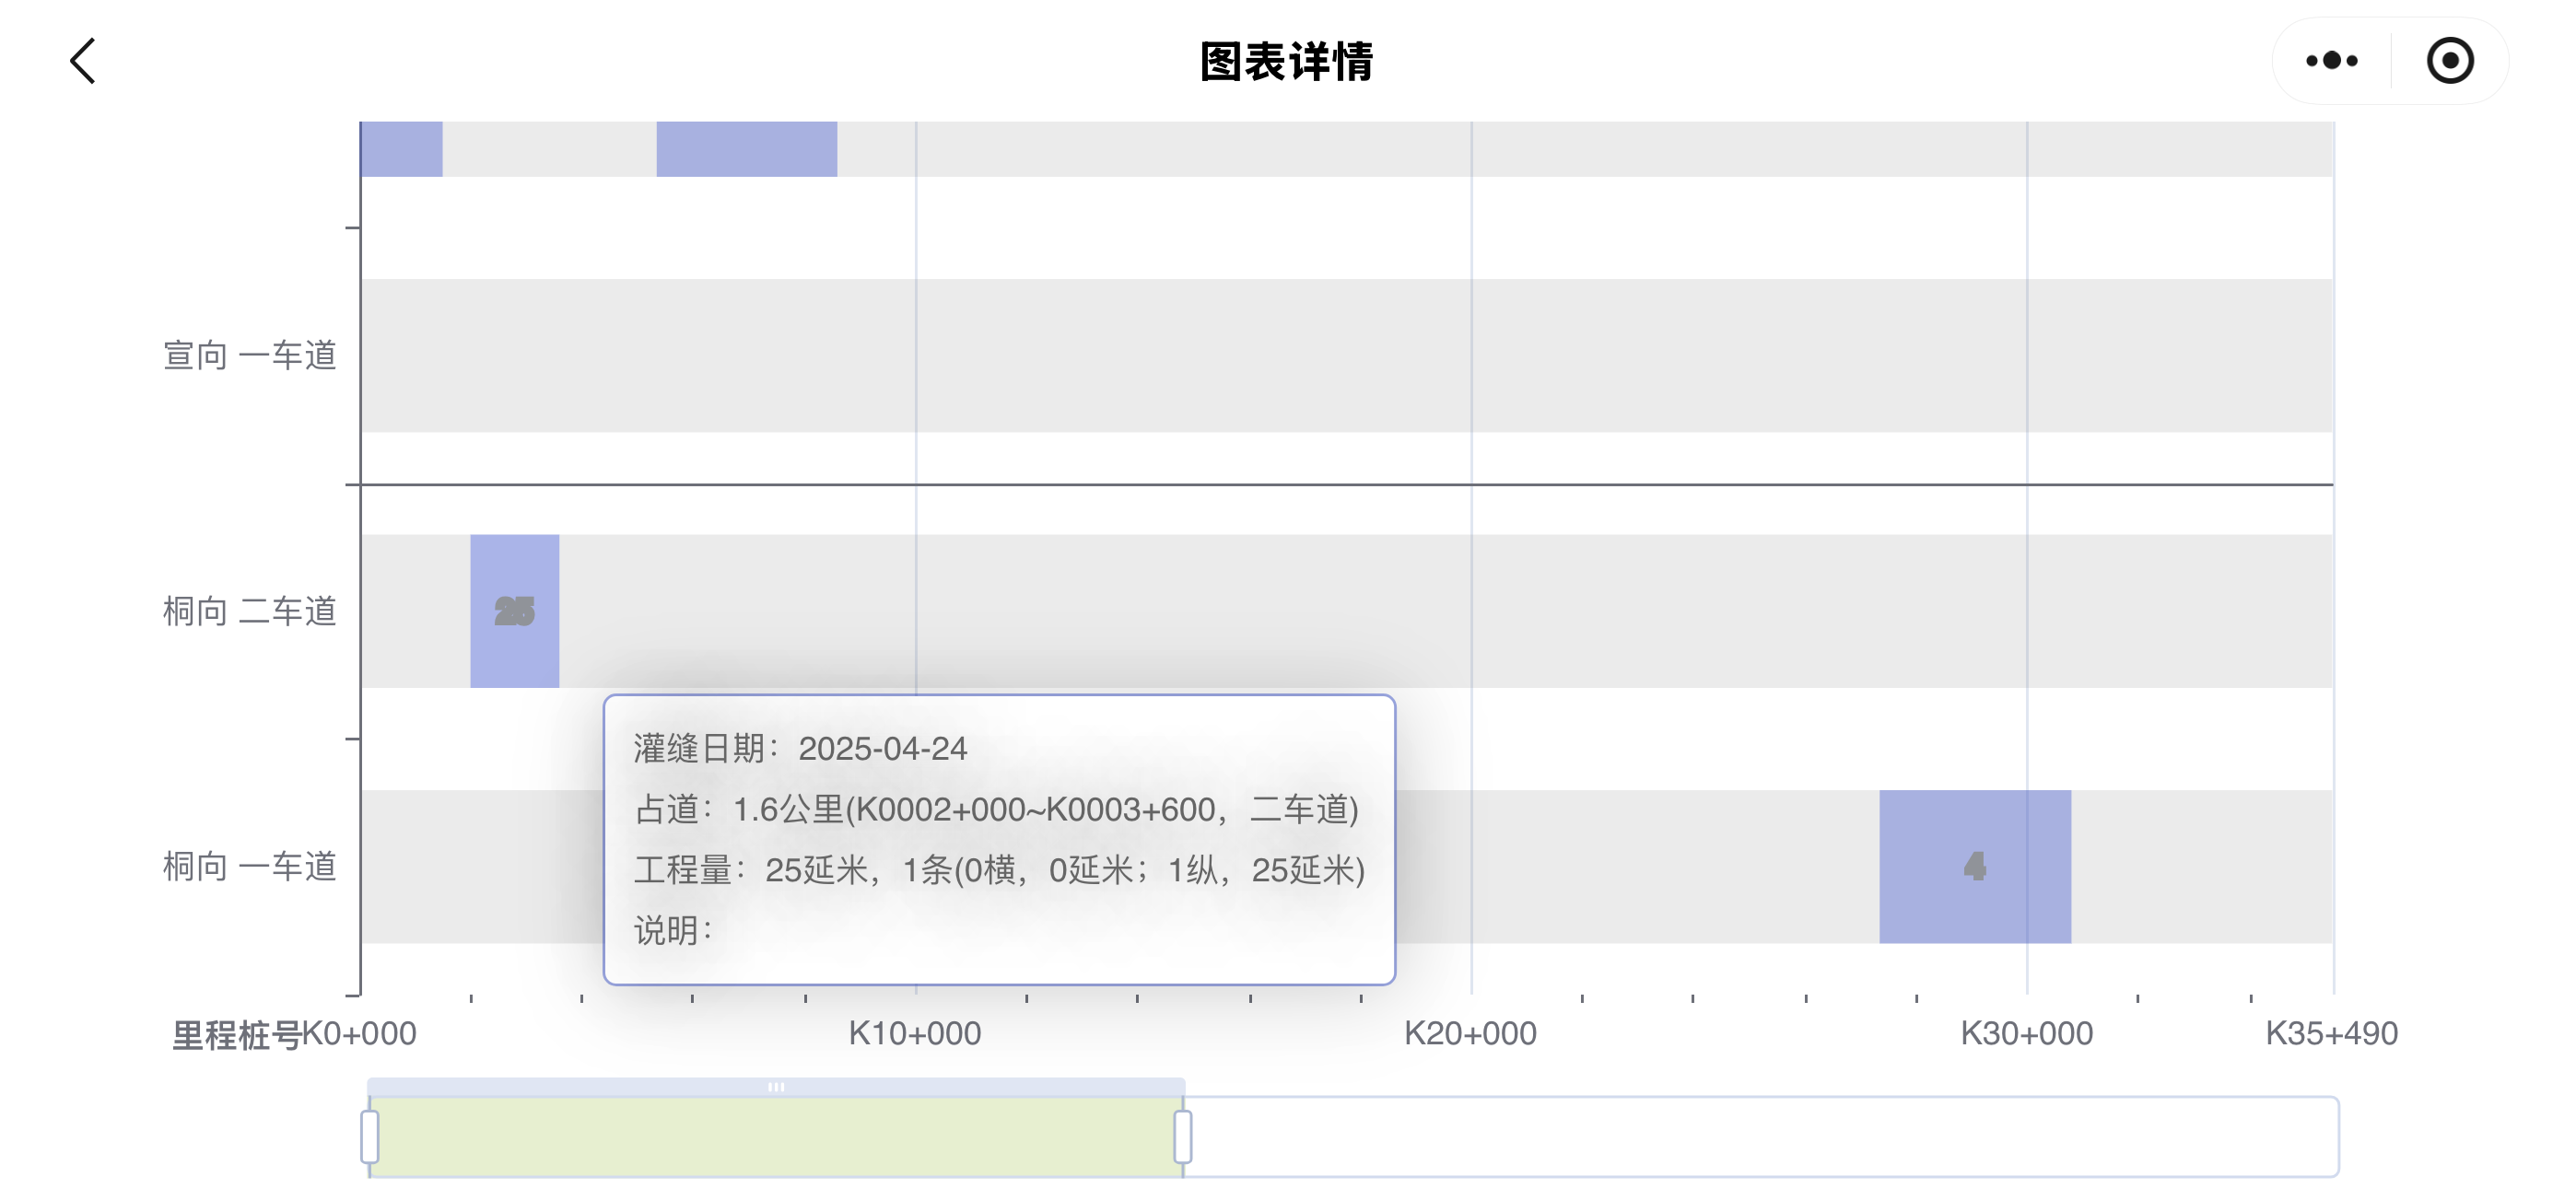
效果图
一、引入插件
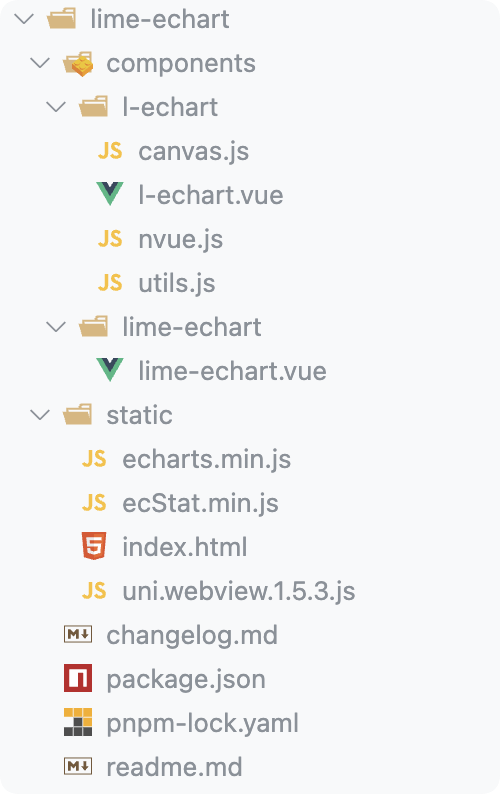
这里我们需要去到插件市场下载支持echarts的插件,附上链接。注意:由于微信小程序对主包大小有限制,所以可以去到echarts中的在线定制,按照您的需要去下载定制。以下是我项目中的目录,其中echarts.min.js就是我们在线定制的echarts资源。
二、引入组件
以下是我项目中的引入方式,大家可以作为参考:
<template><div class="eChartsCom"><l-echart@finished="init"ref="chart":custom-style="{height: '100vh',width: '100vw',}"></l-echart></div>
</template><script>
// 这里是下载的echarts.min.js
import * as echarts from "@/components/lime-echart/static/echarts.min";
// 这里是您下载的插件地址
import LEchart from "@/components/lime-echart/components/l-echart/l-echart.vue";export default {components: {LEchart,},data() {return {eChartsOption: {},};},mounted() {// 这里是您的echarts的option,我这里是做了一个通用的组件,将配置放到全局,使用的时候直接跳转路由this.eChartsOption = this.$store.state.eChartsOption;this.$refs.chart.init(echarts, (chart) => {chart.setOption(this.eChartsOption);});},methods: {async init() {const chart = await this.$refs.chart.init(echarts);chart.setOption(this.eChartsOption);},},
};
</script>
由于以上组件是针对横向图表的一个全屏展示,所以需要在pages.json中配置一下横屏显示的代码,关键属性为"pageOrientation": "landscape"
{"path": "componentPages/eChartsCom/index","style": {"navigationBarTitleText": "图表详情","pageOrientation": "landscape"}
}
三、完整代码
以下为完整代码,大家可以做一个参考
<template><div class="eChartLine"><l-echart @finished="init" ref="chart"></l-echart></div>
</template>
<script>
import * as echarts from "@/components/lime-echart/static/echarts.min";
import LEchart from "@/components/lime-echart/components/l-echart/l-echart.vue";
export default {components: {LEchart,},data() {return {chartData: null,show: false,isArea: true,isPopupArea: true,};},mounted() {this.initChart();},methods: {async init() {const chart = await this.$refs.chart.init(echarts);chart.setOption(this.eChartsOption);},initChart() {let data = [];for (let index = 0; index < 10; index++) {let value = indexlet obj = {value,name: "数据"+index,};data.push(obj);}this.eChartsOption = {title: {text: `数量统计图`,top: 50,left: "center",},tooltip: {trigger: "item",},legend: {top: 80,left: "center",},series: [{name: "数量",type: "pie",radius: ["40%", "70%"],avoidLabelOverlap: false,itemStyle: {borderRadius: 10,borderColor: "#fff",borderWidth: 2,},label: {show: false,position: "center",},emphasis: {label: {show: true,fontSize: 40,fontWeight: "bold",},},labelLine: {show: false,},data,},],};this.$refs.chart.init(echarts, (chart) => {chart.setOption(this.eChartsOption);});},},
}
</script>
结语
以上就是鸡米花分享的全部内容啦,如果在使用中有任何问题,欢迎在评论区交流沟通!