三、Envoy的管理接口
因语雀和CSDN MarkDown格式有区别,导入到CSDN时可能会有格式显示问题,请查看原文链接:
https://www.yuque.com/dycloud/pss8ys
一、管理接口 admin
1.1 管理接口介绍
Envoy内建了一个管理服务(administration server),它支持查询和修改操作,甚至有可能暴露私有数据(例如统计数据、集群名称和证书信息等),因此非常有必要精心编排其访问控制机制以避免非授权访问;
Envoy 的管理接口是一个基于 HTTP/JSON 的 API,提供对代理实例的实时监控和控制能力。该接口默认监听地址为 <font style="color:rgb(251, 71, 135);">0.0.0.0:9901</font>,可通过配置修改。
核心功能
- 实时监控:获取性能指标
- 动态配置:热更新部分配置
- 运行时控制:调整运行时参数
- 诊断工具:进行健康检查和状态分析
admin:access_log: [] # 访问日志协议的相关配置,通常需要指定日志过滤器及日志配置等;access_log_path: ... # 管理接口的访问日志文件路径,无须记录访问日志时使用/dev/null;profile_path: ... # cpu profiler的输出路径,默认为/var/log/envoy/envoy.prof;address: # 监听的套接字;socket_address: protocol: ...address: ...port_value: ...
下面是一个简单的配置实例
admin:access_log_path: /tmp/admin_access.logaddress:socket_address: { address: 0.0.0.0, port_value: 9901 }
# 提示:此处 仅为出于方便测试的目的,才设定其监听于对外通信的任意IP地址;安全起见,应该使用127.0.0.1;
1.2 为 Envoy 添加管理接口
envoy.yaml
admin:profile_path: /tmp/envoy.profaccess_log_path: /tmp/admin_access.logaddress:socket_address:address: 0.0.0.0port_value: 9901static_resources:listeners:- name: listener_0address:socket_address: { address: 0.0.0.0, port_value: 8080 }filter_chains:- filters:- name: envoy.filters.network.http_connection_managertyped_config:"@type": type.googleapis.com/envoy.extensions.filters.network.http_connection_manager.v3.HttpConnectionManagerstat_prefix: ingress_httpcodec_type: AUTOroute_config:name: local_routevirtual_hosts:- name: web_service_1domains: ["*.nice.io", "nice.io"]routes:- match: { prefix: "/" }route: { cluster: local_cluster }- name: web_service_2domains: ["*.dujie.com",“dujie.com"]routes:- match: { prefix: "/" }redirect:host_redirect: "www.nice.io"http_filters:- name: envoy.filters.http.routertyped_config:"@type": type.googleapis.com/envoy.extensions.filters.http.router.v3.Routerclusters:- name: local_clusterconnect_timeout: 0.25stype: STATIClb_policy: ROUND_ROBINload_assignment:cluster_name: local_clusterendpoints:- lb_endpoints:- endpoint:address:socket_address: { address: 172.31.2.11, port_value: 8080 }- endpoint:address:socket_address: { address: 172.31.2.12, port_value: 8080 }
docker-compose
version: '3.3'services:envoy:image: envoyproxy/envoy:v1.35.0volumes:- ./envoy.yaml:/etc/envoy/envoy.yamlenvironment:- ENVOY_UID=0- ENVOY_GID=0privileged: truenetworks:envoymesh:ipv4_address: 172.31.5.2aliases:- front-proxydepends_on:- webserver01- webserver02webserver01:image: harbor.test.com/nginx-app:v1.0environment:- PORT=8080hostname: webserver01networks:envoymesh:ipv4_address: 172.31.5.11aliases:- webserver01webserver02:image: harbor.test.com/nginx-app:v1.0environment:- PORT=8080hostname: webserver02networks:envoymesh:ipv4_address: 172.31.5.12aliases:- webserver02networks:envoymesh:driver: bridgeipam:config:- subnet: 172.31.5.0/24
测试
[root@VM_24_47_tlinux /usr/local/src]# curl 172.31.5.2:9901/ready
LIVE
[root@VM_24_47_tlinux /usr/local/src]# curl 172.31.5.2:9901/listeners
listener_0::0.0.0.0:8080
[root@VM_24_47_tlinux /usr/local/src]# curl -s  172.31.5.2:9901/config_dump  |head -n 20
{"configs": [{"@type": "type.googleapis.com/envoy.admin.v3.BootstrapConfigDump","bootstrap": {"node": {"user_agent_name": "envoy","user_agent_build_version": {"version": {"major_number": 1,"minor_number": 35},"metadata": {"revision.sha": "84305a6cb64bd55aaf606bdd53de7cd6080427a1","build.type": "RELEASE","ssl.version": "BoringSSL","revision.status": "Clean"}},"extensions": [
二、 管理接口 admin 路径
2.1 常用端点
admin接口内置了多个/path,不同的path可能会分别接受不同的GET或POST请求;
admin commands are:
/: Admin home page # GET
/ready:Outputs a string and error code reflecting the state of the server. # GET,返回envoy服务当前的状态;
/certs: print certs on machine # GET,列出已加载的所有TLS证书及相关的信息;
/clusters: upstream cluster status # GET,额外支持使用“GET /clusters?format=json”
/config_dump: dump current Envoy configs # GET,打印Envoy加载的各类配置信息;支持include_eds、master和resource等查询参数;
/contention: dump current Envoy mutex contention stats (if enabled) # GET,互斥跟踪
/cpuprofiler: enable/disable the CPU profiler # POST,启用或禁用cpuprofiler
/healthcheck/fail: cause the server to fail health checks # POST,强制设定HTTP健康状态检查为失败;
/healthcheck/ok: cause the server to pass health checks # POST,强制设定HTTP健康状态检查为成功;
/heapprofiler: enable/disable the heap profiler # POST,启用或禁用heapprofiler;
/help: print out list of admin commands
/hot_restart_version: print the hot restart compatibility version # GET,打印热重启相关的信息;
/listeners: print listener addresses # GET,列出所有侦听器,支持使用“GET /listeners?format=json”
/drain_listeners:Drains all listeners. # POST,驱逐所有的listener,支持使用inboundonly(仅入站侦听器)和graceful(优雅关闭)等查询参数;
/logging: query/change logging levels # POST,启用或禁用不同子组件上的不同日志记录级别
/memory: print current allocation/heap usage # POST,打印当前内在分配信息,以字节为单位;
/quitquitquit: exit the server # POST,干净退出服务器;
/reset_counters: reset all counters to zero # POST,重围所有计数器;
/tap:This endpoint is used for configuring an active tap session. # POST,用于配置活动的带标签的session;//reopen_logs:Triggers reopen of all access logs. Behavior is similar to SIGUSR1 handling. # POST,重新打开所有的日志,功能类似于SIGUSR1信号;
/runtime: print runtime values # GET,以json格式输出所有运行时相关值;
/runtime_modify: modify runtime values # POST /runtime_modify?key1=value1&key2=value2,添加或修改在查询参数中传递的运行时值
/server_info: print server version/status information # GET,打印当前Envoy Server的相关信息;
/stats: print server stats # 按需输出统计数据,例如GET /stats?filter=regex,另外还支持json和prometheus两种输出格式;
/stats/prometheus: print server stats in prometheusformat # 输出prometheus格式的统计信息;
常用 path
| 端点 | 方法 | 功能 |
|---|---|---|
<font style="color:rgb(251, 71, 135);">/stats</font> | GET | 获取所有指标 |
<font style="color:rgb(251, 71, 135);">/stats/prometheus</font> | GET | Prometheus格式指标 |
<font style="color:rgb(251, 71, 135);">/config_dump</font> | GET | 导出完整配置 |
<font style="color:rgb(251, 71, 135);">/logging</font> | POST | 动态调整日志级别 |
<font style="color:rgb(251, 71, 135);">/runtime_modify</font> | POST | 修改运行时参数 |
<font style="color:rgb(251, 71, 135);">/hot_restart_version</font> | GET | 热重启版本信息 |
2.2 核心管理端点详解
2.2.1 <font style="color:#DF2A3F;">/stats </font>(性能指标)
关键参数:
<font style="color:rgb(251, 71, 135);">filter</font>:指标名过滤(正则表达式)<font style="color:rgb(251, 71, 135);">usedonly</font>:仅显示使用过的指标<font style="color:rgb(251, 71, 135);">type</font>:指标类型(Counter/Gauge/Histogram)
# 获取所有以http开头的指标
[root@VM_24_47_tlinux /usr/local/src]# curl -s http://172.31.5.2:9901/stats?filter=http.*  |head -n 10
cluster.local_cluster.upstream_cx_http1_total: 0
cluster.local_cluster.upstream_cx_http2_total: 0
cluster.local_cluster.upstream_cx_http3_total: 0
cluster.local_cluster.upstream_http3_broken: 0
http.admin.downstream_cx_active: 1
http.admin.downstream_cx_delayed_close_timeout: 0
http.admin.downstream_cx_destroy: 16
http.admin.downstream_cx_destroy_active_rq: 0
http.admin.downstream_cx_destroy_local: 0
http.admin.downstream_cx_destroy_local_active_rq: 0
2.2.2 <font style="color:#DF2A3F;">/config_dump</font> (配置导出)
参数:
<font style="color:rgb(251, 71, 135);">include_eds</font>:包含EDS配置(默认false)<font style="color:rgb(251, 71, 135);">resource</font>:指定资源类型(listeners/clusters等)
[root@VM_24_47_tlinux /usr/local/src]# curl -s  http://172.31.5.2:9901/config_dump |head -n 20
{"configs": [{"@type": "type.googleapis.com/envoy.admin.v3.BootstrapConfigDump","bootstrap": {"node": {"user_agent_name": "envoy","user_agent_build_version": {"version": {"major_number": 1,"minor_number": 35},"metadata": {"revision.status": "Clean","build.type": "RELEASE","ssl.version": "BoringSSL","revision.sha": "84305a6cb64bd55aaf606bdd53de7cd6080427a1"}},"extensions": [
2.2.3 <font style="color:#DF2A3F;">/logging</font> (日志控制)
参数:
<font style="color:rgb(251, 71, 135);">level</font>:日志级别(trace/debug/info/warn/error/critical)<font style="color:rgb(251, 71, 135);">logger</font>:指定日志组件(可选)
# 设置所有组件为debug级别
[root@VM_24_47_tlinux /usr/local/src]#curl -X POST http://localhost:9901/logging?level=debug
active loggers:admin: debugalternate_protocols_cache: debugaws: debugassert: debugbacktrace: debugbasic_auth: debugcache_filter: debugclient: debugconfig: debugconnection: debugconn_handler: debugcompression: debugcredential_injector: debugdecompression: debugdns: debugdubbo: debugenvoy_bug: debugext_authz: debugext_proc: debugrocketmq: debugfile: debug...# 仅设置HTTP连接管理器日志
[root@VM_24_47_tlinux /usr/local/src]# curl -X POST http://172.31.5.2:9901/logging?http=info
2.2.4 <font style="color:#DF2A3F;">/clusters</font> (获取已配置集群)
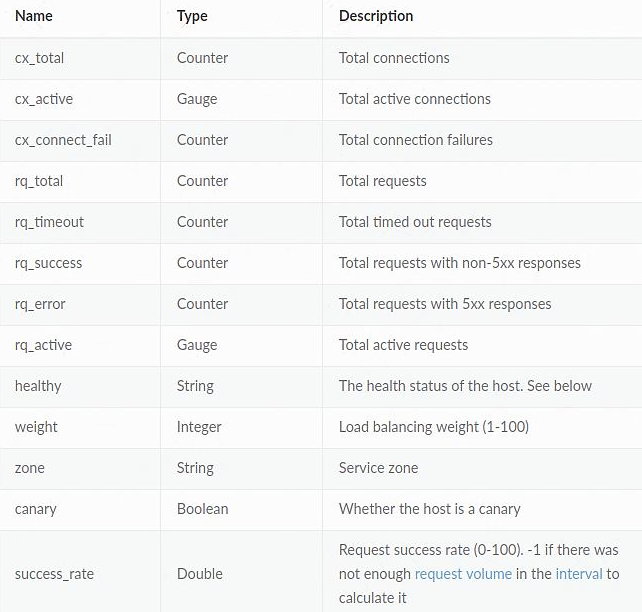
列出所有已配置的集群,包括每个集群中发现的所有上游主机以及每个主机的统计信息;支持输出为json格式;
- 集群管理器信息:“version_info string”,无CDS时,则显示为“version_info::static”
- 集群相关的信息:断路器、异常点检测和用于表示是否通过CDS添加的标识“add_via_api”
每个主机的统计信息:包括总连接数、活动连接数、总请求数和主机的健康状态等;不健康的原因通常有以下三种
<font style="color:rgb(226,140,157);"></font><font style="color:rgb(0,0,0);">failed_active_hc</font>:未通过主动健康状态检测;<font style="color:rgb(226,140,157);"></font><font style="color:rgb(0,0,0);">failed_eds_health</font>:被EDS标记为不健康;<font style="color:rgb(226,140,157);"></font><font style="color:rgb(0,0,0);">failed_outlier_check</font>:未通过异常检测机制的检查;
[root@VM_24_47_tlinux /usr/local/src]# curl -X GET  http://172.31.5.2:9901/clusters
local_cluster::observability_name::local_cluster
local_cluster::default_priority::max_connections::1024
local_cluster::default_priority::max_pending_requests::1024
local_cluster::default_priority::max_requests::1024
local_cluster::default_priority::max_retries::3
local_cluster::high_priority::max_connections::1024
local_cluster::high_priority::max_pending_requests::1024
local_cluster::high_priority::max_requests::1024
local_cluster::high_priority::max_retries::3
local_cluster::added_via_api::false
local_cluster::172.31.2.11:8080::cx_active::0
local_cluster::172.31.2.11:8080::cx_connect_fail::0
local_cluster::172.31.2.11:8080::cx_total::0
local_cluster::172.31.2.11:8080::rq_active::0
local_cluster::172.31.2.11:8080::rq_error::0
local_cluster::172.31.2.11:8080::rq_success::0
local_cluster::172.31.2.11:8080::rq_timeout::0
local_cluster::172.31.2.11:8080::rq_total::0
local_cluster::172.31.2.11:8080::hostname::
local_cluster::172.31.2.11:8080::health_flags::healthy
local_cluster::172.31.2.11:8080::weight::1
local_cluster::172.31.2.11:8080::region::
local_cluster::172.31.2.11:8080::zone::
local_cluster::172.31.2.11:8080::sub_zone::
local_cluster::172.31.2.11:8080::canary::false
local_cluster::172.31.2.11:8080::priority::0
local_cluster::172.31.2.11:8080::success_rate::-1
local_cluster::172.31.2.11:8080::local_origin_success_rate::-1
local_cluster::172.31.2.12:8080::cx_active::0
local_cluster::172.31.2.12:8080::cx_connect_fail::0
local_cluster::172.31.2.12:8080::cx_total::0
local_cluster::172.31.2.12:8080::rq_active::0
local_cluster::172.31.2.12:8080::rq_error::0
local_cluster::172.31.2.12:8080::rq_success::0
local_cluster::172.31.2.12:8080::rq_timeout::0
local_cluster::172.31.2.12:8080::rq_total::0
local_cluster::172.31.2.12:8080::hostname::
local_cluster::172.31.2.12:8080::health_flags::healthy
local_cluster::172.31.2.12:8080::weight::1
local_cluster::172.31.2.12:8080::region::
local_cluster::172.31.2.12:8080::zone::
local_cluster::172.31.2.12:8080::sub_zone::
local_cluster::172.31.2.12:8080::canary::false
local_cluster::172.31.2.12:8080::priority::0
local_cluster::172.31.2.12:8080::success_rate::-1
local_cluster::172.31.2.12:8080::local_origin_success_rate::-1
2.2.5 <font style="color:#DF2A3F;">/ready </font>(获取 Server 是否就绪)
获取Server就绪与否的状态,LIVE状态为200,否则为503;
[root@VM_24_47_tlinux /usr/local/src]# curl -X GET  http://172.31.5.2:9901/ready
LIVE