1. 地图可视化
"""
@Project : 01-python-learn
@File : 05_简单地图案例.py
@IDE : PyCharm
@Author : 刘庆东
@Date : 2025/9/22 15:01
"""
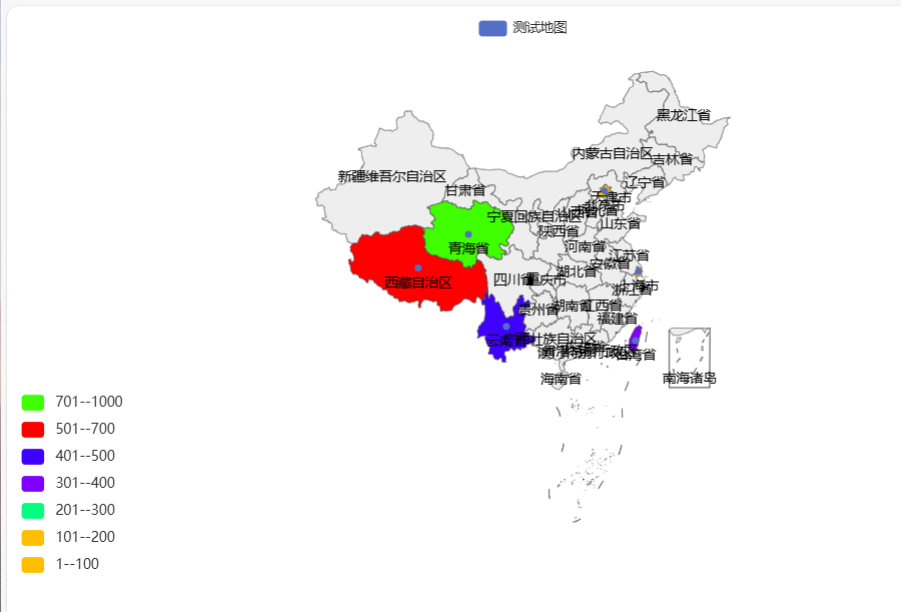
from pyecharts.charts import Map
from pyecharts.options import VisualMapOpts
map = Map()
data=[("北京市", 88),("上海市", 188),("广州市", 288),("台湾省", 388),("云南省", 588),("西藏自治区", 688),("青海省", 788),
]
map.add("测试地图",data,"china")
map.set_global_opts(visualmap_opts=VisualMapOpts(is_show=True,is_piecewise=True,pieces=[{"min": 1,"max": 100,"label":"1--100","color": "#ffbf00"},{"min": 101, "max": 200, "label": "101--200", "color": "#ffbf00"},{"min": 201, "max": 300, "label": "201--300", "color": "#00ff80"},{"min": 301, "max": 400, "label": "301--400", "color": "#7f00ff"},{"min": 401, "max": 600, "label": "401--500", "color": "#4000ff"},{"min": 600, "max": 700, "label": "501--700", "color": "#ff0000"},{"min": 701, "max": 1000, "label": "701--1000", "color": "#40ff00"},]))
map.render()print("绘图成功了")