开源监控利器Prometheus+Grafana在银河麒麟操作系统的落地实践
前言
在当今的IT基础设施管理中,监控系统的重要性不言而喻。无论是传统的物理服务器、虚拟机,还是现代的容器化环境,一个可靠的监控系统能够帮助我们及时发现潜在问题、预防系统故障、优化资源利用率。对于国产化的银河麒麟操作系统,构建一套完善的监控体系更是保障业务连续性的关键环节。

本文将详细介绍如何使用Prometheus和Grafana这两个开源监控领域的黄金组合,来构建一套功能全面、可视化的银河麒麟操作系统监控方案。无论您是系统管理员、运维工程师还是技术爱好者,都能从本文中获得实用的知识和技能。
一、监控系统概述与组件介绍
1.1 为什么需要监控系统
在现代IT环境中,监控系统扮演着"眼睛"和"耳朵"的角色。它能够:
- 实时掌握系统状态:了解CPU、内存、磁盘、网络等资源的使用情况
- 故障预警与诊断:提前发现问题征兆,快速定位故障根源
- 性能分析与优化:识别性能瓶颈,为系统优化提供数据支持
- 容量规划:基于历史数据预测资源需求,合理规划硬件资源
- 合规性与审计:满足行业监管要求,提供历史运行数据
1.2 Prometheus简介
Prometheus是由SoundCloud开发的开源系统监控和警报工具包,于2016年加入Cloud Native Computing Foundation(CNCF),成为继Kubernetes之后的第二个毕业项目。其主要特点包括:
- 多维数据模型:通过指标名称和键值对标签来标识时间序列数据
- 强大的查询语言PromQL:允许用户实时选择和聚合时间序列数据
- 不依赖分布式存储:单个服务器节点自治
- 通过HTTP拉取模式采集数据:同时也支持推送模式
- 可通过网关支持推送时间序列
- 多种图形和仪表板支持模式
1.3 Grafana简介
Grafana是一个开源的指标分析和可视化工具,常用于可视化大规模指标数据。Grafana支持多种数据源,包括:
- Prometheus
- Graphite
- Elasticsearch
- InfluxDB
- MySQL/PostgreSQL等
Grafana提供了强大的可视化功能,允许用户创建、探索和共享精美的仪表板,并通过正确的可视化方式来理解数据。
1.4 银河麒麟操作系统简介
银河麒麟操作系统是我国自主研发的Linux操作系统,针对国产CPU平台(如龙芯、申威、飞腾、兆芯等)进行了大量优化和完善。它广泛应用于政府、国防、金融、能源等关键领域,是实现信息技术应用创新的重要基础软件。
二、环境准备与规划
2.1 系统环境要求
在开始部署之前,我们需要准备以下环境:
硬件要求:
- 监控服务器:至少4核CPU,8GB内存,100GB存储
- 被监控节点:至少1核CPU,2GB内存,10GB存储
软件要求:
- 银河麒麟操作系统 V10(AMD64或ARM64架构)
- Prometheus 2.30+
- Node Exporter 1.2+
- Grafana 8.0+
网络要求:
- 所有被监控节点与监控服务器网络互通
- 开放相应端口(默认9090用于Prometheus,9100用于Node Exporter,3000用于Grafana)
2.2 安装前准备
首先,在所有节点上更新系统并安装必要的工具:
# 安装常用工具
[root@localhost ~]# yum install -y wget curl vim net-tools
# 检查系统版本
[root@localhost ~]# nkvers
############## Kylin Linux Version #################
Release:
Kylin Linux Advanced Server release V10 (Halberd)Kernel:
4.19.90-89.11.v2401.ky10.x86_64Build:
Kylin Linux Advanced Server
release V10 SP3 2403/(Halberd)-x86_64-Build20/20240426
#################################################
# 检查内核版本
[root@localhost ~]# uname -r
4.19.90-89.11.v2401.ky10.x86_64
# 检查系统架构
[root@localhost ~]# arch
x86_64
三 Prometheus部署与配置
3.1 下载与安装Prometheus
首先,在监控服务器上安装Prometheus:
1)配置hosts文件
# 设置主机名
[root@localhost ~]# hostnamectl set-hostname prometheus
[root@localhost ~]# hostname
prometheus
[root@localhost ~]# cat /etc/hosts
127.0.0.1   localhost localhost.localdomain localhost4 localhost4.localdomain4
::1         localhost localhost.localdomain localhost6 localhost6.localdomain6
192.168.17.181 prometheus
2)关闭防火墙
[root@localhost ~]# systemctl stop firewalld.service
[root@localhost ~]# systemctl disable firewalld.service
Removed /etc/systemd/system/multi-user.target.wants/firewalld.service.
Removed /etc/systemd/system/dbus-org.fedoraproject.FirewallD1.service.
[root@localhost ~]# systemctl status firewalld.service
● firewalld.service - firewalld - dynamic firewall daemonLoaded: loaded (/usr/lib/systemd/system/firewalld.service; disabled; vendor preset: enabled)Active: inactive (dead) since Thu 2025-09-18 11:39:25 CST; 50s agoDocs: man:firewalld(1)Main PID: 1203 (code=exited, status=0/SUCCESS)
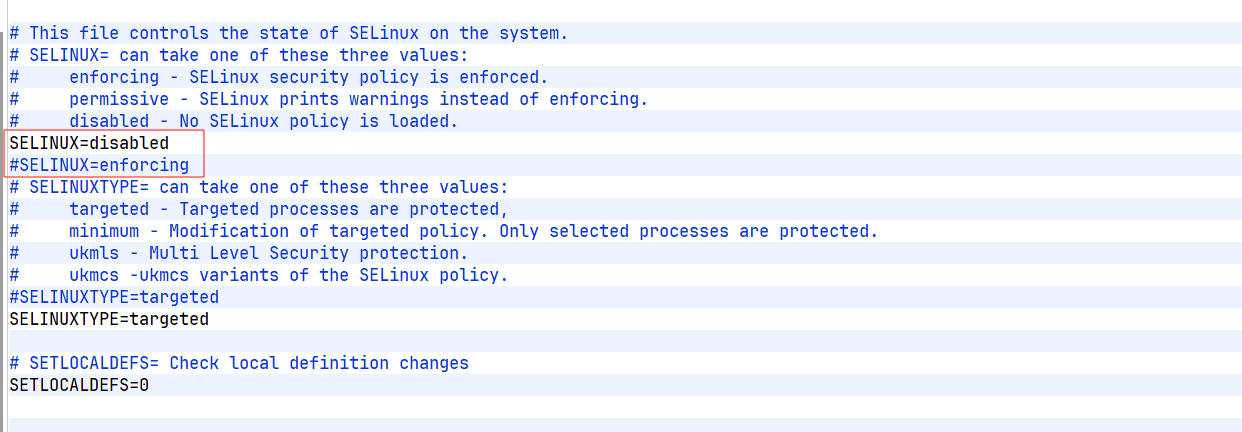
3)禁用selinux
[root@localhost ~]# vim /etc/selinux/config
4)下载Prometheus安装包
访问官网:https://prometheus.io/ 下载:

5)选择所需的操作系统和架构下载安装包
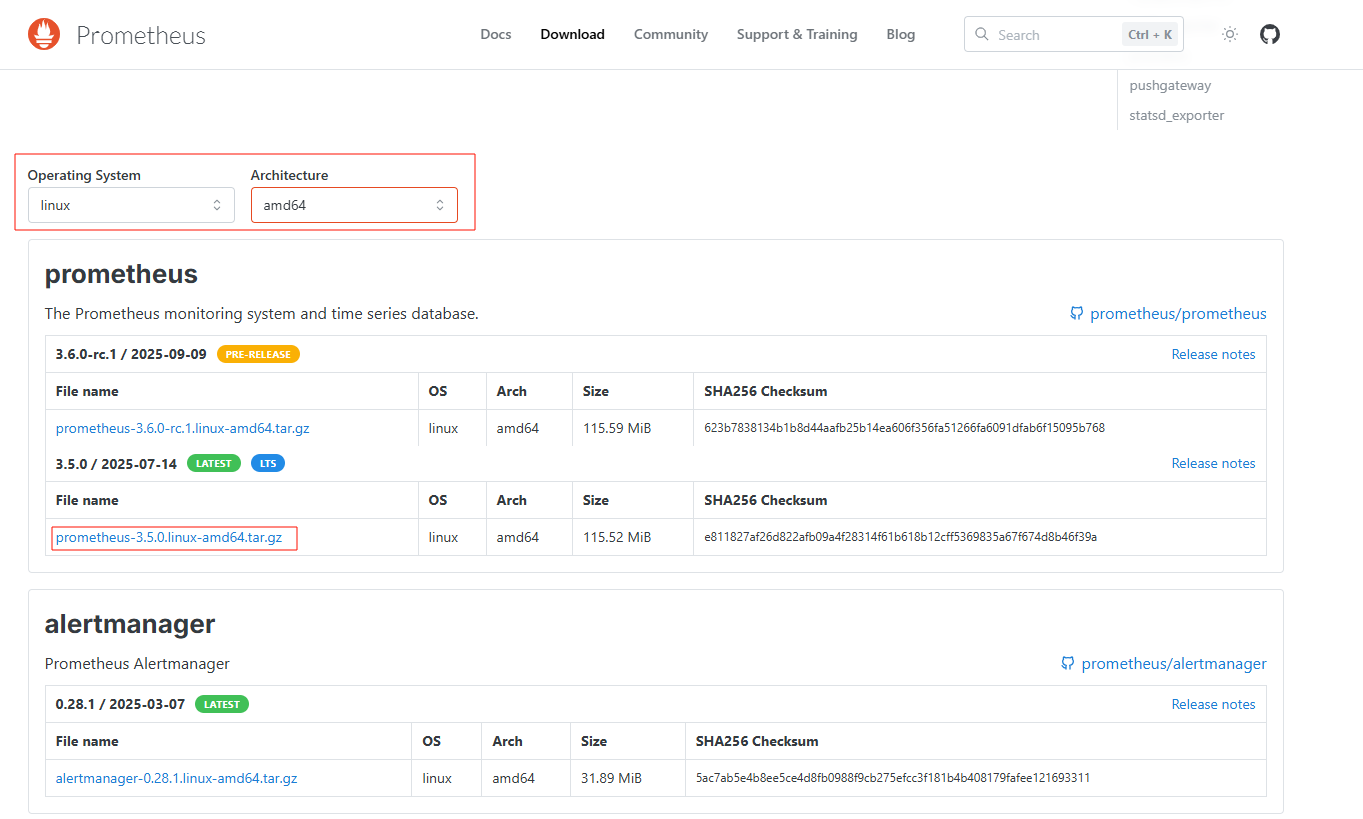
6)解压二进制Prometheus包
[root@localhost ~]# tar -zxvf prometheus-3.5.0.linux-amd64.tar.gz
prometheus-3.5.0.linux-amd64/
prometheus-3.5.0.linux-amd64/prometheus.yml
prometheus-3.5.0.linux-amd64/prometheus
prometheus-3.5.0.linux-amd64/NOTICE
prometheus-3.5.0.linux-amd64/LICENSE
prometheus-3.5.0.linux-amd64/promtool
7)移动并重命名Prometheus解压出来的目录
[root@localhost ~]# mv prometheus-3.5.0.linux-amd64 /opt/
[root@localhost ~]# mv /opt/prometheus-3.5.0.linux-amd64/ /opt/prometheus
8)创建prometheus用户
[root@localhost ~]# groupadd prometheus
[root@localhost ~]# useradd -g prometheus -M -s /usr/sbin/nologin prometheus
[root@localhost ~]# passwd prometheus
更改用户 prometheus 的密码 。
新的密码:
重新输入新的密码:
passwd:所有的身份验证令牌已经成功更新。
[root@localhost ~]# id prometheus
用户id=2002(prometheus) 组id=2003(prometheus) 组=2003(prometheus)
9)创建目录并赋权
[root@localhost ~]# mkdir -p /opt/prometheus/data
[root@localhost ~]# chown -R prometheus:prometheus /opt/prometheus
3.2 配置Prometheus服务
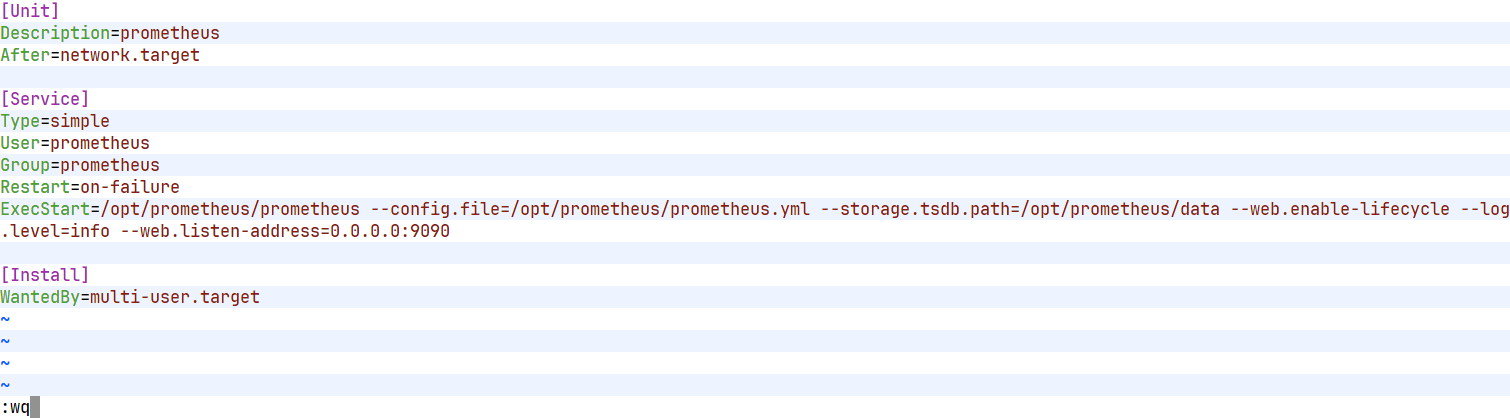
1)创建Prometheus系统服务文件
[root@localhost ~]# vim /etc/systemd/system/prometheus.service
添加以下内容:
[Unit]
Description=prometheus
After=network.target[Service]
Type=simple
User=prometheus
Group=prometheus
Restart=on-failure
ExecStart=/opt/prometheus/prometheus --config.file=/opt/prometheus/prometheus.yml --storage.tsdb.path=/opt/prometheus/data --web.enable-lifecycle --log.level=info --web.listen-address=0.0.0.0:9090[Install]
WantedBy=multi-user.target
参数说明:
# --config-file:指定Prometheus的配置文件路径为 /opt/prometheus/prometheus.yml,配置文件包含了Prometheus的各种配置选项,如监控目标、规则等。
# --storage.tsdb.path:设置Prometheus存储时序数据的路径为 /opt/prometheus/data;时序数据库(TSDB)用于存储Prometheus收集的时间序列数据。
# --web.enable-lifecycle: 启用Prometheus的生命周期接口,允许通过HTTP请求来动态重新加载配置等操作。
# --log.level: 表示设置日志的级别为info
# --web.listen-address: 指定prometheus服务端口。默认通过9090端口访问prometheus管理界面,可以修改成其他端口用于访问prometheus管理界面(如果没有修改端口的需求可以不设置这个参数)。
3.3 配置Prometheus主配置文件
1)编辑Prometheus主配置文件
[root@localhost ~]# vim /opt/prometheus/prometheus.yml
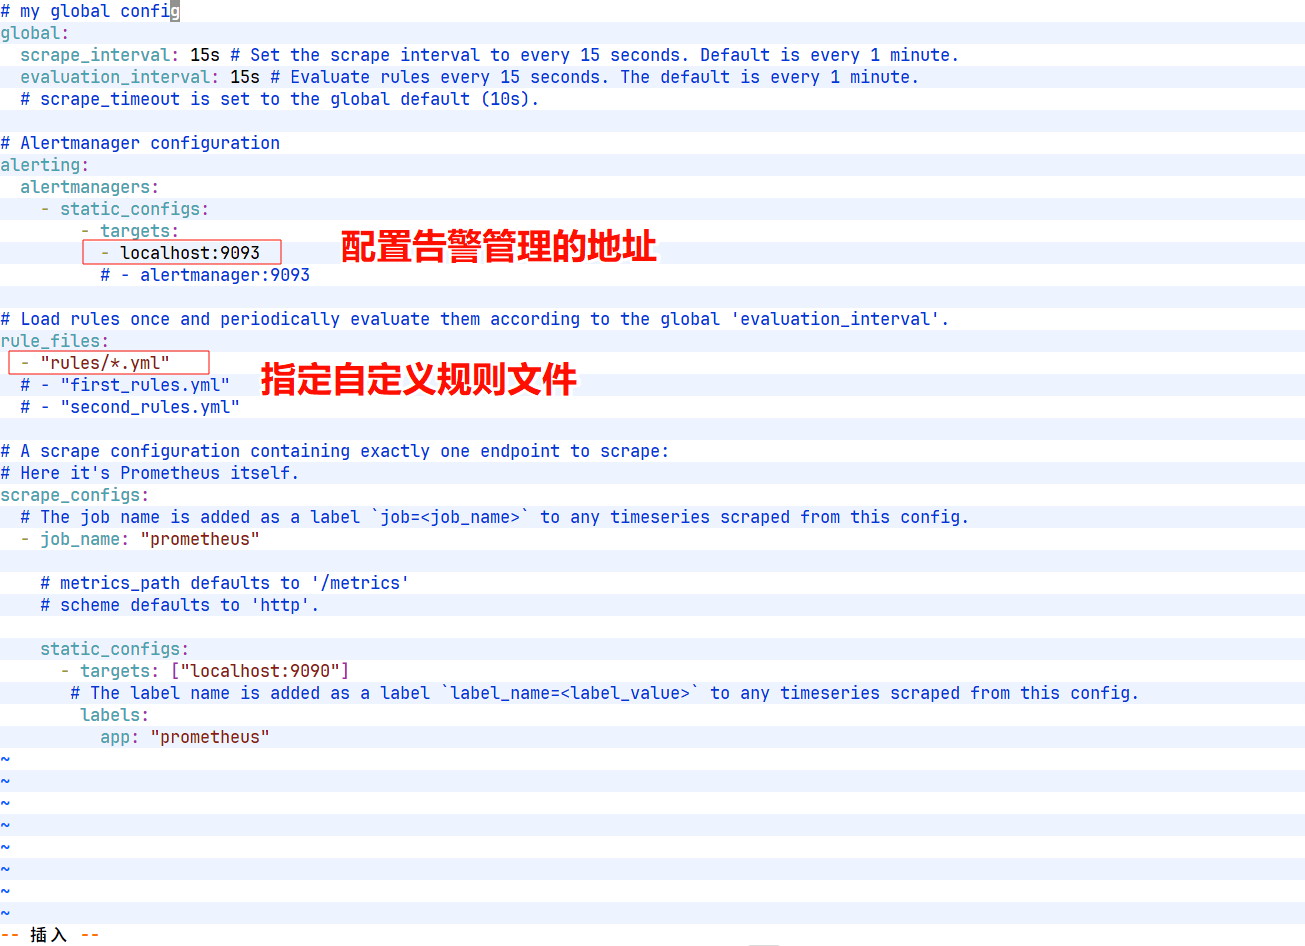
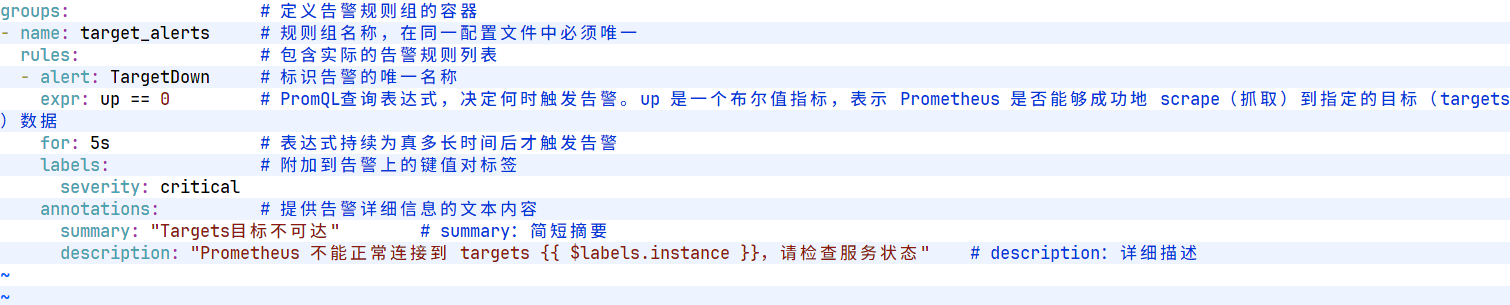
2)自定义规则文件
[root@localhost ~]# cd /opt/prometheus/
[root@localhost prometheus]# mkdir rules
[root@localhost prometheus]# vim ./rules/target_alerts.yml
[root@localhost prometheus]# chown prometheus:prometheus /opt/prometheus/rules/target_alerts.yml
3)检查配置文件
[root@localhost prometheus]# ls
data  LICENSE  NOTICE  prometheus  prometheus.yml  promtool  rules
[root@localhost prometheus]# ./promtool check config prometheus.yml
Checking prometheus.ymlSUCCESS: 1 rule files foundSUCCESS: prometheus.yml is valid prometheus config file syntaxChecking rules/target_alerts.ymlSUCCESS: 1 rules found
4)重启Prometheus
[root@localhost prometheus]# systemctl restart prometheus.service
3.4 启动并测试Prometheus
1)启动Prometheus服务并设置为开机自启
# 重新加载systemd配置
[root@localhost ~]# systemctl daemon-reload
# 启动Prometheus服务
[root@localhost ~]# systemctl start prometheus.service
# 设置开机自启
[root@localhost ~]# systemctl enable prometheus.service
Created symlink /etc/systemd/system/multi-user.target.wants/prometheus.service → /etc/systemd/system/prometheus.service.
2)验证Prometheus是否正常运行
# 检查端口监听情况
[root@localhost prometheus]# netstat -tulnp | grep 9090
tcp6       0      0 :::9090                 :::*                    LISTEN      514955/prometheus
# 使用curl测试
[root@localhost prometheus]# curl http://localhost:9090/metrics
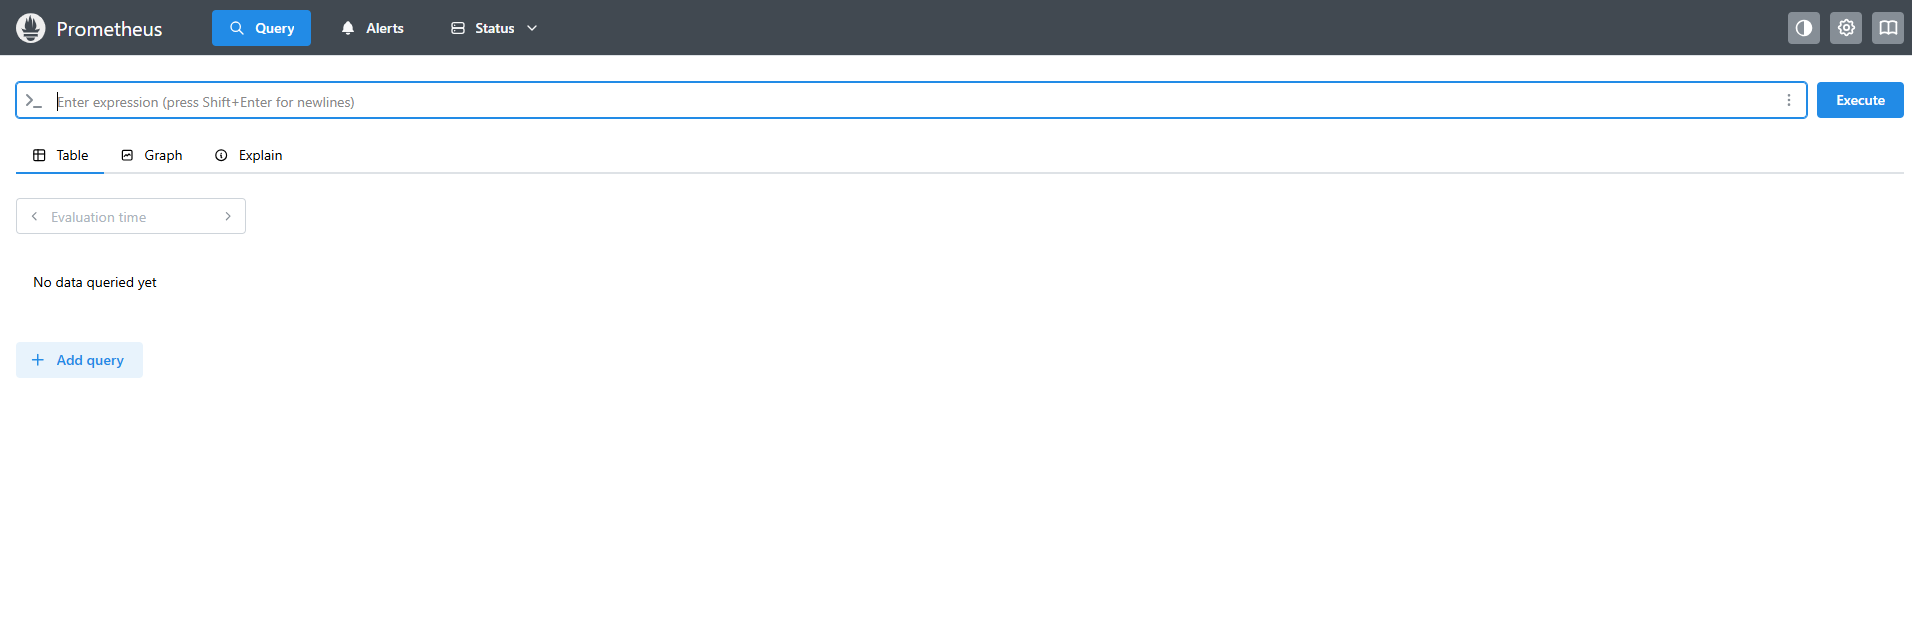
3)打开浏览器访问 http://<服务器IP>:9090 应该能看到Prometheus的Web界面
四 Grafana部署与配置
4.1 安装Grafana
在监控服务器上安装Grafana:
1)下载Grafana安装包
访问Grafana官网:https://grafana.com/grafana/download?pg=get&plcmt=selfmanaged-box1-cta1
[root@localhost ~]# wget https://dl.grafana.com/grafana-enterprise/release/12.1.1/grafana-enterprise_12.1.1_16903967602_linux_amd64.tar.gz
--2025-09-18 16:04:50--  https://dl.grafana.com/grafana-enterprise/release/12.1.1/grafana-enterprise_12.1.1_16903967602_linux_amd64.tar.gz
正在解析主机 dl.grafana.com (dl.grafana.com)... 2a04:4e42:87::729, 151.101.42.217
正在连接 dl.grafana.com (dl.grafana.com)|2a04:4e42:87::729|:443... 已连接。
已发出 HTTP 请求,正在等待回应... 200 OK
长度:210588830 (201M) [application/x-tar]
正在保存至: “grafana-enterprise_12.1.1_16903967602_linux_amd64.tar.gz”grafana-enterprise_12.1.1_16903967602_li 100%[=================================================================================>] 200.83M  2.86MB/s  用时 63s     2025-09-18 16:05:54 (3.18 MB/s) - 已保存 “grafana-enterprise_12.1.1_16903967602_linux_amd64.tar.gz” [210588830/210588830])
2)解压二进制Grafana包
[root@localhost ~]# tar -zxvf grafana-enterprise_12.1.1_16903967602_linux_amd64.tar.gz
3)移动并重命名Grafana解压出来的目录
[root@localhost ~]# mv grafana-12.1.1 /opt/prometheus/grafana
4)给予权限
[root@localhost grafana]# chown prometheus:prometheus /opt/prometheus/grafana
5)注册systemd服务
[root@localhost grafana]# vim /etc/systemd/system/grafana-server.service
写入如下内容:
[Unit]
Description=Grafana server
After=network.target[Service]
Type=simple
User=prometheus
Group=prometheus
Restart=on-failure
ExecStart=/opt/prometheus/grafana/bin/grafana-server --config=/opt/prometheus/grafana/conf/defaults.ini --homepath=/opt/prometheus/grafana[Install]
WantedBy=multi-user.target
[root@localhost grafana]# systemctl daemon-reload
[root@localhost grafana]# systemctl start grafana-server.service
[root@localhost grafana]# systemctl enable grafana-server.service
Created symlink /etc/systemd/system/multi-user.target.wants/grafana-server.service → /etc/systemd/system/grafana-server.service.
[root@localhost grafana]# systemctl status grafana-server.service
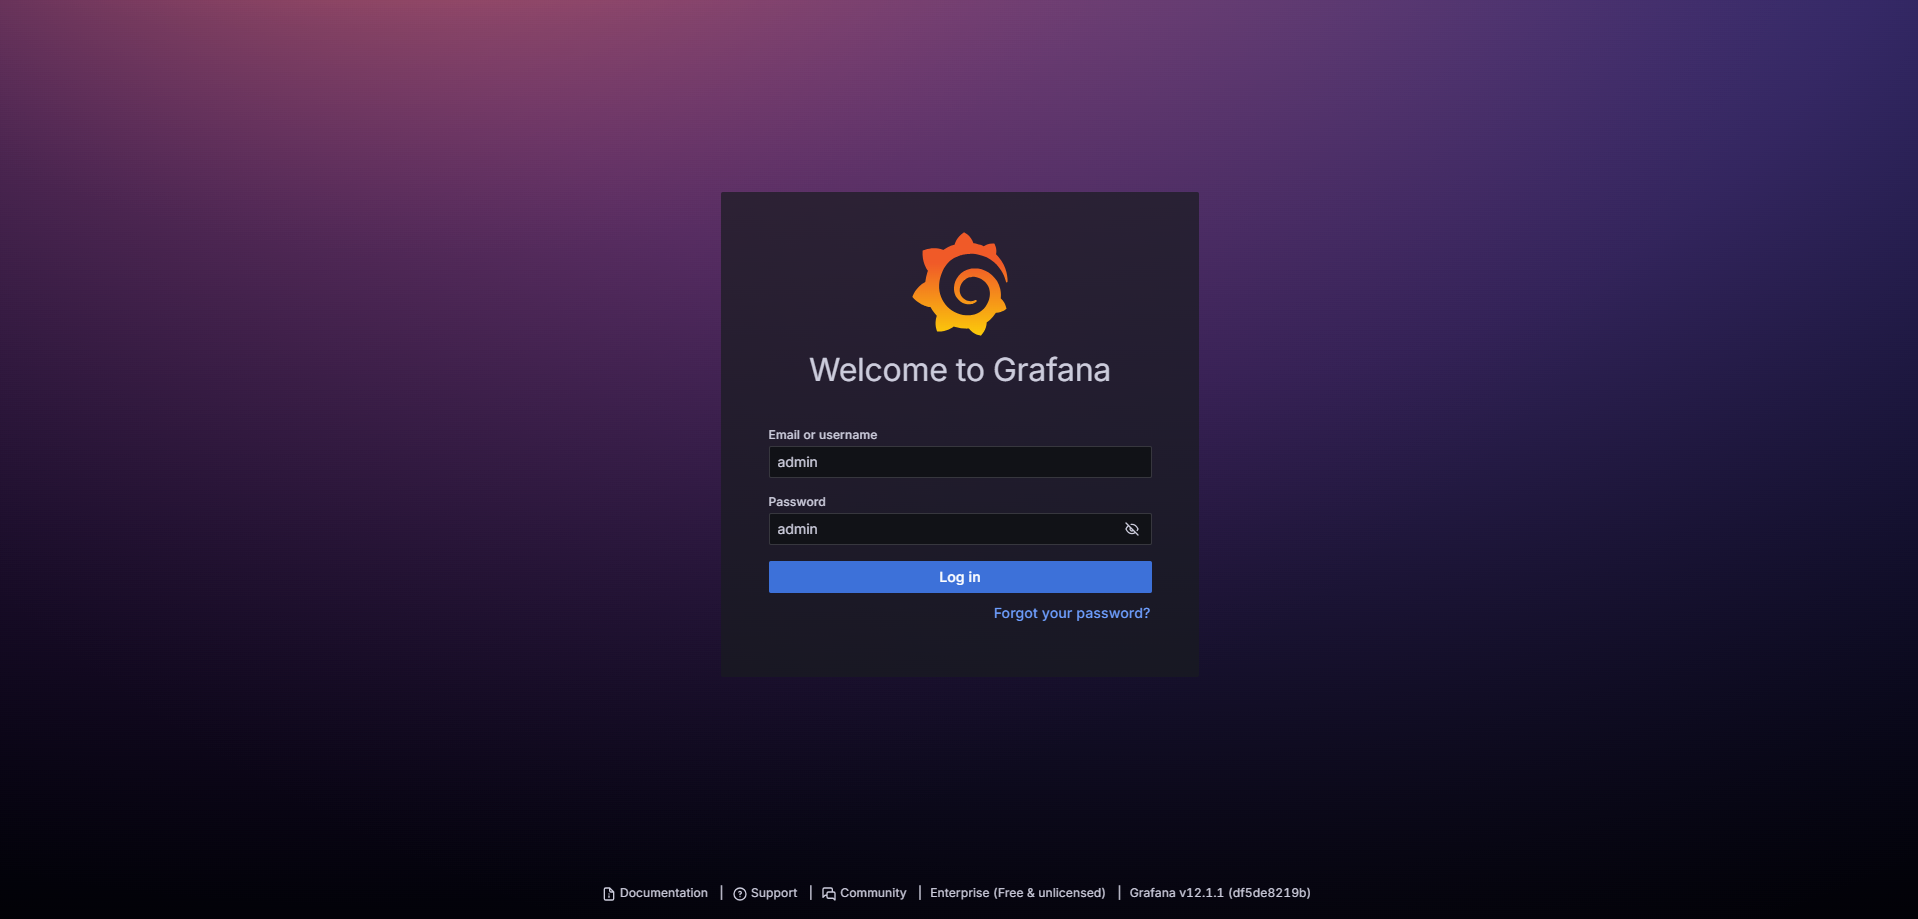
6)登录验证Grafana管理web界面
默认端口:3000
默认用户:admin
默认密码:admin
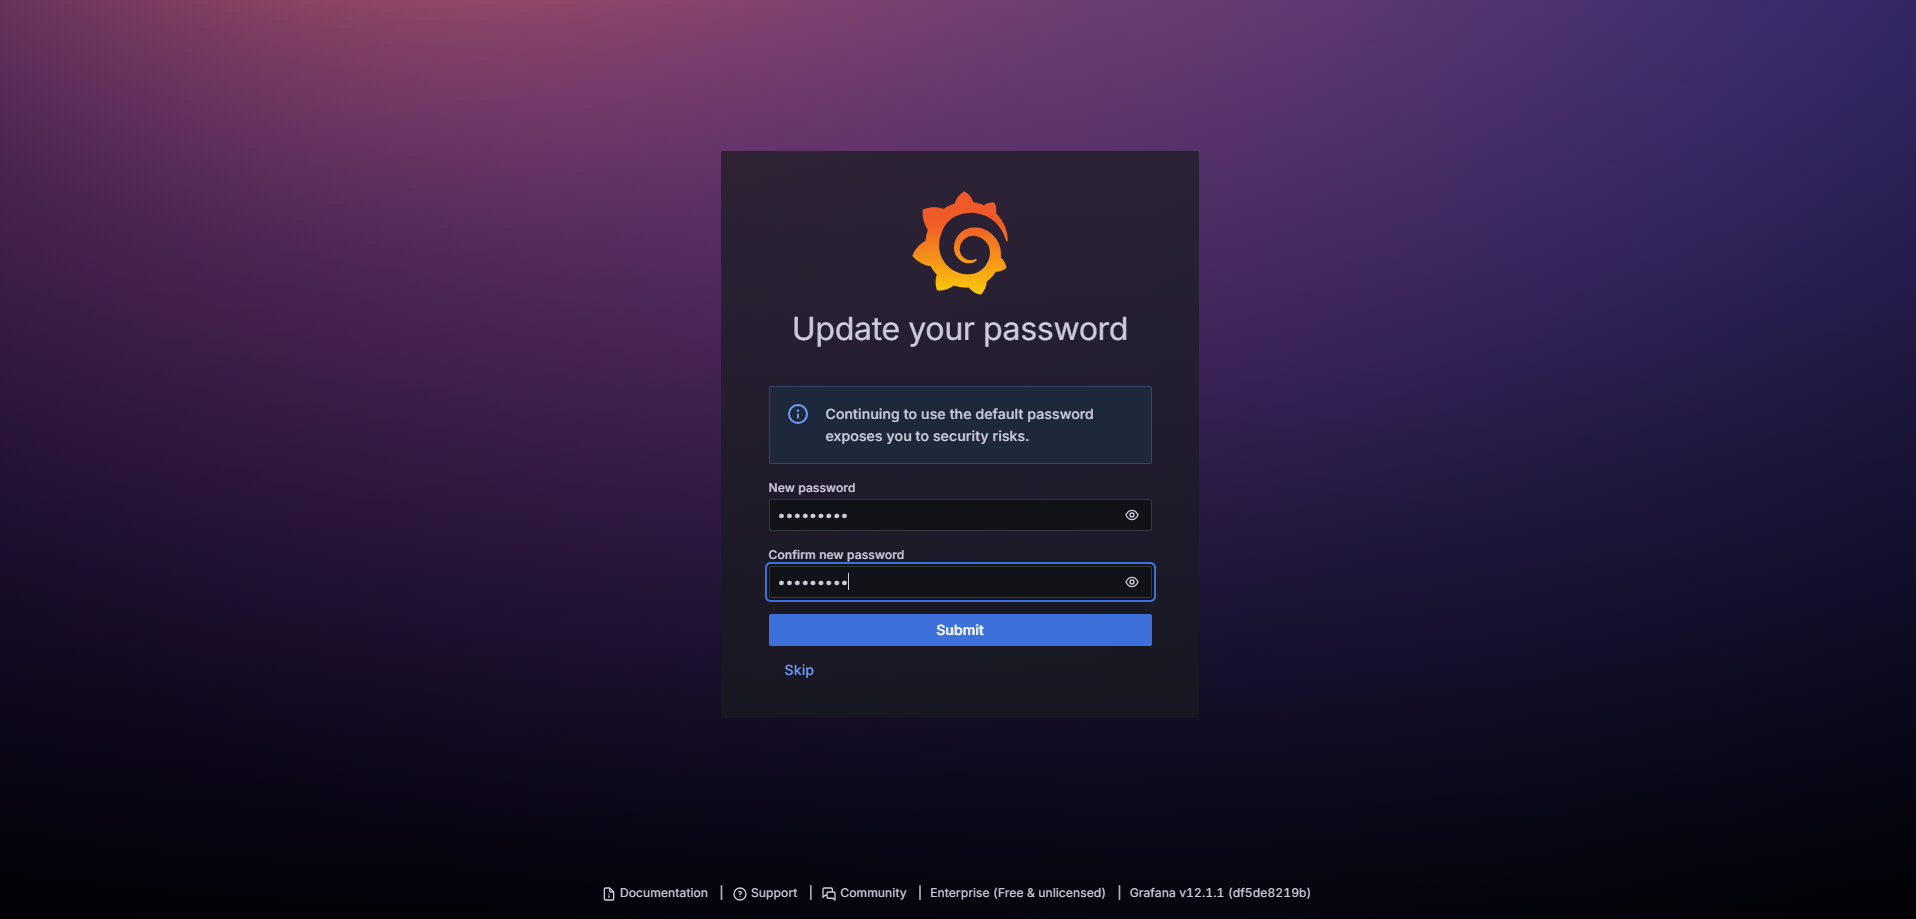
修改默认密码:
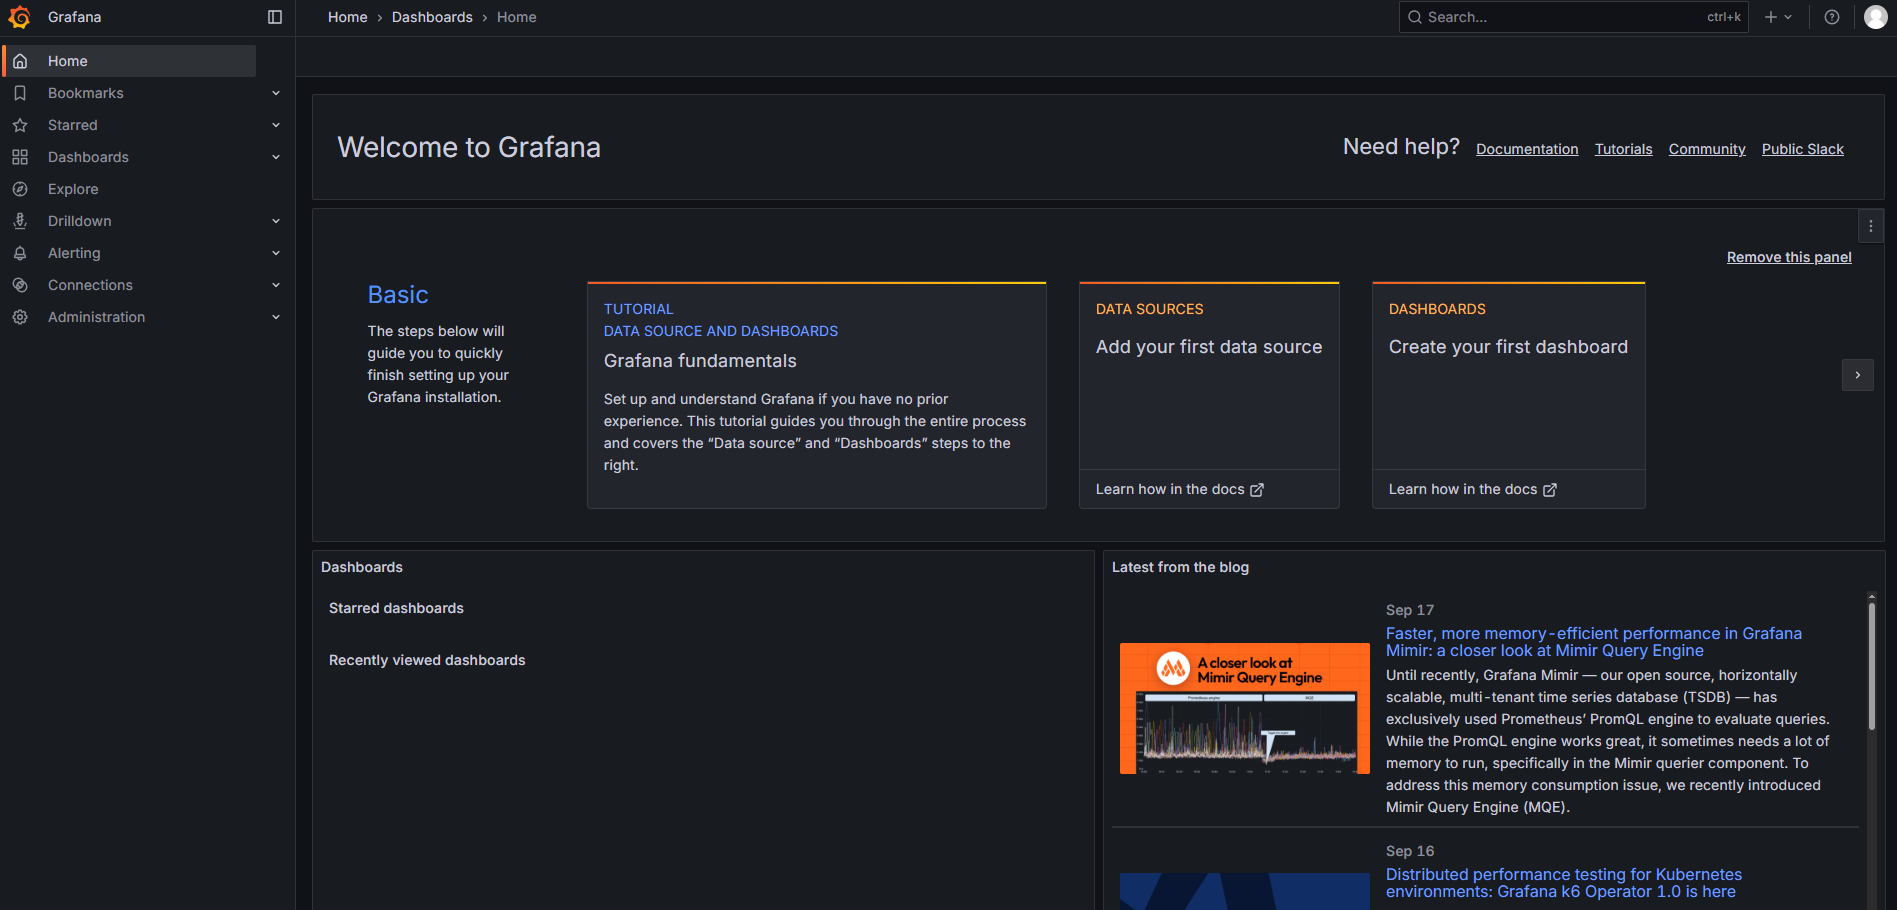
Grafana主界面:
五 Node Exporter部署与配置
5.1 安装Node Exporter
在所有需要监控的银河麒麟系统节点上安装Node Exporter:
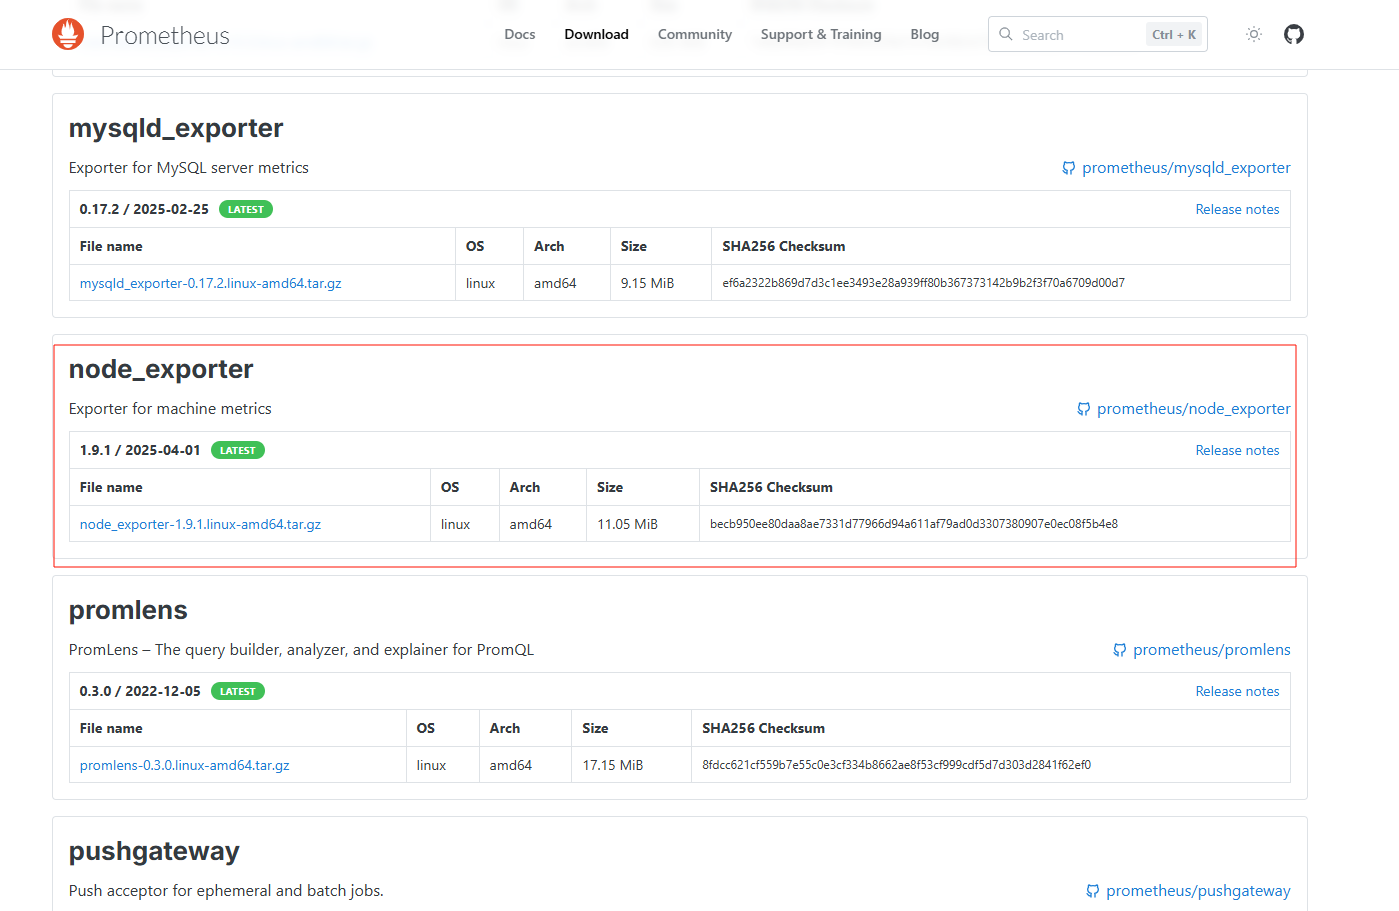
1)下载node-exporter安装包
Prometheus官网下载地址:https://prometheus.io/download/
2)解压二进制node-exporter包
[root@localhost ~]# tar -zxvf node_exporter-1.9.1.linux-amd64.tar.gz
node_exporter-1.9.1.linux-amd64/
node_exporter-1.9.1.linux-amd64/LICENSE
node_exporter-1.9.1.linux-amd64/NOTICE
node_exporter-1.9.1.linux-amd64/node_exporter
3)移动并重命名node-exporter解压出来的目录
[root@localhost ~]# mv node_exporter-1.9.1.linux-amd64 /opt/prometheus/node_exporter
4)给予权限
[root@localhost node_exporter]# chown -R prometheus:prometheus /opt/prometheus/node_exporter
5)注册systemd启动服务项
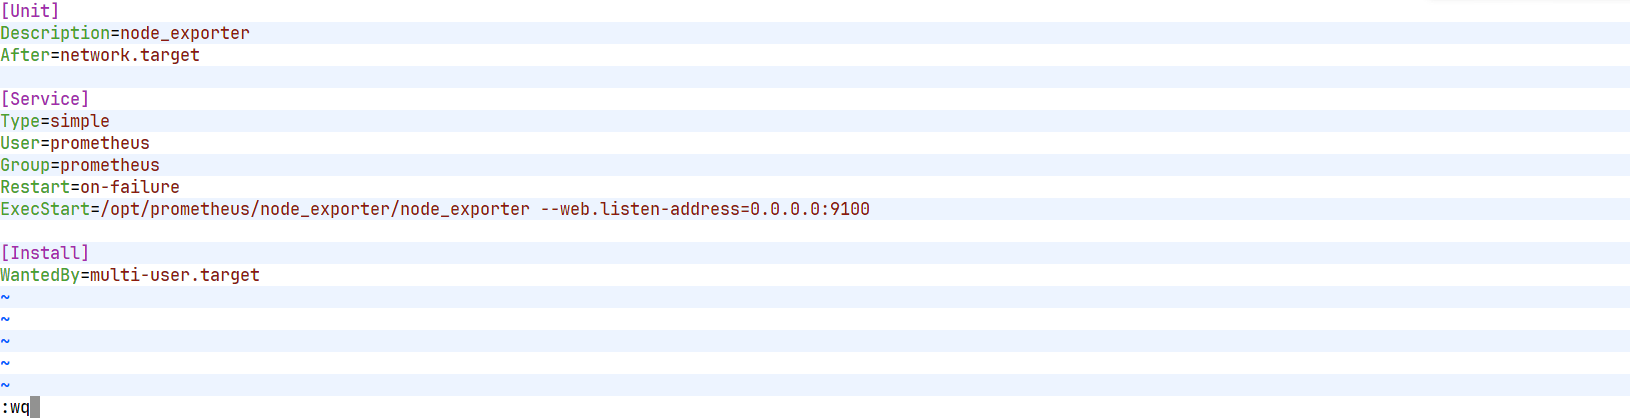
[root@localhost node_exporter]# vim /etc/systemd/system/node_exporter.service
写入如下内容:
[Unit]
Description=node_exporter
After=network.target[Service]
Type=simple
User=prometheus
Group=prometheus
Restart=on-failure
ExecStart=/opt/prometheus/node_exporter/node_exporter --web.listen-address=0.0.0.0:9100[Install]
WantedBy=multi-user.target
[root@prometheus ~]# systemctl daemon-reload
[root@prometheus ~]# systemctl start node_exporter.service
[root@prometheus ~]# systemctl enable node_exporter.service
Created symlink /etc/systemd/system/multi-user.target.wants/node_exporter.service → /etc/systemd/system/node_exporter.service.
[root@prometheus ~]# systemctl status node_exporter.service
六 将当前主机加入到prometheus监控,并通过Grafana展示
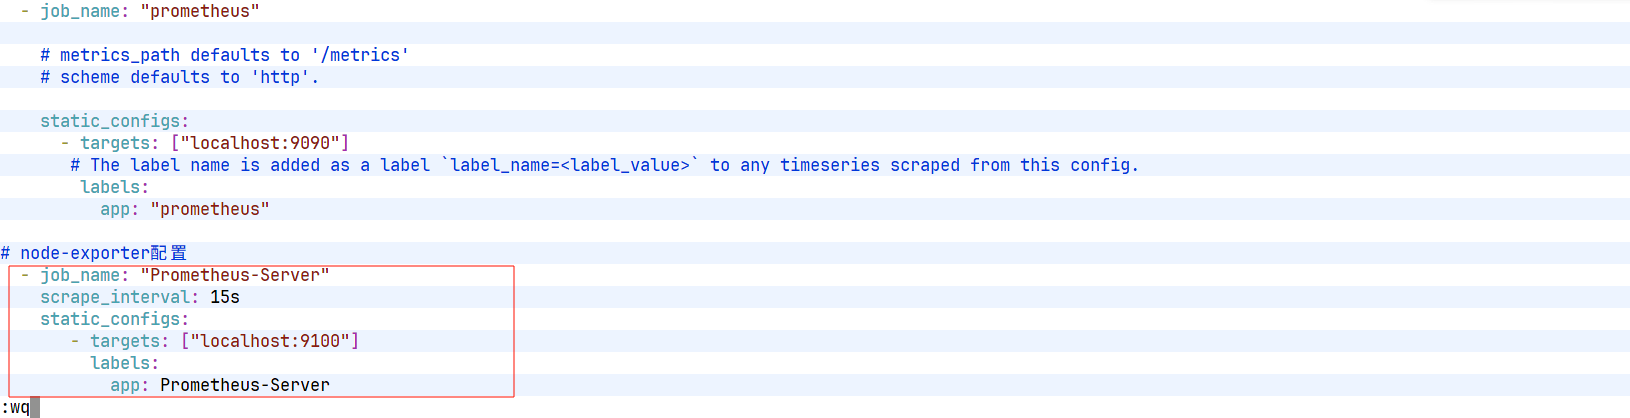
1)将node-exporter的信息加入到prometheus监控的配置文件prometheus.yml
[root@prometheus prometheus]# vim /opt/prometheus/prometheus.yml
2)检查Prometheus配置文件
[root@prometheus prometheus]# ./promtool check config prometheus.yml
Checking prometheus.ymlSUCCESS: 1 rule files foundSUCCESS: prometheus.yml is valid prometheus config file syntaxChecking rules/target_alerts.ymlSUCCESS: 1 rules found
3)重启Prometheus服务使配置生效
[root@prometheus prometheus]# systemctl restart prometheus.service
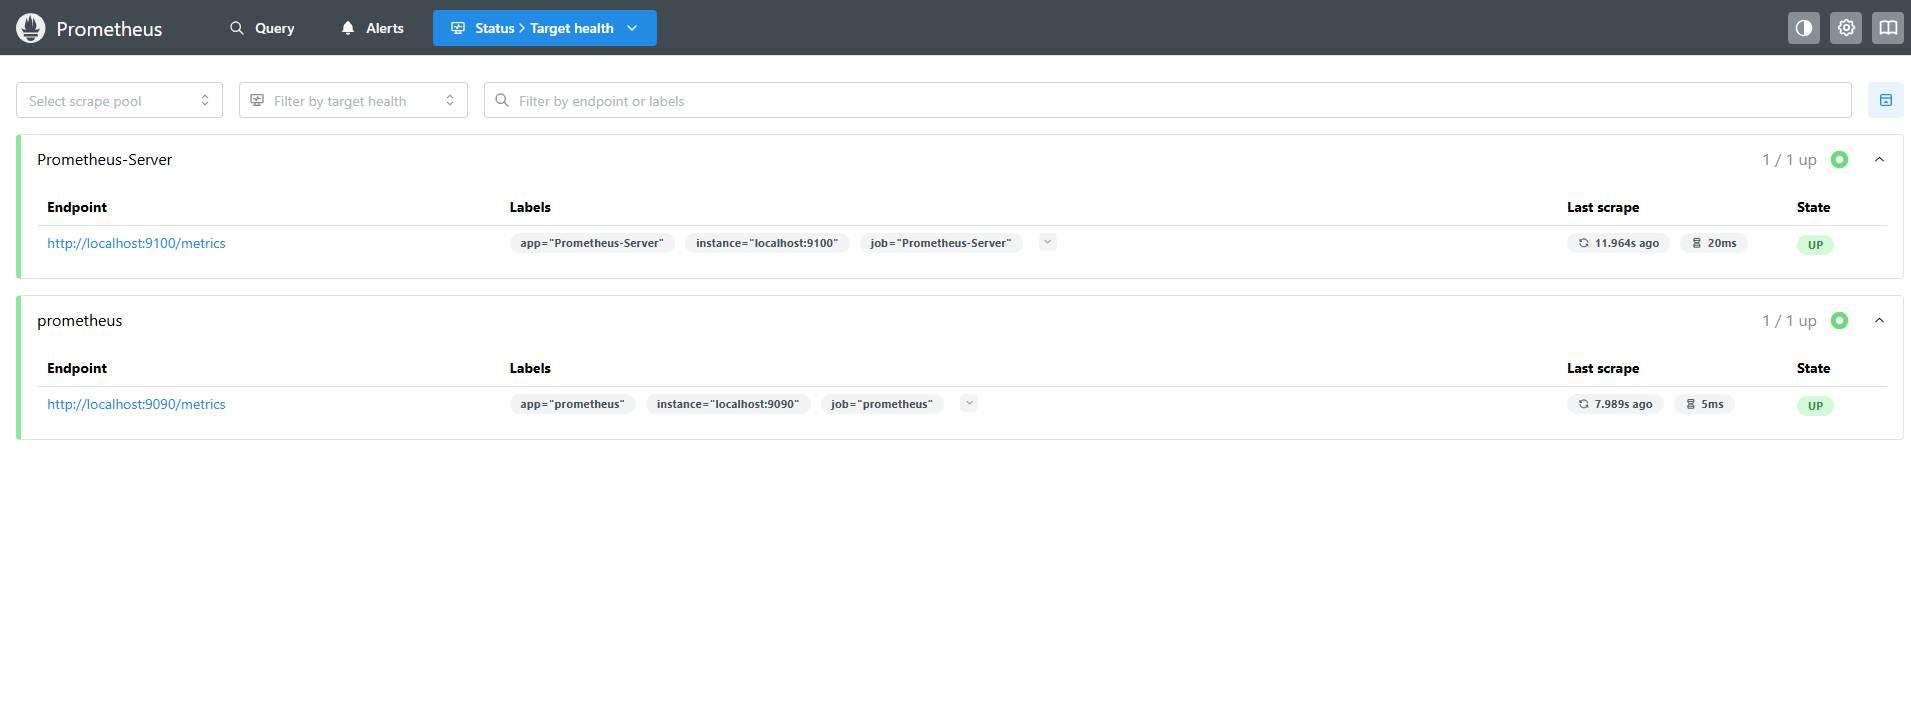
4)查看prometheus是否可以看到监控信息
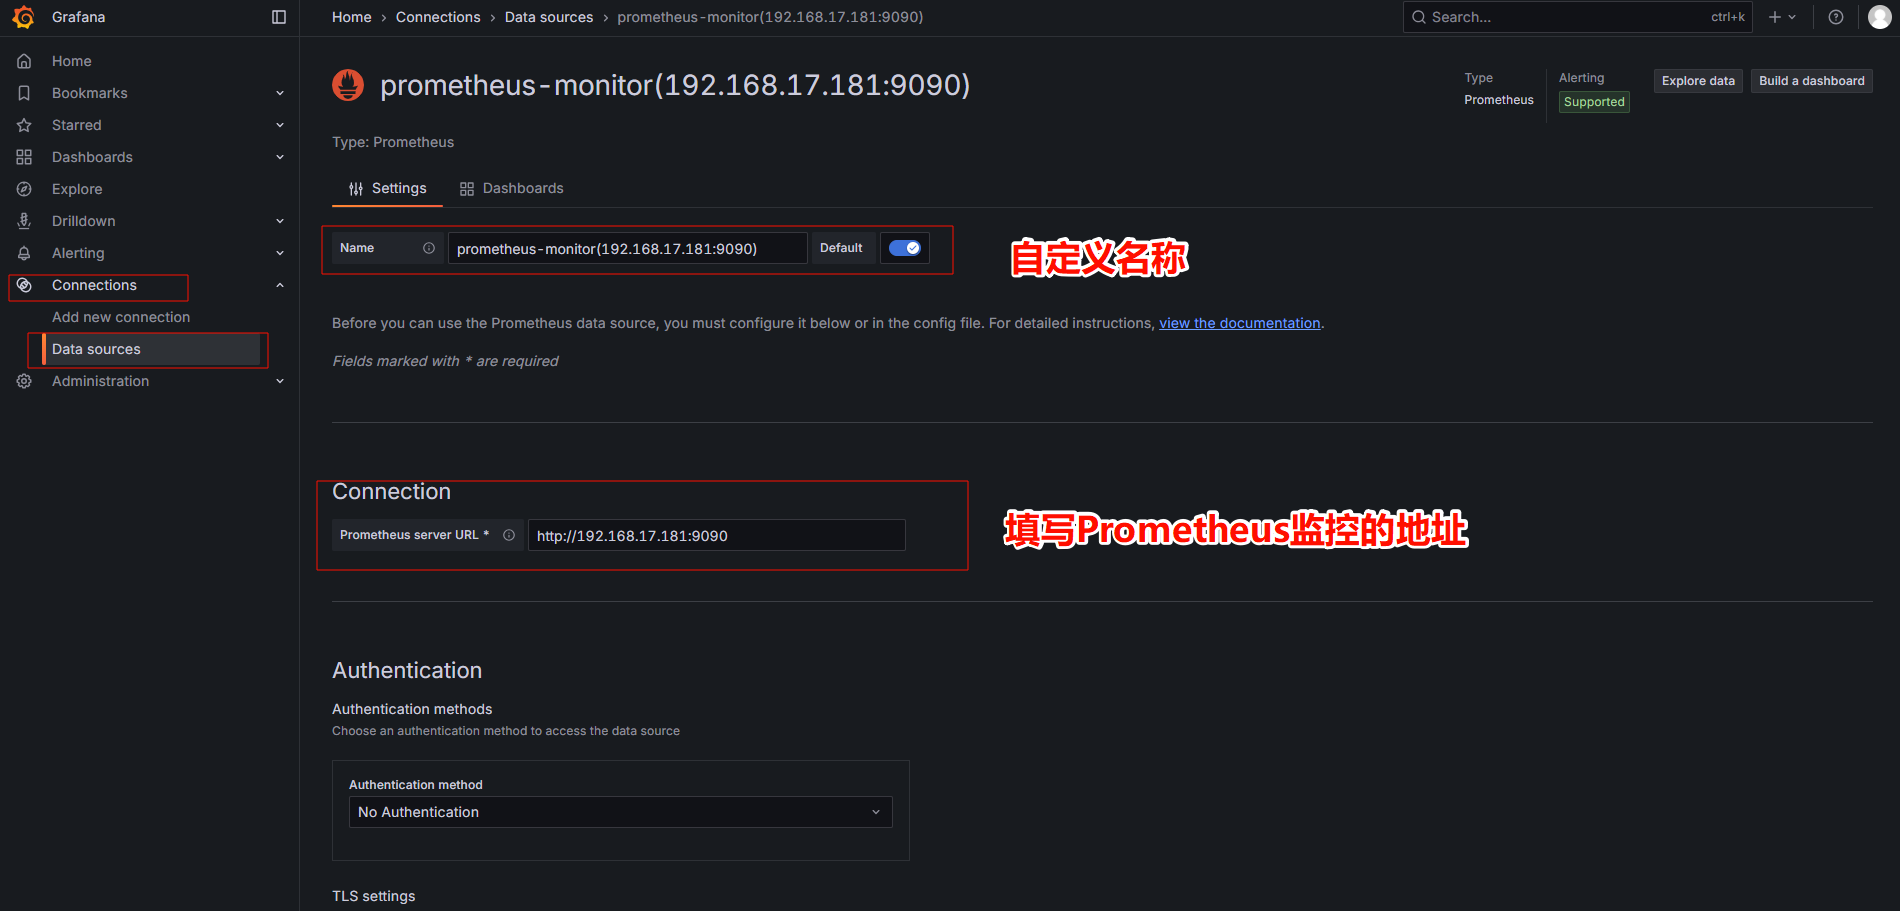
5)登录Grafana管理web界面,将当前主机的监控信息做展示
添加数据源
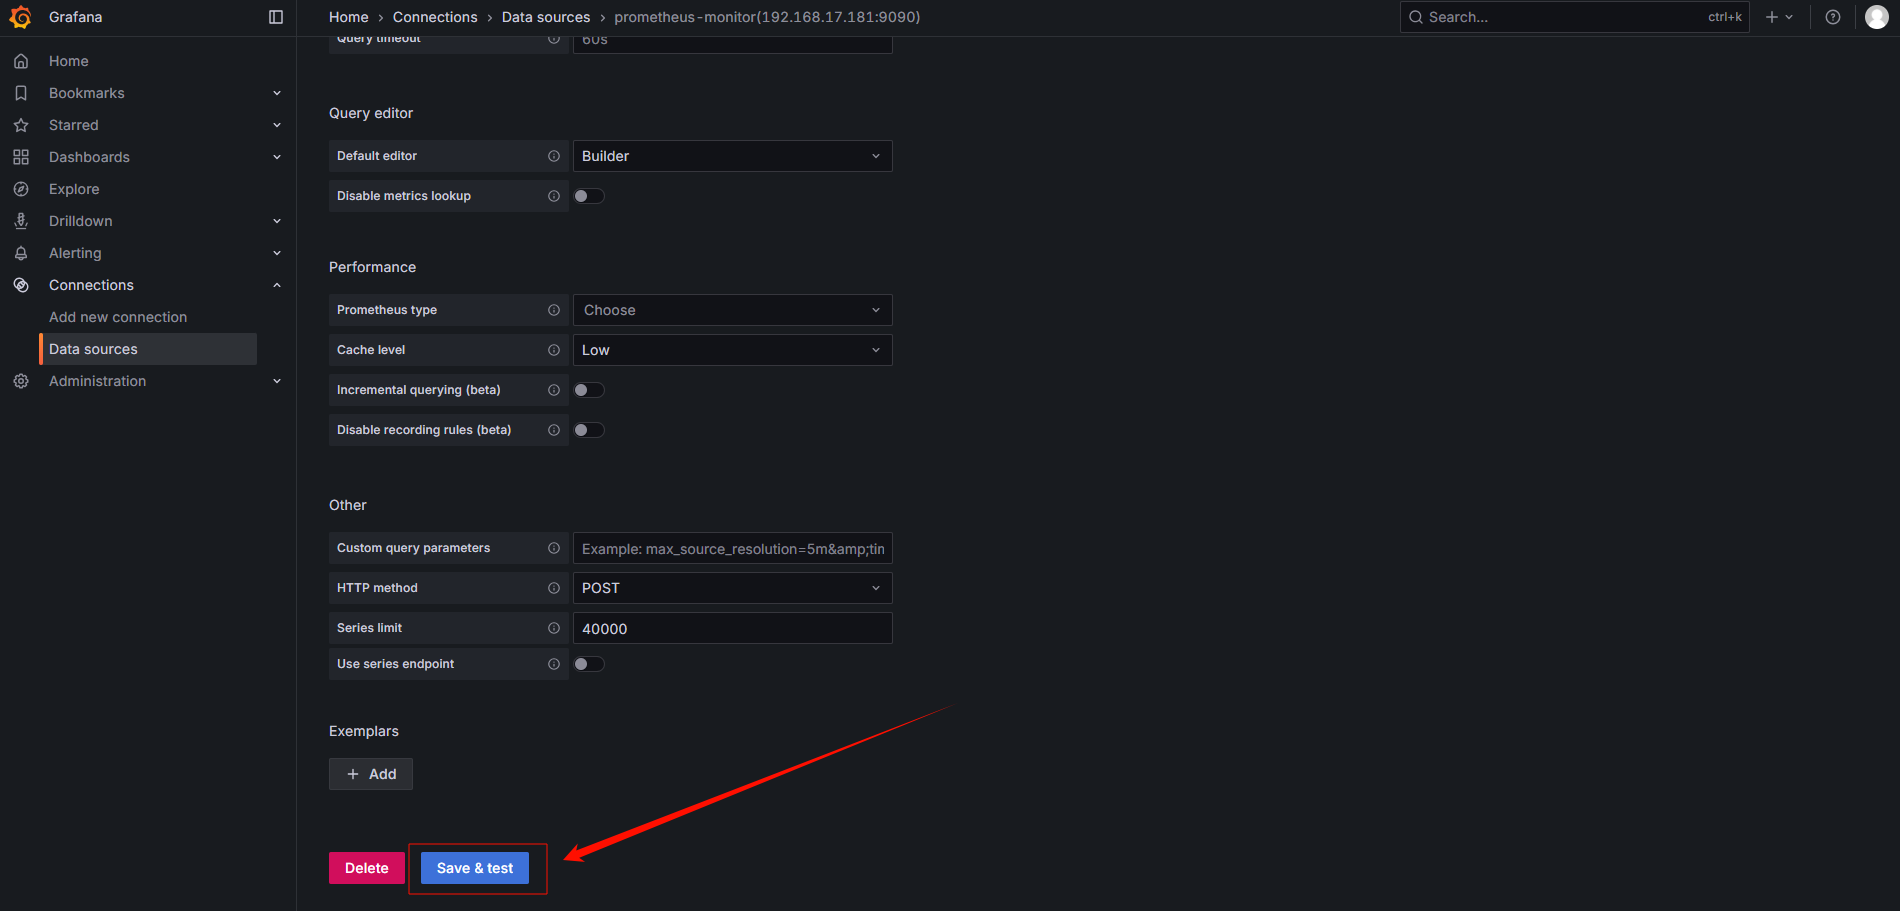
然后保存:
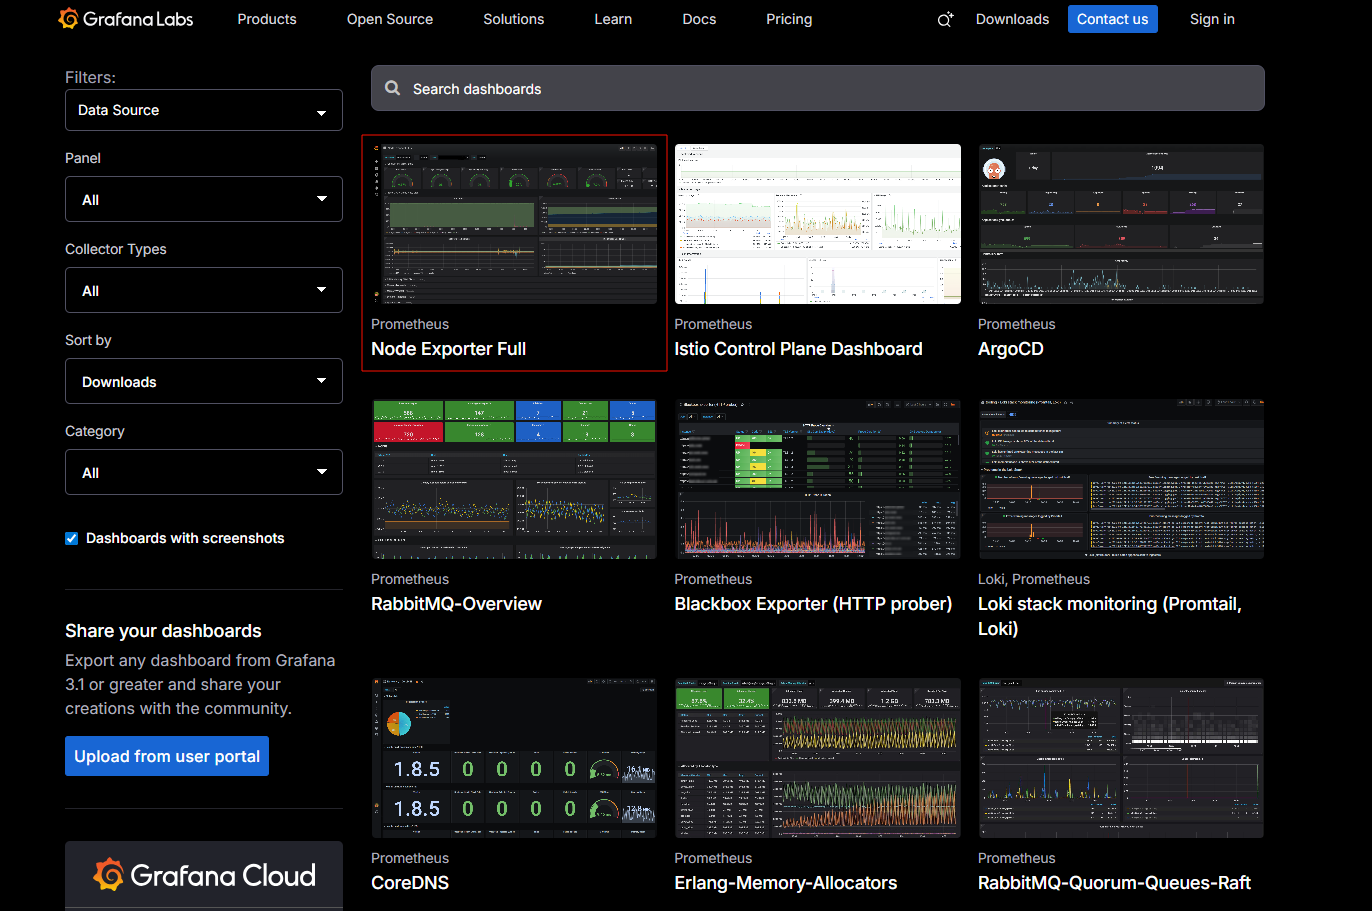
6)下载Grafana仪表盘
Grafana官网下载地址:https://grafana.com/grafana/dashboards/
下载一个自己喜欢的node-exporter,本文以Node Exporter Full 为例:
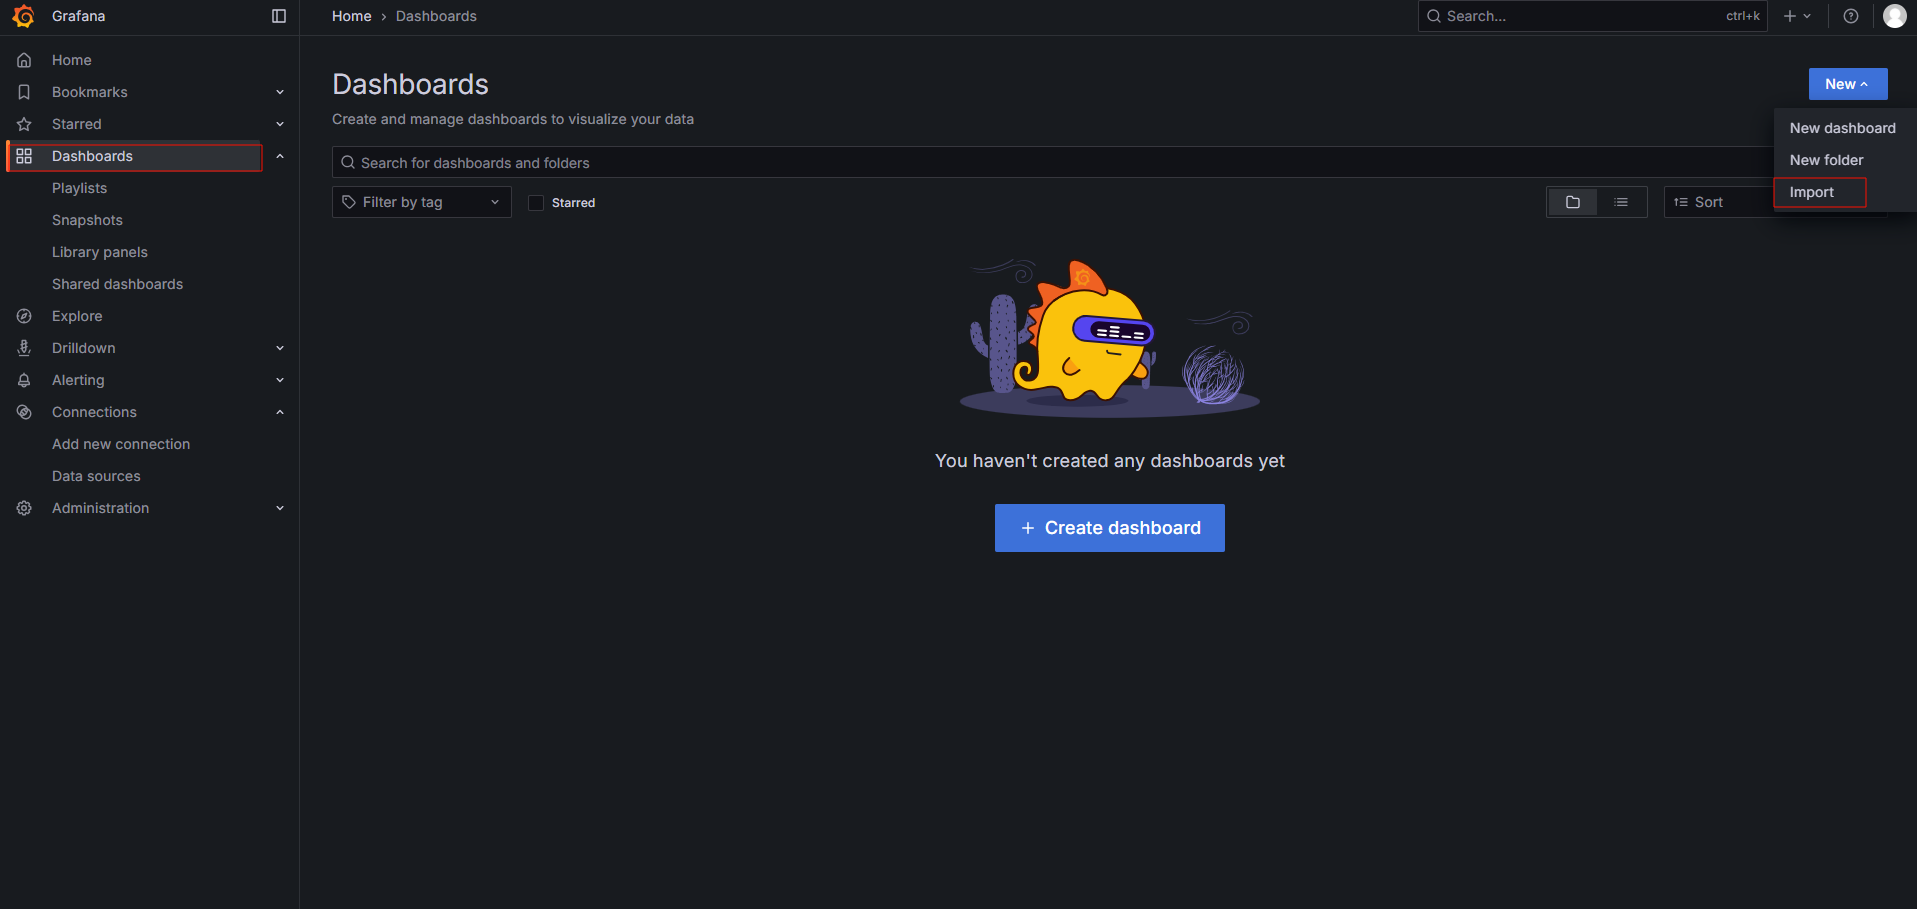
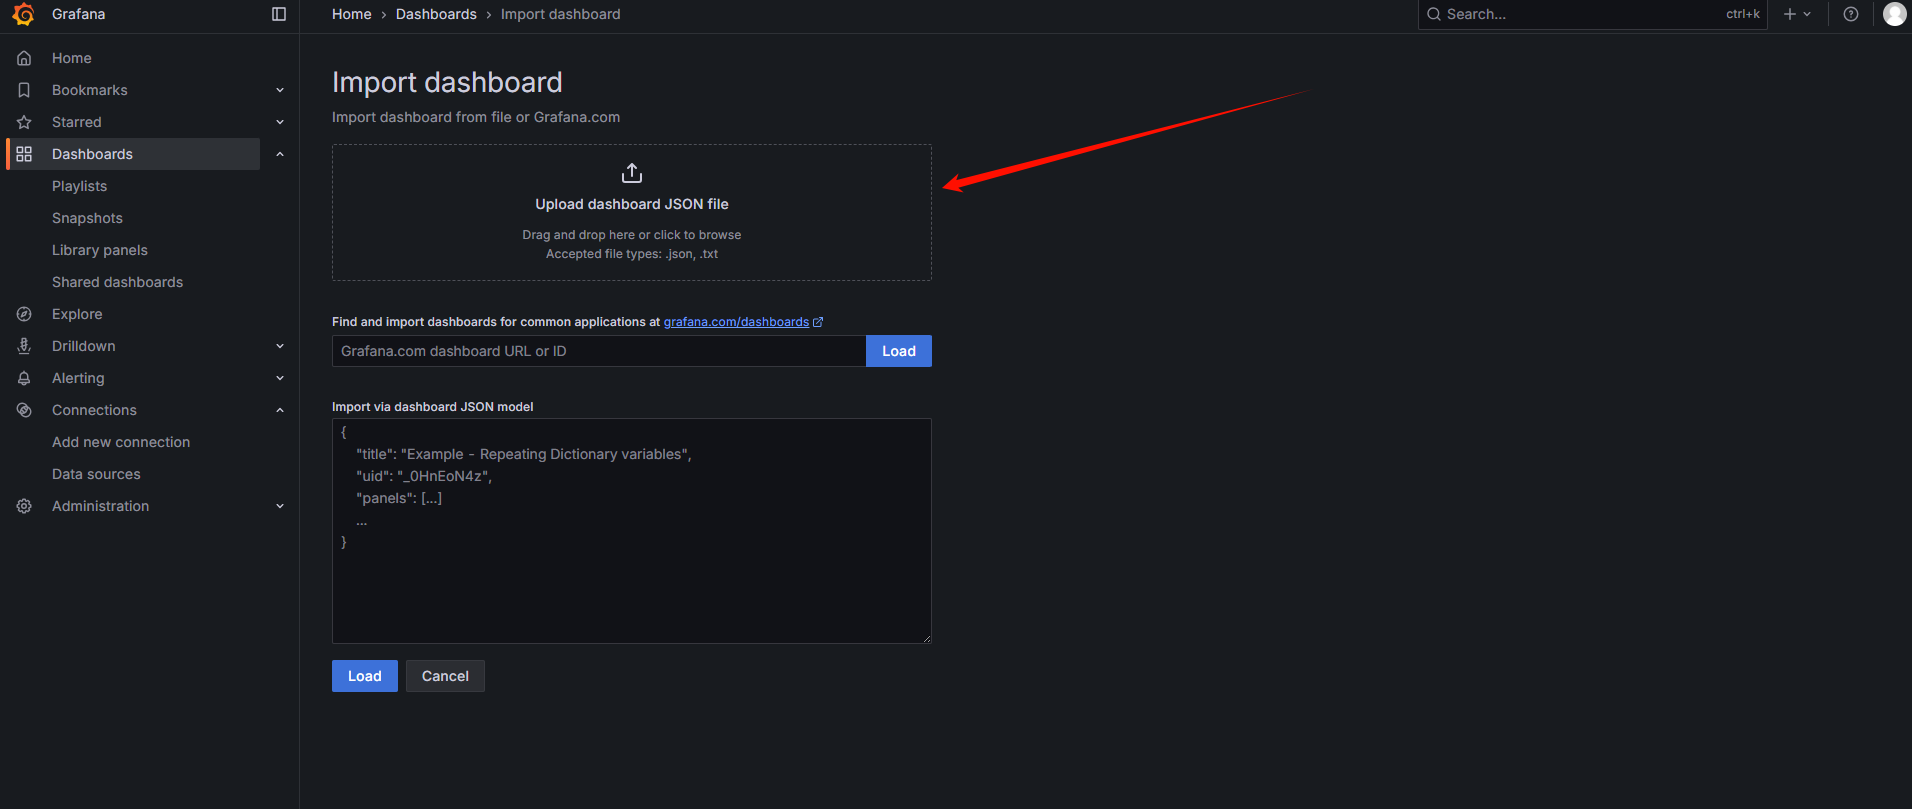
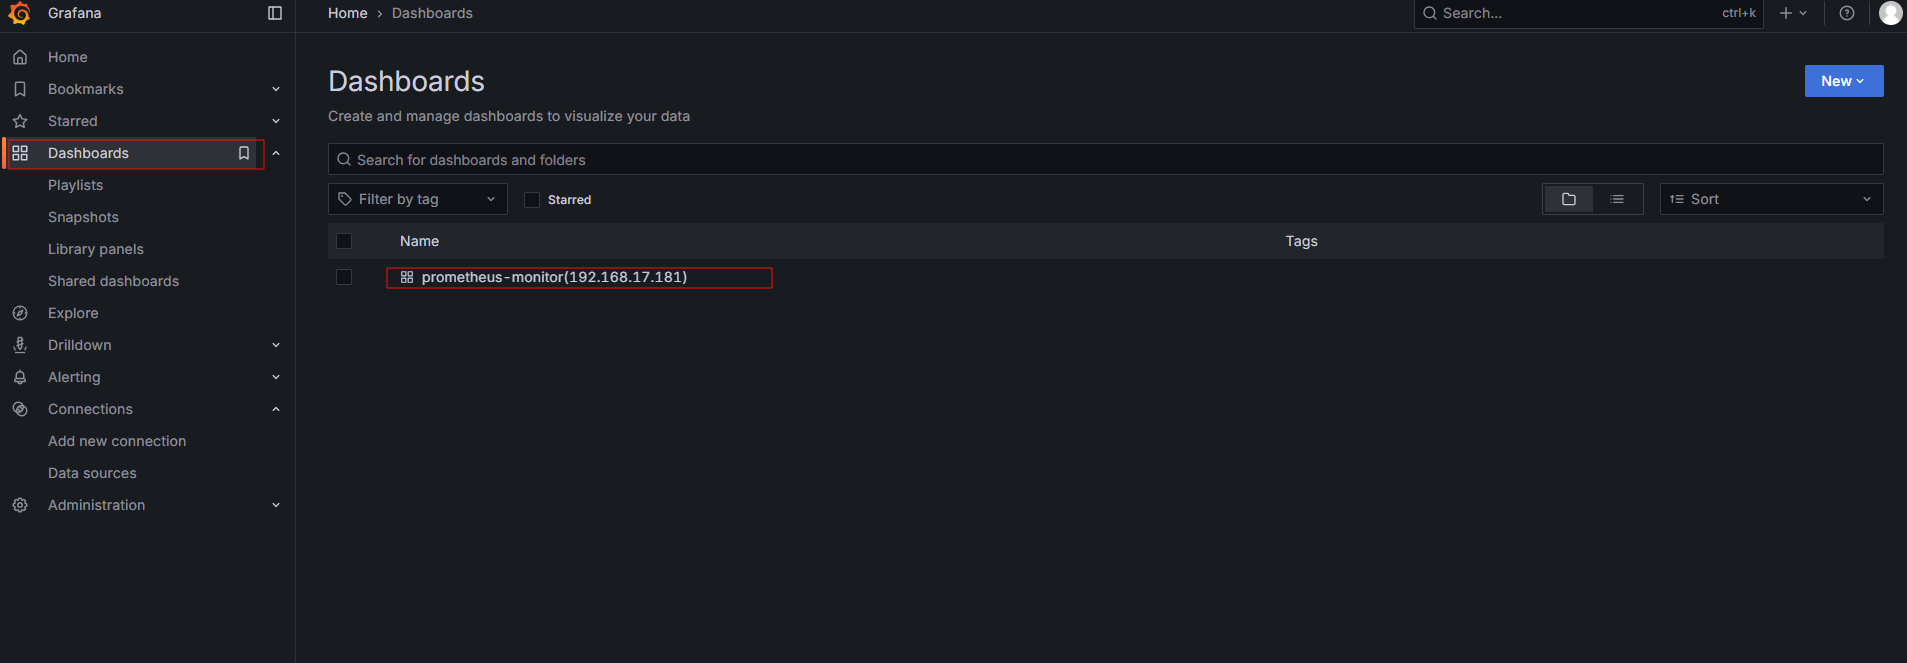
7)将node-exporter仪表盘加入Grafana
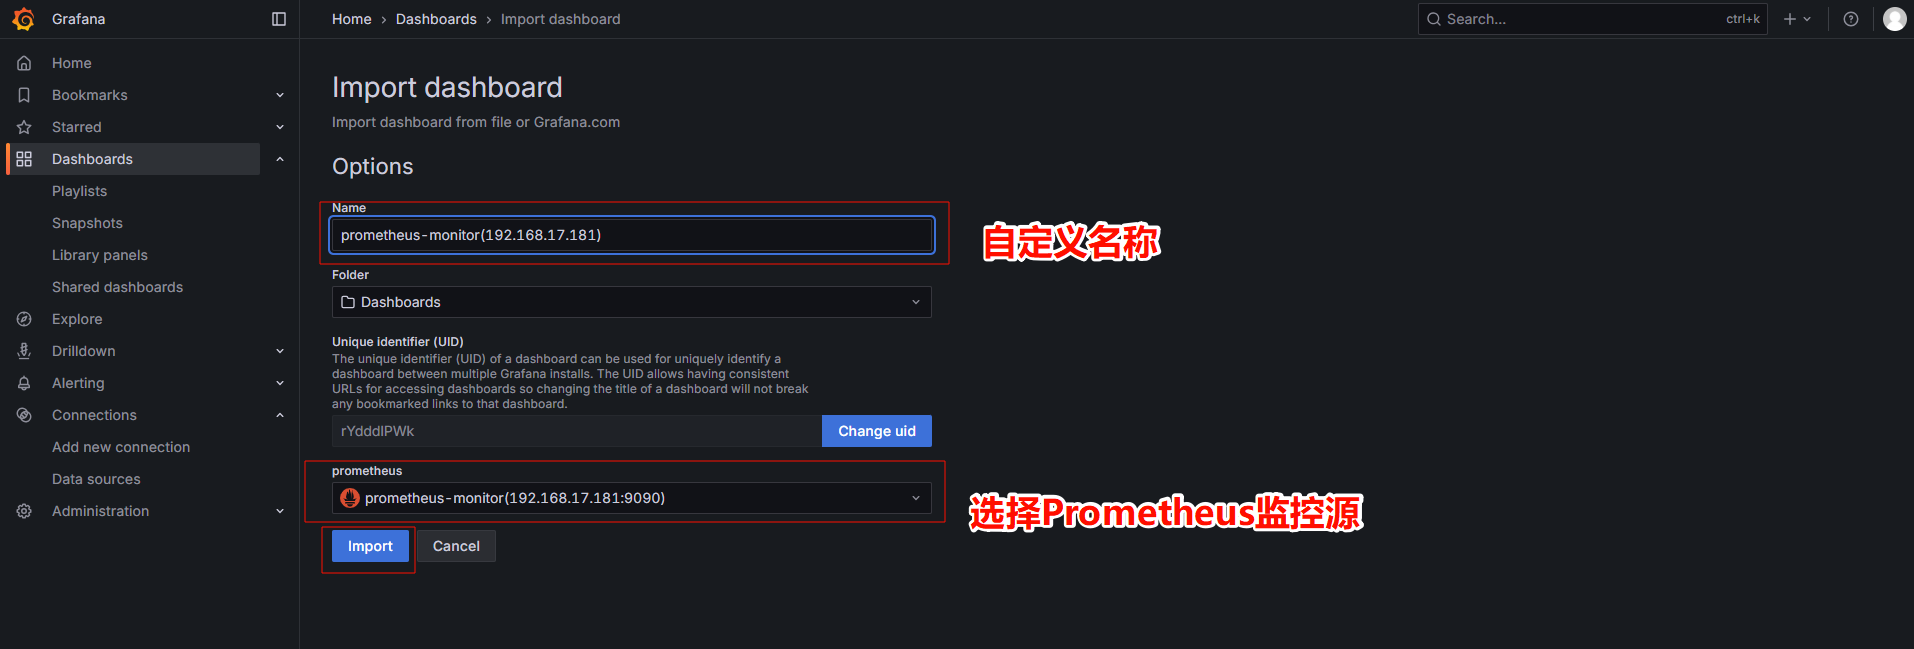
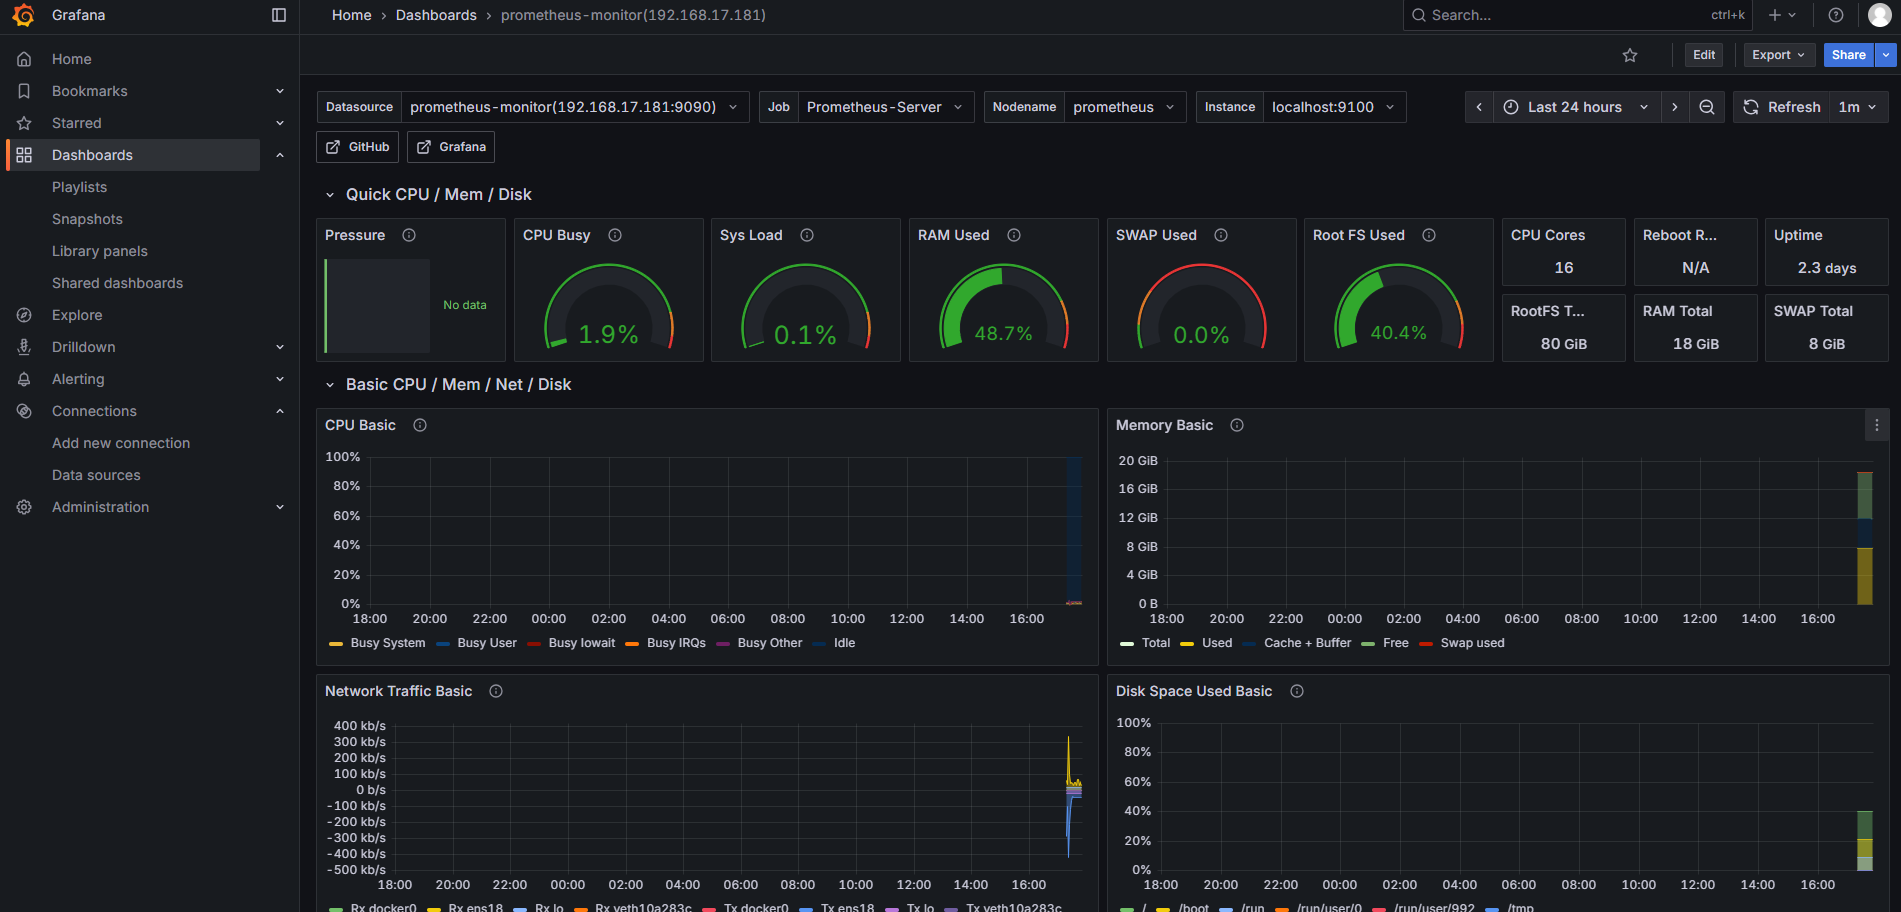
8)仪表盘展示
总结
朋友们,看到这里,你已经成功地将最前沿的开源监控方案 Prometheus + Grafana 落地到了国产的银河麒麟操作系统上。这个过程本身,就证明了开源技术与国产化平台可以完美融合,为我们基础软件的自主可控之路提供了强大的运维保障能力。
这套系统不仅功能强大、视觉效果惊艳,更重要的是,它给了我们运维人员和开发者掌控力和预见性。无论你是负责一台还是上千台银河麒麟服务器,这套组合都能帮你稳住大局。
别再让你的服务器在“黑夜”中裸奔了,赶紧动手,为你的银河麒麟系统装上这双“慧眼”吧!过程中遇到任何问题,欢迎随时交流。
好了,今天的分享就到这里。如果觉得有用,别忘了点赞、收藏、转发三连哦!咱们下期再见!