【Python】雷达簇类ply点云仿真生成,以及聚类算法的簇类目标检测
【Python】雷达簇类ply点云仿真生成,以及聚类算法的簇类目标检测
该仿真常用在毫米波雷达检测中 本身精度不高 所以其目的是进行目标检测 而非轮廓、特征检测
更新以gitee为准:
雷达簇类ply点云生成及聚类算法
文章目录
- ply点云显示
- 点云生成
- 点云生成函数
- 聚类算法的目标检测
- 动态参数调整
- 重复簇类过滤
- 最终结果和完整代码
- 附录:列表的赋值类型和py打包
- 列表赋值
- BUG复现
- 代码改进
- 优化
- 总结
- py打包
ply点云显示
通过plyfile库可以完成点云的读取或写入
同时 引入color map 使其与不同的深度值进行对应
ply读取函数如下:
color_map = [(128, 0, 0),     (132, 0, 0),     (136, 0, 0),     (140, 0, 0),(144, 0, 0),     (148, 0, 0),     (152, 0, 0),     (156, 0, 0),(160, 0, 0),     (164, 0, 0),     (168, 0, 0),     (172, 0, 0),(176, 0, 0),     (180, 0, 0),     (184, 0, 0),     (188, 0, 0),(192, 0, 0),     (196, 0, 0),     (200, 0, 0),     (204, 0, 0),(208, 0, 0),     (212, 0, 0),     (216, 0, 0),     (220, 0, 0),(224, 0, 0),     (228, 0, 0),     (232, 0, 0),     (236, 0, 0),(240, 0, 0),     (244, 0, 0),     (248, 0, 0),     (252, 0, 0),(255, 0, 0),     (255, 4, 0),     (255, 8, 0),     (255, 12, 0),(255, 16, 0),    (255, 20, 0),    (255, 24, 0),    (255, 28, 0),(255, 32, 0),    (255, 36, 0),    (255, 40, 0),    (255, 44, 0),(255, 48, 0),    (255, 52, 0),    (255, 56, 0),    (255, 60, 0),(255, 64, 0),    (255, 68, 0),    (255, 72, 0),    (255, 76, 0),(255, 80, 0),    (255, 84, 0),    (255, 88, 0),    (255, 92, 0),(255, 96, 0),    (255, 100, 0),   (255, 104, 0),   (255, 108, 0),(255, 112, 0),   (255, 116, 0),   (255, 120, 0),   (255, 124, 0),(255, 128, 0),   (255, 132, 0),   (255, 136, 0),   (255, 140, 0),(255, 144, 0),   (255, 148, 0),   (255, 152, 0),   (255, 156, 0),(255, 160, 0),   (255, 164, 0),   (255, 168, 0),   (255, 172, 0),(255, 176, 0),   (255, 180, 0),   (255, 184, 0),   (255, 188, 0),(255, 192, 0),   (255, 196, 0),   (255, 200, 0),   (255, 204, 0),(255, 208, 0),   (255, 212, 0),   (255, 216, 0),   (255, 220, 0),(255, 224, 0),   (255, 228, 0),   (255, 232, 0),   (255, 236, 0),(255, 240, 0),   (255, 244, 0),   (255, 248, 0),   (255, 252, 0),(254, 255, 1),   (250, 255, 6),   (246, 255, 10),  (242, 255, 14),(238, 255, 18),  (234, 255, 22),  (230, 255, 26),  (226, 255, 30),(222, 255, 34),  (218, 255, 38),  (214, 255, 42),  (210, 255, 46),(206, 255, 50),  (202, 255, 54),  (198, 255, 58),  (194, 255, 62),(190, 255, 66),  (186, 255, 70),  (182, 255, 74),  (178, 255, 78),(174, 255, 82),  (170, 255, 86),  (166, 255, 90),  (162, 255, 94),(158, 255, 98),  (154, 255, 102), (150, 255, 106), (146, 255, 110),(142, 255, 114), (138, 255, 118), (134, 255, 122), (130, 255, 126),(126, 255, 130), (122, 255, 134), (118, 255, 138), (114, 255, 142),(110, 255, 146), (106, 255, 150), (102, 255, 154), (98, 255, 158),(94, 255, 162),  (90, 255, 166),  (86, 255, 170),  (82, 255, 174),(78, 255, 178),  (74, 255, 182),  (70, 255, 186),  (66, 255, 190),(62, 255, 194),  (58, 255, 198),  (54, 255, 202),  (50, 255, 206),(46, 255, 210),  (42, 255, 214),  (38, 255, 218),  (34, 255, 222),(30, 255, 226),  (26, 255, 230),  (22, 255, 234),  (18, 255, 238),(14, 255, 242),  (10, 255, 246),  (6, 255, 250),   (2, 255, 254),(0, 252, 255),   (0, 248, 255),   (0, 244, 255),   (0, 240, 255),(0, 236, 255),   (0, 232, 255),   (0, 228, 255),   (0, 224, 255),(0, 220, 255),   (0, 216, 255),   (0, 212, 255),   (0, 208, 255),(0, 204, 255),   (0, 200, 255),   (0, 196, 255),   (0, 192, 255),(0, 188, 255),   (0, 184, 255),   (0, 180, 255),   (0, 176, 255),(0, 172, 255),   (0, 168, 255),   (0, 164, 255),   (0, 160, 255),(0, 156, 255),   (0, 152, 255),   (0, 148, 255),   (0, 144, 255),(0, 140, 255),   (0, 136, 255),   (0, 132, 255),   (0, 128, 255),(0, 124, 255),   (0, 120, 255),   (0, 116, 255),   (0, 112, 255),(0, 108, 255),   (0, 104, 255),   (0, 100, 255),   (0, 96, 255),(0, 92, 255),    (0, 88, 255),    (0, 84, 255),    (0, 80, 255),(0, 76, 255),    (0, 72, 255),    (0, 68, 255),    (0, 64, 255),(0, 60, 255),    (0, 56, 255),    (0, 52, 255),    (0, 48, 255),(0, 44, 255),    (0, 40, 255),    (0, 36, 255),    (0, 32, 255),(0, 28, 255),    (0, 24, 255),    (0, 20, 255),    (0, 16, 255),(0, 12, 255),    (0, 8, 255),     (0, 4, 255),     (0, 0, 255),(0, 0, 252),     (0, 0, 248),     (0, 0, 244),     (0, 0, 240),(0, 0, 236),     (0, 0, 232),     (0, 0, 228),     (0, 0, 224),(0, 0, 220),     (0, 0, 216),     (0, 0, 212),     (0, 0, 208),(0, 0, 204),     (0, 0, 200),     (0, 0, 196),     (0, 0, 192),(0, 0, 188),     (0, 0, 184),     (0, 0, 180),     (0, 0, 176),(0, 0, 172),     (0, 0, 168),     (0, 0, 164),     (0, 0, 160),(0, 0, 156),     (0, 0, 152),     (0, 0, 148),     (0, 0, 144),(0, 0, 140),     (0, 0, 136),     (0, 0, 132),     (0, 0, 128)
]def visualize_ply(file_path):# 读取PLY文件ply_data = PlyData.read(file_path)vertices = ply_data['vertex']# 提取坐标数据x = vertices['x']y = vertices['y']z = vertices['z']# 计算深度范围min_depth = np.min(z)max_depth = np.max(z)depth_range = max_depth - min_depth# 生成颜色映射colors = []for depth in z:# 将深度映射到颜色索引 (0-255)color_idx = int(((depth - min_depth) / depth_range) * (len(color_map)-1))colors.append(color_map[color_idx])# 转换为0-1范围的RGB值colors = np.array(colors) / 255.0# 创建3D可视化fig = plt.figure(figsize=(10, 8))ax = fig.add_subplot(111, projection='3d')# 绘制点云ax.scatter(x, y, z, c=colors, s=1, marker='o')# 设置坐标轴标签ax.set_xlabel('X')ax.set_ylabel('Y')ax.set_zlabel('Z')# 启用交互式旋转plt.show(block=True)  # 添加block=True参数保持窗口显示
点云生成
通过一个gui来生成点云
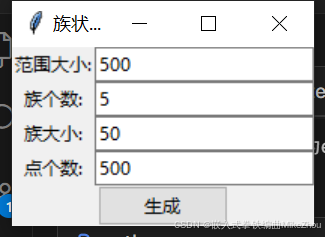
class CylinderGUI:def __init__(self):self.root = tk.Tk()self.root.title('族状点云生成器')ttk.Label(self.root, text='范围大小:').grid(row=0, column=0)self.size_entry = ttk.Entry(self.root)self.size_entry.insert(0, '500')self.size_entry.grid(row=0, column=1)# 更新输入控件ttk.Label(self.root, text='族个数:').grid(row=1, column=0)self.clusters_entry = ttk.Entry(self.root)self.clusters_entry.insert(0, '5')self.clusters_entry.grid(row=1, column=1)ttk.Label(self.root, text='族大小:').grid(row=2, column=0)self.cluster_radius_range_entry = ttk.Entry(self.root)self.cluster_radius_range_entry.insert(0, 50)self.cluster_radius_range_entry.grid(row=2, column=1)ttk.Label(self.root, text='点个数:').grid(row=3, column=0)self.points_per_cluster_entry = ttk.Entry(self.root)self.points_per_cluster_entry.insert(0, '500')self.points_per_cluster_entry.grid(row=3, column=1)# 生成按钮self.generate_btn = ttk.Button(self.root, text='生成', command=self.generate)self.generate_btn.grid(row=4, columnspan=2)def generate(self):try:size = float(self.size_entry.get())clusters = int(self.clusters_entry.get())points_per_cluster = int(self.points_per_cluster_entry.get())cluster_radius_range = float(self.cluster_radius_range_entry.get())# 调用新的生成函数vertices = generate_clustered_point_cloud(size=size,clusters=clusters,points_per_cluster=points_per_cluster,cluster_radius_range=cluster_radius_range)if vertices is None:messagebox.showwarning("警告", "未生成有效点云,请调整检测参数")returnx, y, z = zip(*vertices)# 创建PLY结构并保存(保留原有实现)vertices = np.zeros(len(x), dtype=[('x', 'f4'), ('y', 'f4'), ('z', 'f4')])vertices['x'], vertices['y'], vertices['z'] = x, y, zply = PlyData([PlyElement.describe(vertices, 'vertex')], text=True)ply.write('clusters.ply')# 调用可视化visualize_ply('clusters.ply')except ValueError as e:print(f"参数错误: {e}")
点云生成函数
函数如下:
即随机生成几团点 定义云团的半径 点个数等
def generate_clustered_point_cloud(size, clusters, points_per_cluster, cluster_radius_range, noise=5, scattered_points=50):"""生成随机分布的簇状点云参数:size: 立方体空间尺寸(单位:毫米)clusters: 簇数量points_per_cluster: 每簇点数cluster_radius_range: 簇半径范围(最小,最大)单位毫米noise: 噪声级别"""vertices = []for _ in range(clusters):# 随机生成簇中心坐标center_x = random.uniform(-size/2, size/2)center_y = random.uniform(-size/2, size/2)center_z = random.uniform(-size/2, size/2)# 随机生成当前簇的半径cluster_radius = cluster_radius_range# 生成当前簇的点for _ in range(points_per_cluster):# 在球坐标系下生成随机点theta = random.uniform(0, 2*math.pi)phi = random.uniform(0, math.pi)r = cluster_radius * random.random()# 转换为笛卡尔坐标系并添加噪声x = center_x + r * math.sin(phi) * math.cos(theta) + random.gauss(0, noise)y = center_y + r * math.sin(phi) * math.sin(theta) + random.gauss(0, noise)z = center_z + r * math.cos(phi) + random.gauss(0, noise)vertices.append((x, y, z))for _ in range(int(noise*10)):# 在25%半径范围内生成点theta = random.uniform(0, 2*math.pi)phi = random.uniform(0, math.pi)r = cluster_radius * (1.0 + 0.25 * random.random())x = center_x + r * math.sin(phi) * math.cos(theta) + random.gauss(0, noise)y = center_y + r * math.sin(phi) * math.sin(theta) + random.gauss(0, noise)z = center_z + r * math.cos(phi) + random.gauss(0, noise)vertices.append((x, y, z))# 生成零散噪音点for _ in range(scattered_points):x = random.uniform(-size/2, size/2) + random.gauss(0, noise)y = random.uniform(-size/2, size/2) + random.gauss(0, noise)z = random.uniform(-size/2, size/2) + random.gauss(0, noise)vertices.append((x, y, z))return vertices
同时加入噪声机制
随机生成噪点
# 生成零散噪音点for _ in range(scattered_points):x = random.uniform(-size/2, size/2) + random.gauss(0, noise)y = random.uniform(-size/2, size/2) + random.gauss(0, noise)z = random.uniform(-size/2, size/2) + random.gauss(0, noise)vertices.append((x, y, z))
在定义的半径外围25%范围内 稀疏的生成噪音点 这样一来 生成的团就是中间密集 外围稀疏
for _ in range(int(noise*10)):# 在25%半径范围内生成点theta = random.uniform(0, 2*math.pi)phi = random.uniform(0, math.pi)r = cluster_radius * (1.0 + 0.25 * random.random())x = center_x + r * math.sin(phi) * math.cos(theta) + random.gauss(0, noise)y = center_y + r * math.sin(phi) * math.sin(theta) + random.gauss(0, noise)z = center_z + r * math.cos(phi) + random.gauss(0, noise)vertices.append((x, y, z))
效果:
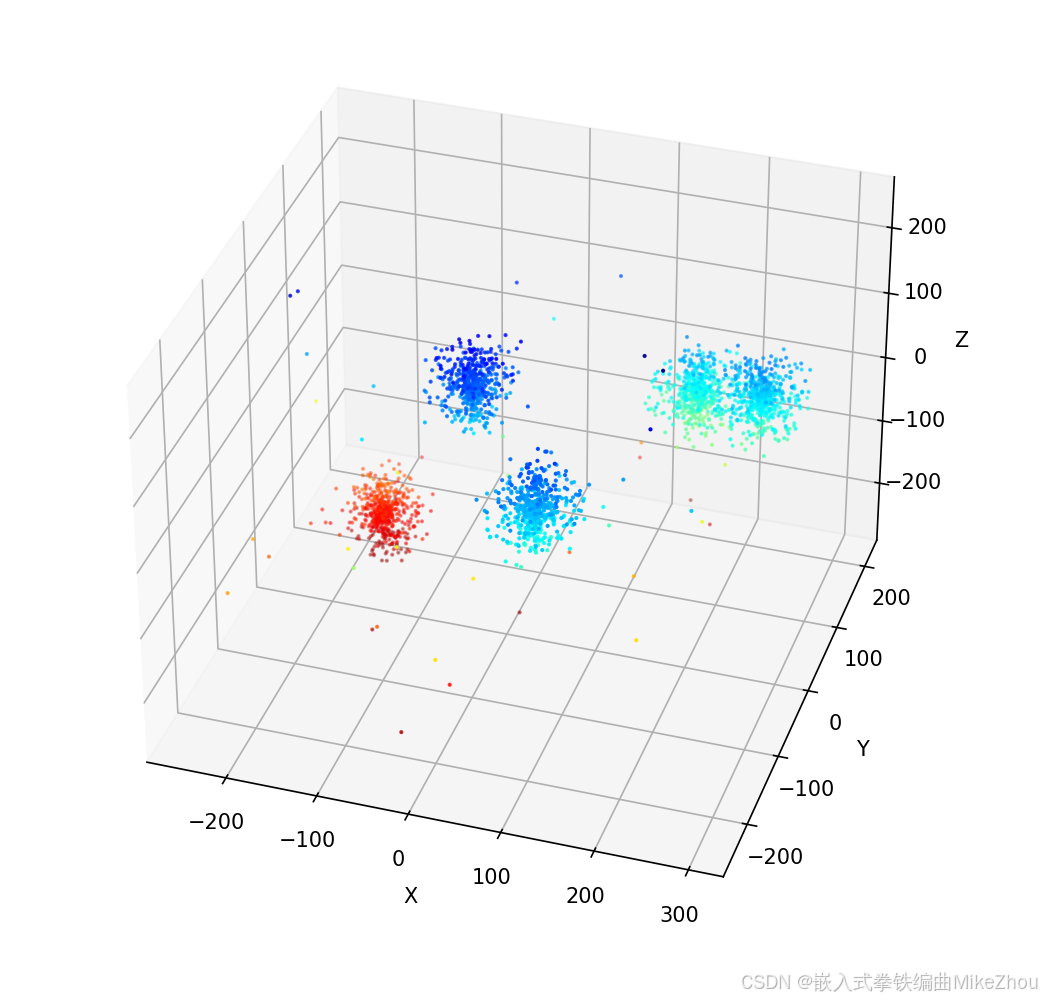
这里定义了五个团 有两个靠得太近都快在一起了
聚类算法的目标检测
def calculate_clusters(vertices):points = np.array([[v['x'], v['y'], v['z']] for v in vertices])# 使用DBSCAN进行聚类db = auto_tune_parameters(points).fit(points)labels = db.labels_clusters = []# 遍历所有簇(忽略噪声点-1)for cluster_id in set(labels) - {-1}:# 获取当前簇的所有点cluster_points = points[labels == cluster_id]# 计算中心点(质心)center = cluster_points.mean(axis=0)# 计算半径(最大距离)distances = np.linalg.norm(cluster_points - center, axis=1)radius = distances.max()clusters.append({'center': center.tolist(),'radius': float(radius)})# 在返回clusters前添加过滤逻辑filtered_clusters = []for i, cluster in enumerate(clusters):is_nested = Falsefor j, other in enumerate(clusters):if i != j:# 计算簇间距离distance = np.linalg.norm(np.array(cluster['center']) - np.array(other['center']))# 如果当前簇完全被其他簇包含if distance + cluster['radius'] < other['radius']:is_nested = Truebreakif not is_nested:filtered_clusters.append(cluster)return filtered_clusters
核心函数为DBSCAN(eps=auto_eps, min_samples=auto_min_samples)
根据传入的eps和最小样本数不同 会聚类为不同的团
eps(ε):
定义点的邻域半径
决定两个点是否被视为"相邻"
若设置过小:会将连续区域误分为多个小簇
若设置过大:会将多个独立簇合并
min_samples(N):
定义核心点所需的最小邻域点数
控制形成簇的最小密度
若设置过高:只有极高密度区域会被识别为簇
若设置过低:噪声点可能被误认为簇
您遇到的现象解释 当每个簇有500点但设置min_samples=50/100时:
实际有效邻域点数可能不足(例如在半径ε范围内平均只有30个点)
算法无法找到足够多的核心点来形成大簇
最终只能检测到密度极高的局部区域
动态参数调整
在DBSCAN(eps=auto_eps, min_samples=auto_min_samples)函数传参中
计算出平均相邻距离 并进行动态参数设置
def auto_tune_parameters(points):# 计算平均最近邻距离nbrs = NearestNeighbors(n_neighbors=5).fit(points)distances, _ = nbrs.kneighbors(points)mean_distance = np.mean(distances[:,-1])# 动态设置参数auto_eps = mean_distance * 3auto_min_samples = int(len(points)*0.05)return DBSCAN(eps=auto_eps, min_samples=auto_min_samples)重复簇类过滤
# 在返回clusters前添加过滤逻辑filtered_clusters = []for i, cluster in enumerate(clusters):is_nested = Falsefor j, other in enumerate(clusters):if i != j:# 计算簇间距离distance = np.linalg.norm(np.array(cluster['center']) - np.array(other['center']))# 如果当前簇完全被其他簇包含if distance + cluster['radius'] < other['radius']:is_nested = Truebreakif not is_nested:filtered_clusters.append(cluster)
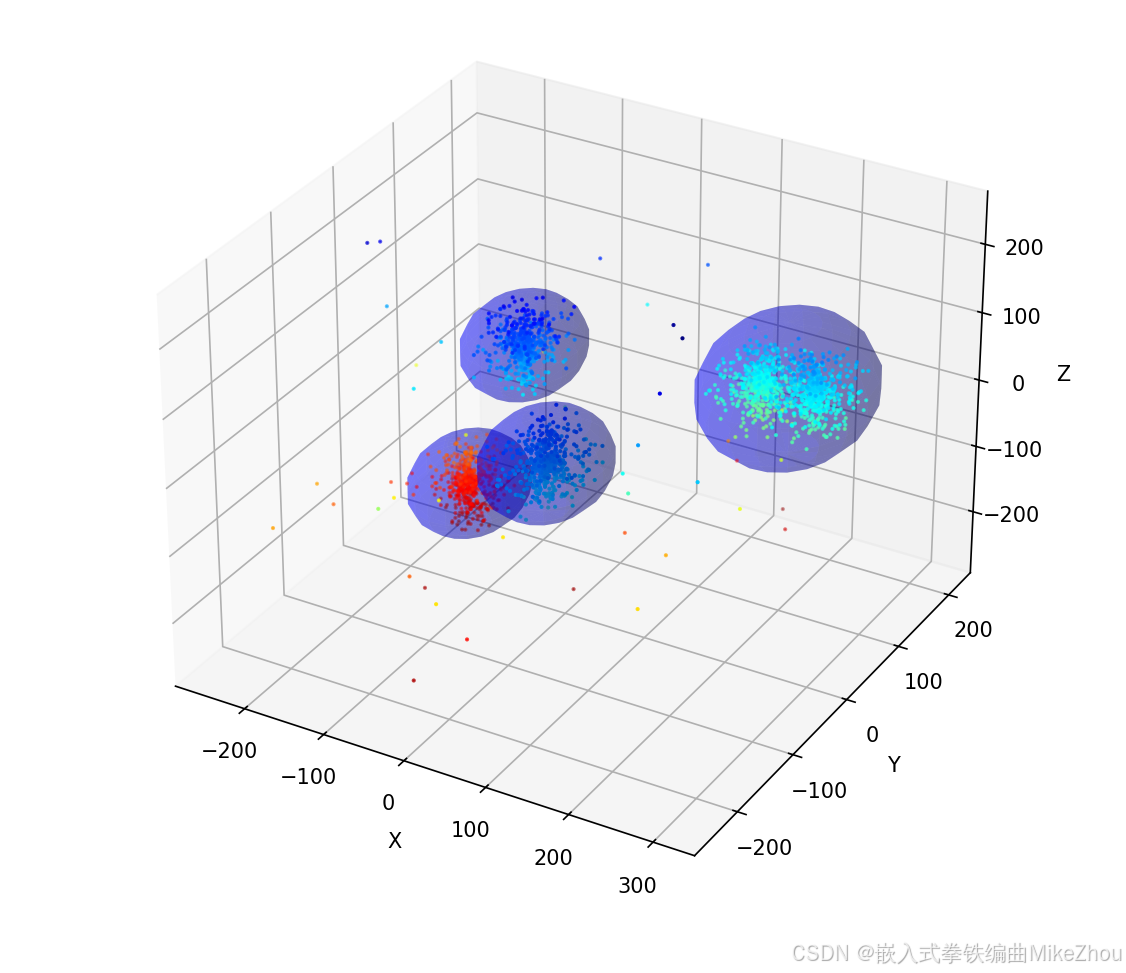
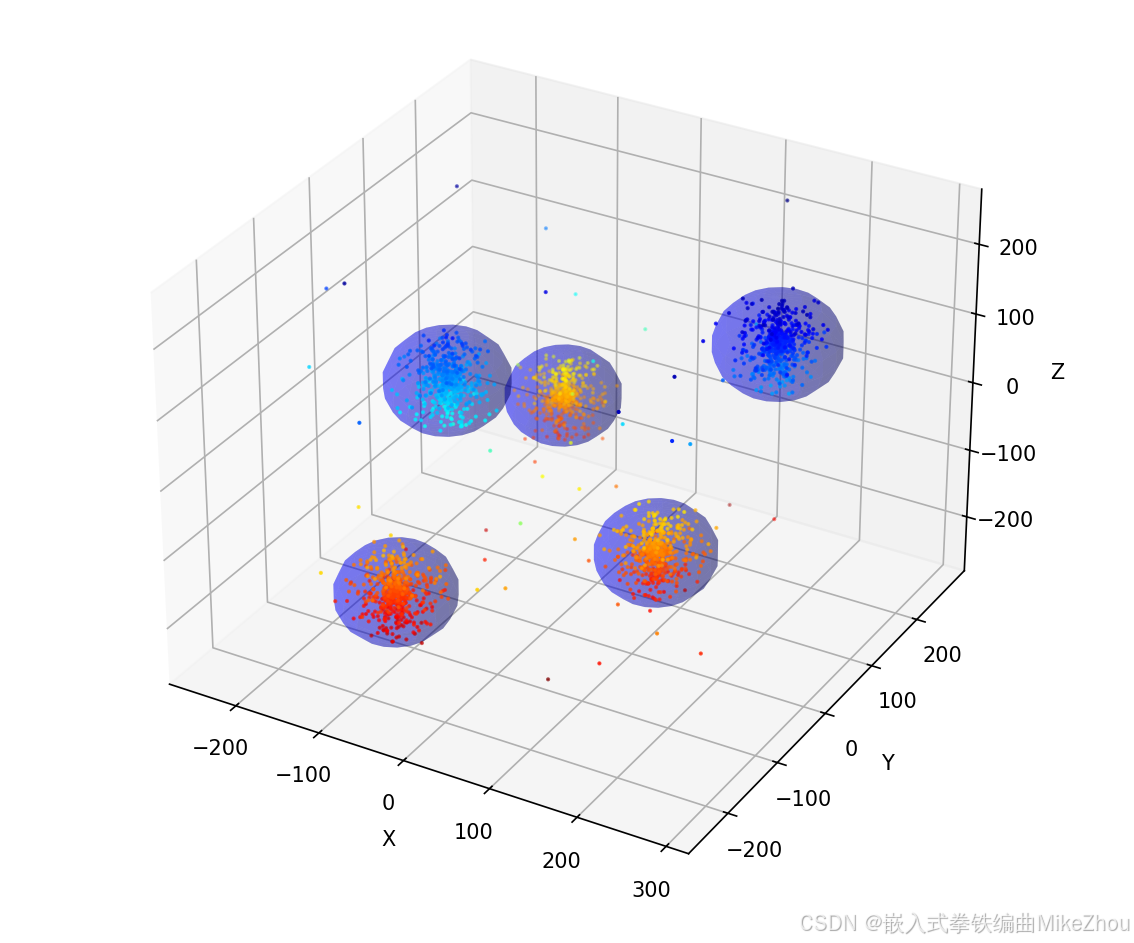
最终结果和完整代码
设置了动态调参 相邻的两个团会被检测在一起
from clusters_generate import *
import numpy as np
import matplotlib.pyplot as plt
from plyfile import PlyData, PlyElement
import math
from sklearn.cluster import DBSCAN
from sklearn.neighbors import NearestNeighborsdef auto_tune_parameters(points):# 计算平均最近邻距离nbrs = NearestNeighbors(n_neighbors=5).fit(points)distances, _ = nbrs.kneighbors(points)mean_distance = np.mean(distances[:,-1])# 动态设置参数auto_eps = mean_distance * 3auto_min_samples = int(len(points)*0.05)return DBSCAN(eps=auto_eps, min_samples=auto_min_samples)def calculate_clusters(vertices):points = np.array([[v['x'], v['y'], v['z']] for v in vertices])# 使用DBSCAN进行聚类db = auto_tune_parameters(points).fit(points)labels = db.labels_clusters = []# 遍历所有簇(忽略噪声点-1)for cluster_id in set(labels) - {-1}:# 获取当前簇的所有点cluster_points = points[labels == cluster_id]# 计算中心点(质心)center = cluster_points.mean(axis=0)# 计算半径(最大距离)distances = np.linalg.norm(cluster_points - center, axis=1)radius = distances.max()clusters.append({'center': center.tolist(),'radius': float(radius)})# 在返回clusters前添加过滤逻辑filtered_clusters = []for i, cluster in enumerate(clusters):is_nested = Falsefor j, other in enumerate(clusters):if i != j:# 计算簇间距离distance = np.linalg.norm(np.array(cluster['center']) - np.array(other['center']))# 如果当前簇完全被其他簇包含if distance + cluster['radius'] < other['radius']:is_nested = Truebreakif not is_nested:filtered_clusters.append(cluster)return filtered_clustersdef detect_clusters(filename):# 读取PLY文件ply_data = PlyData.read(filename)vertices = ply_data['vertex']# 提取坐标数据x = vertices['x']y = vertices['y']z = vertices['z']# 计算深度范围min_depth = np.min(z)max_depth = np.max(z)depth_range = max_depth - min_depthcolors = []for depth in z:# 将深度映射到颜色索引 (0-255)color_idx = int(((depth - min_depth) / depth_range) * (len(color_map)-1))colors.append(color_map[color_idx])# 转换为0-1范围的RGB值colors = np.array(colors) / 255.0# 创建3D可视化fig = plt.figure(figsize=(10, 8))ax = fig.add_subplot(111, projection='3d')# 绘制原始点云ax.scatter(x, y, z, c=colors, s=1, marker='o', label='原始点云')clusters = calculate_clusters(vertices)print(clusters)# 绘制聚类结果for cluster in clusters:center = cluster['center']radius = cluster['radius']# 绘制 sphereu, v = np.mgrid[0:2*np.pi:20j, 0:np.pi:10j]x = center[0] + radius * np.cos(u) * np.sin(v)y = center[1] + radius * np.sin(u) * np.sin(v)z = center[2] + radius * np.cos(v)ax.plot_surface(x, y, z, color='b', alpha=0.3)# 设置坐标轴标签ax.set_xlabel('X')ax.set_ylabel('Y')ax.set_zlabel('Z')plt.show(block=True)  # 添加block=True参数保持窗口显示if __name__ == "__main__":detect_clusters('clusters.ply')
import numpy as np
import matplotlib.pyplot as plt
from plyfile import PlyData, PlyElement
import tkinter as tk
from tkinter import ttk
import math
from tkinter import messagebox import randomcolor_map = [(128, 0, 0), (132, 0, 0), (136, 0, 0), (140, 0, 0),(144, 0, 0), (148, 0, 0), (152, 0, 0), (156, 0, 0),(160, 0, 0), (164, 0, 0), (168, 0, 0), (172, 0, 0),(176, 0, 0), (180, 0, 0), (184, 0, 0), (188, 0, 0),(192, 0, 0), (196, 0, 0), (200, 0, 0), (204, 0, 0),(208, 0, 0), (212, 0, 0), (216, 0, 0), (220, 0, 0),(224, 0, 0), (228, 0, 0), (232, 0, 0), (236, 0, 0),(240, 0, 0), (244, 0, 0), (248, 0, 0), (252, 0, 0),(255, 0, 0), (255, 4, 0), (255, 8, 0), (255, 12, 0),(255, 16, 0), (255, 20, 0), (255, 24, 0), (255, 28, 0),(255, 32, 0), (255, 36, 0), (255, 40, 0), (255, 44, 0),(255, 48, 0), (255, 52, 0), (255, 56, 0), (255, 60, 0),(255, 64, 0), (255, 68, 0), (255, 72, 0), (255, 76, 0),(255, 80, 0), (255, 84, 0), (255, 88, 0), (255, 92, 0),(255, 96, 0), (255, 100, 0), (255, 104, 0), (255, 108, 0),(255, 112, 0), (255, 116, 0), (255, 120, 0), (255, 124, 0),(255, 128, 0), (255, 132, 0), (255, 136, 0), (255, 140, 0),(255, 144, 0), (255, 148, 0), (255, 152, 0), (255, 156, 0),(255, 160, 0), (255, 164, 0), (255, 168, 0), (255, 172, 0),(255, 176, 0), (255, 180, 0), (255, 184, 0), (255, 188, 0),(255, 192, 0), (255, 196, 0), (255, 200, 0), (255, 204, 0),(255, 208, 0), (255, 212, 0), (255, 216, 0), (255, 220, 0),(255, 224, 0), (255, 228, 0), (255, 232, 0), (255, 236, 0),(255, 240, 0), (255, 244, 0), (255, 248, 0), (255, 252, 0),(254, 255, 1), (250, 255, 6), (246, 255, 10), (242, 255, 14),(238, 255, 18), (234, 255, 22), (230, 255, 26), (226, 255, 30),(222, 255, 34), (218, 255, 38), (214, 255, 42), (210, 255, 46),(206, 255, 50), (202, 255, 54), (198, 255, 58), (194, 255, 62),(190, 255, 66), (186, 255, 70), (182, 255, 74), (178, 255, 78),(174, 255, 82), (170, 255, 86), (166, 255, 90), (162, 255, 94),(158, 255, 98), (154, 255, 102), (150, 255, 106), (146, 255, 110),(142, 255, 114), (138, 255, 118), (134, 255, 122), (130, 255, 126),(126, 255, 130), (122, 255, 134), (118, 255, 138), (114, 255, 142),(110, 255, 146), (106, 255, 150), (102, 255, 154), (98, 255, 158),(94, 255, 162), (90, 255, 166), (86, 255, 170), (82, 255, 174),(78, 255, 178), (74, 255, 182), (70, 255, 186), (66, 255, 190),(62, 255, 194), (58, 255, 198), (54, 255, 202), (50, 255, 206),(46, 255, 210), (42, 255, 214), (38, 255, 218), (34, 255, 222),(30, 255, 226), (26, 255, 230), (22, 255, 234), (18, 255, 238),(14, 255, 242), (10, 255, 246), (6, 255, 250), (2, 255, 254),(0, 252, 255), (0, 248, 255), (0, 244, 255), (0, 240, 255),(0, 236, 255), (0, 232, 255), (0, 228, 255), (0, 224, 255),(0, 220, 255), (0, 216, 255), (0, 212, 255), (0, 208, 255),(0, 204, 255), (0, 200, 255), (0, 196, 255), (0, 192, 255),(0, 188, 255), (0, 184, 255), (0, 180, 255), (0, 176, 255),(0, 172, 255), (0, 168, 255), (0, 164, 255), (0, 160, 255),(0, 156, 255), (0, 152, 255), (0, 148, 255), (0, 144, 255),(0, 140, 255), (0, 136, 255), (0, 132, 255), (0, 128, 255),(0, 124, 255), (0, 120, 255), (0, 116, 255), (0, 112, 255),(0, 108, 255), (0, 104, 255), (0, 100, 255), (0, 96, 255),(0, 92, 255), (0, 88, 255), (0, 84, 255), (0, 80, 255),(0, 76, 255), (0, 72, 255), (0, 68, 255), (0, 64, 255),(0, 60, 255), (0, 56, 255), (0, 52, 255), (0, 48, 255),(0, 44, 255), (0, 40, 255), (0, 36, 255), (0, 32, 255),(0, 28, 255), (0, 24, 255), (0, 20, 255), (0, 16, 255),(0, 12, 255), (0, 8, 255), (0, 4, 255), (0, 0, 255),(0, 0, 252), (0, 0, 248), (0, 0, 244), (0, 0, 240),(0, 0, 236), (0, 0, 232), (0, 0, 228), (0, 0, 224),(0, 0, 220), (0, 0, 216), (0, 0, 212), (0, 0, 208),(0, 0, 204), (0, 0, 200), (0, 0, 196), (0, 0, 192),(0, 0, 188), (0, 0, 184), (0, 0, 180), (0, 0, 176),(0, 0, 172), (0, 0, 168), (0, 0, 164), (0, 0, 160),(0, 0, 156), (0, 0, 152), (0, 0, 148), (0, 0, 144),(0, 0, 140), (0, 0, 136), (0, 0, 132), (0, 0, 128)
]def visualize_ply(file_path):# 读取PLY文件ply_data = PlyData.read(file_path)vertices = ply_data['vertex']# 提取坐标数据x = vertices['x']y = vertices['y']z = vertices['z']# 计算深度范围min_depth = np.min(z)max_depth = np.max(z)depth_range = max_depth - min_depth# 生成颜色映射colors = []for depth in z:# 将深度映射到颜色索引 (0-255)color_idx = int(((depth - min_depth) / depth_range) * (len(color_map)-1))colors.append(color_map[color_idx])# 转换为0-1范围的RGB值colors = np.array(colors) / 255.0# 创建3D可视化fig = plt.figure(figsize=(10, 8))ax = fig.add_subplot(111, projection='3d')# 绘制点云ax.scatter(x, y, z, c=colors, s=1, marker='o')# 设置坐标轴标签ax.set_xlabel('X')ax.set_ylabel('Y')ax.set_zlabel('Z')# 启用交互式旋转plt.show(block=True) # 添加block=True参数保持窗口显示def generate_clustered_point_cloud(size, clusters, points_per_cluster, cluster_radius_range, noise=5, scattered_points=50):"""生成随机分布的簇状点云参数:size: 立方体空间尺寸(单位:毫米)clusters: 簇数量points_per_cluster: 每簇点数cluster_radius_range: 簇半径范围(最小,最大)单位毫米noise: 噪声级别"""vertices = []for _ in range(clusters):# 随机生成簇中心坐标center_x = random.uniform(-size/2, size/2)center_y = random.uniform(-size/2, size/2)center_z = random.uniform(-size/2, size/2)# 随机生成当前簇的半径cluster_radius = cluster_radius_range# 生成当前簇的点for _ in range(points_per_cluster):# 在球坐标系下生成随机点theta = random.uniform(0, 2*math.pi)phi = random.uniform(0, math.pi)r = cluster_radius * random.random()# 转换为笛卡尔坐标系并添加噪声x = center_x + r * math.sin(phi) * math.cos(theta) + random.gauss(0, noise)y = center_y + r * math.sin(phi) * math.sin(theta) + random.gauss(0, noise)z = center_z + r * math.cos(phi) + random.gauss(0, noise)vertices.append((x, y, z))for _ in range(int(noise*10)):# 在25%半径范围内生成点theta = random.uniform(0, 2*math.pi)phi = random.uniform(0, math.pi)r = cluster_radius * (1.0 + 0.25 * random.random())x = center_x + r * math.sin(phi) * math.cos(theta) + random.gauss(0, noise)y = center_y + r * math.sin(phi) * math.sin(theta) + random.gauss(0, noise)z = center_z + r * math.cos(phi) + random.gauss(0, noise)vertices.append((x, y, z))# 生成零散噪音点for _ in range(scattered_points):x = random.uniform(-size/2, size/2) + random.gauss(0, noise)y = random.uniform(-size/2, size/2) + random.gauss(0, noise)z = random.uniform(-size/2, size/2) + random.gauss(0, noise)vertices.append((x, y, z))return verticesclass CylinderGUI:def __init__(self):self.root = tk.Tk()self.root.title('族状点云生成器')ttk.Label(self.root, text='范围大小:').grid(row=0, column=0)self.size_entry = ttk.Entry(self.root)self.size_entry.insert(0, '500')self.size_entry.grid(row=0, column=1)# 更新输入控件ttk.Label(self.root, text='族个数:').grid(row=1, column=0)self.clusters_entry = ttk.Entry(self.root)self.clusters_entry.insert(0, '5')self.clusters_entry.grid(row=1, column=1)ttk.Label(self.root, text='族大小:').grid(row=2, column=0)self.cluster_radius_range_entry = ttk.Entry(self.root)self.cluster_radius_range_entry.insert(0, 50)self.cluster_radius_range_entry.grid(row=2, column=1)ttk.Label(self.root, text='点个数:').grid(row=3, column=0)self.points_per_cluster_entry = ttk.Entry(self.root)self.points_per_cluster_entry.insert(0, '500')self.points_per_cluster_entry.grid(row=3, column=1)# 生成按钮self.generate_btn = ttk.Button(self.root, text='生成', command=self.generate)self.generate_btn.grid(row=4, columnspan=2)def generate(self):try:size = float(self.size_entry.get())clusters = int(self.clusters_entry.get())points_per_cluster = int(self.points_per_cluster_entry.get())cluster_radius_range = float(self.cluster_radius_range_entry.get())# 调用新的生成函数vertices = generate_clustered_point_cloud(size=size,clusters=clusters,points_per_cluster=points_per_cluster,cluster_radius_range=cluster_radius_range)if vertices is None:messagebox.showwarning("警告", "未生成有效点云,请调整检测参数")returnx, y, z = zip(*vertices)# 创建PLY结构并保存(保留原有实现)vertices = np.zeros(len(x), dtype=[('x', 'f4'), ('y', 'f4'), ('z', 'f4')])vertices['x'], vertices['y'], vertices['z'] = x, y, zply = PlyData([PlyElement.describe(vertices, 'vertex')], text=True)ply.write('clusters.ply')# 调用可视化visualize_ply('clusters.ply')except ValueError as e:print(f"参数错误: {e}")if __name__ == "__main__":gui = CylinderGUI()gui.root.mainloop()附录:列表的赋值类型和py打包
列表赋值
BUG复现
闲来无事写了个小程序 代码如下:
# -*- coding: utf-8 -*-
"""
Created on Fri Nov 19 19:47:01 2021@author: 16016
"""a_list = ['0','1','2','3','4','5','6','7','8','9','10','11','12','13','14','15']
#print(len(a_list))
#b_list = ['','','','','','','','','','','','','','','','']
c_list = [[],[],[],[],[],[],[],[],[],[],[],[],[],[],[],[]]
#for i in range(16):
if len(a_list):for j in range(16):a_list[j]=str(a_list[j])+'_'+str(j)print("序号:",j)print('a_list:\n',a_list)c_list[j]=a_listprint('c_list[0]:\n',c_list[0])print('\n')
#        b_list[j]=a_list[7],a_list[8]
#        print(b_list[j])# 写入到Excel:
#print(c_list,'\n')
我在程序中 做了一个16次的for循环 把列表a的每个值后面依次加上"_"和循环序号
比如循环第x次 就是把第x位加上_x 这一位变成x_x 我在输出测试中 列表a的每一次输出也是对的
循环16次后列表a应该变成[‘0_0’, ‘1_1’, ‘2_2’, ‘3_3’, ‘4_4’, ‘5_5’, ‘6_6’, ‘7_7’, ‘8_8’, ‘9_9’, ‘10_10’, ‘11_11’, ‘12_12’, ‘13_13’, ‘14_14’, ‘15_15’] 这也是对的
同时 我将每一次循环时列表a的值 写入到空列表c中 比如第x次循环 就是把更改以后的列表a的值 写入到列表c的第x位
第0次循环后 c[0]的值应该是[‘0_0’, ‘1’, ‘2’, ‘3’, ‘4’, ‘5’, ‘6’, ‘7’, ‘8’, ‘9’, ‘10’, ‘11’, ‘12’, ‘13’, ‘14’, ‘15’] 这也是对的
但是在第1次循环以后 c[0]的值就一直在变 变成了c[x]的值
相当于把c_list[0]变成了c_list[1]…以此类推 最后得出的列表c的值也是每一项完全一样
我不明白这是怎么回事
我的c[0]只在第0次循环时被赋值了 但是后面它的值跟着在改变
如图:

第一次老出bug 赋值以后 每次循环都改变c[0]的值 搞了半天都没搞出来
无论是用appen函数添加 还是用二维数组定义 或者增加第三个空数组来过渡 都无法解决
代码改进
后来在我华科同学的指导下 突然想到赋值可以赋的是个地址 地址里面的值一直变化 导致赋值也一直变化 于是用第二张图的循环套循环深度复制实现了
代码如下:
# -*- coding: utf-8 -*-
"""
Created on Fri Nov 19 19:47:01 2021@author: 16016
"""a_list = ['0','1','2','3','4','5','6','7','8','9','10','11','12','13','14','15']
#print(len(a_list))
#b_list = ['','','','','','','','','','','','','','','','']
c_list = [[],[],[],[],[],[],[],[],[],[],[],[],[],[],[],[]]
#for i in range(16):
if len(a_list):for j in range(16):a_list[j]=str(a_list[j])+'_'+str(j)print("序号:",j)print('a_list:\n',a_list)for i in range(16):c_list[j].append(a_list[i])print('c_list[0]:\n',c_list[0])print('\n')
#        b_list[j]=a_list[7],a_list[8]
#        print(b_list[j])# 写入到Excel:
print(c_list,'\n')
解决了问题

优化
第三次是请教了老师 用copy函数来赋真值
代码如下:
# -*- coding: utf-8 -*-
"""
Created on Fri Nov 19 19:47:01 2021@author: 16016
"""a_list = ['0','1','2','3','4','5','6','7','8','9','10','11','12','13','14','15']
#print(len(a_list))
#b_list = ['','','','','','','','','','','','','','','','']
c_list = [[],[],[],[],[],[],[],[],[],[],[],[],[],[],[],[]]
#for i in range(16):
if len(a_list):for j in range(16):a_list[j]=str(a_list[j])+'_'+str(j)print("序号:",j)print('a_list:\n',a_list)c_list[j]=a_list.copy()print('c_list[0]:\n',c_list[0])print('\n')
#        b_list[j]=a_list[7],a_list[8]
#        print(b_list[j])# 写入到Excel:
#print(c_list,'\n')
同样能解决问题

最后得出问题 就是指针惹的祸!
a_list指向的是个地址 而不是值 a_list[i]指向的才是单个的值 copy()函数也是复制值而不是地址
如果这个用C语言来写 就直观一些了 难怪C语言是基础 光学Python不学C 遇到这样的问题就解决不了
C语言yyds Python是什么垃圾弱智语言
总结
由于Python无法单独定义一个值为指针或者独立的值 所以只能用列表来传送
只要赋值是指向一个列表整体的 那么就是指向的一个指针内存地址 解决方法只有一个 那就是将每个值深度复制赋值(子列表内的元素提取出来重新依次连接) 或者用copy函数单独赋值
如图测试:


部分代码:
# -*- coding: utf-8 -*-
"""
Created on Sat Nov 20 16:45:48 2021@author: 16016
"""def text1():A=[1,2,3]B=[[],[],[]]for i in range(len(A)):A[i]=A[i]+iB[i]=Aprint(B)def text2():A=[1,2,3]B=[[],[],[]]A[0]=A[0]+0B[0]=Aprint(B)A[1]=A[1]+1B[1]=Aprint(B)A[2]=A[2]+2B[2]=Aprint(B)if __name__ == '__main__':text1()print('\n')text2()
py打包
Pyinstaller打包exe(包括打包资源文件 绝不出错版)
依赖包及其对应的版本号
PyQt5 5.10.1
PyQt5-Qt5 5.15.2
PyQt5-sip 12.9.0
pyinstaller 4.5.1
pyinstaller-hooks-contrib 2021.3
Pyinstaller -F setup.py 打包exe
Pyinstaller -F -w setup.py 不带控制台的打包
Pyinstaller -F -i xx.ico setup.py 打包指定exe图标打包
打包exe参数说明:
-F:打包后只生成单个exe格式文件;
-D:默认选项,创建一个目录,包含exe文件以及大量依赖文件;
-c:默认选项,使用控制台(就是类似cmd的黑框);
-w:不使用控制台;
-p:添加搜索路径,让其找到对应的库;
-i:改变生成程序的icon图标。
如果要打包资源文件
则需要对代码中的路径进行转换处理
另外要注意的是 如果要打包资源文件 则py程序里面的路径要从./xxx/yy换成xxx/yy 并且进行路径转换
但如果不打包资源文件的话 最好路径还是用作./xxx/yy 并且不进行路径转换
def get_resource_path(relative_path):if hasattr(sys, '_MEIPASS'):return os.path.join(sys._MEIPASS, relative_path)return os.path.join(os.path.abspath("."), relative_path)而后再spec文件中的datas部分加入目录
如:
a = Analysis(['cxk.py'],pathex=['D:\\Python Test\\cxk'],binaries=[],datas=[('root','root')],hiddenimports=[],hookspath=[],hooksconfig={},runtime_hooks=[],excludes=[],win_no_prefer_redirects=False,win_private_assemblies=False,cipher=block_cipher,noarchive=False)
而后直接Pyinstaller -F setup.spec即可
如果打包的文件过大则更改spec文件中的excludes 把不需要的库写进去(但是已经在环境中安装了的)就行
这些不要了的库在上一次编译时的shell里面输出
比如:


然后用pyinstaller --clean -F 某某.spec