基于 Prometheus+Alertmanager+Grafana 打造监控报警后台(一)-Prometheus介绍及安装
一、什么是 Prometheus?
1.1 Prometheus 是一个开源系统监控和警报工具包,最初由 SoundCloud 构建。自 2012 年启动以来,许多公司和组织都采用了 Prometheus,该项目拥有非常活跃的开发者和用户社区。它现在是一个独立的开源项目,独立于任何公司进行维护。为了强调这一点,并明确项目的治理结构,Prometheus 于 2016 年作为继 Kubernetes 之后的第二个托管项目加入了云原生计算基金会(CNCF)。
1.2 Prometheus 将其指标收集并存储为时间序列数据,即指标信息与记录时的时间戳以及称为标签的可选键值对一起存储。
🔍 核心特性
- 多维数据模型,可以按照实例,服务,端点和方法之类的维度随意对数据进行切片和切块- 有自己的查询语言 PromQL,可以进行非常灵活和多样的查询- 不依赖分布式存储;单个服务器节点是自治的, 可以随时随地部署监控服务- 时间序列收集通过 HTTP 上的拉模型进行- 通过中间网关(pushgateway)支持推送时间序列- 通过服务发现或静态配置发现目标实例- 多种图形和仪表板支持模式
1.3 Prometheus架构及其一些生态系统组件
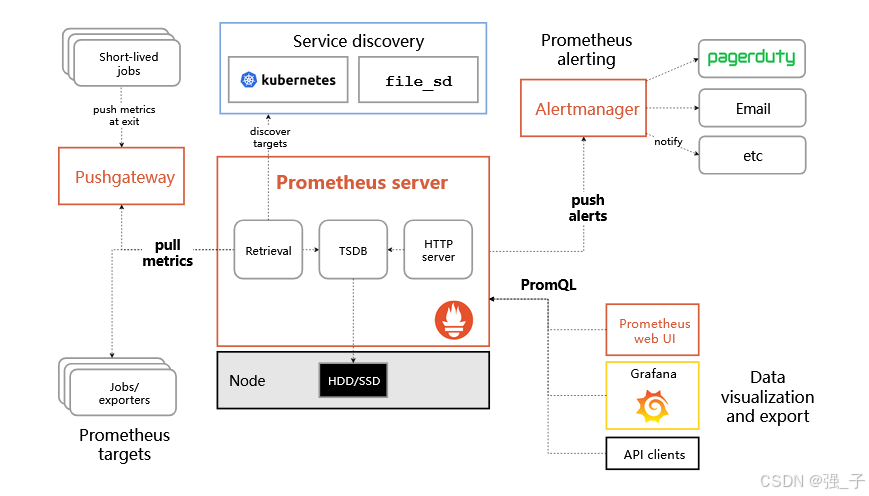
上面使用的是官方文档中的架构图,主要包含以下几点:
1.Prometheus Server是Prometheus组件中的核心部分,负责实现对监控数据的获取,存储以及查询。
2.Exporter将监控数据采集的端点通过HTTP服务的形式暴露给Prometheus Server,Prometheus Server通过访问该Exporter提供的Endpoint端点,即可获取到需要采集的监控数据。
3.AlertManager是在Prometheus Server中支持基于PromQL创建告警规则,如果满足PromQL定义的规则,则会产生一条告警,而告警的后续处理流程则由AlertManager进行管理使用邮件,企微等进行消息通知。
4.grafana是一个通用的可视化工具,它不仅适用于展示Prometheus下的监控数据,也同样适用于一些其他的数据可视化需求。
5.PushGateway是在当网络需求无法直接满足时,就可以利用PushGateway来进行中转。可以通过PushGateway将内部网络的监控数据主动Push到Gateway当中。而Prometheus Server则可以采用同样Pull的方 式从PushGateway中获取到监控数据。
二、使用 Docker 安装 Prometheus
我们采用 docker-compose 方式进行部署,便于管理配置与数据持久化。
- 创建项目目录结构
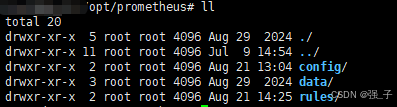
mkdir -p /opt/prometheus/{data,config,rules}
cd /opt/prometheus
目录说明:
config/:存放 prometheus.yml 主配置文件
rules/:存放告警规则文件
data/:Prometheus 数据存储目录(TSDB)
- 编写 Prometheus 配置文件
主配置:config/prometheus.yml
global:scrape_interval: 15s          # 全局采集间隔evaluation_interval: 15s      # 告警规则评估频率scrape_timeout: 10s           # 单次采集超时时间# 加载告警规则
rule_files:- "rules/*.yml"# 配置 Alertmanager(可选,用于告警通知)
alerting:alertmanagers:- static_configs:- targets:- "localhost:9093"  # 若使用 Alertmanager,填写其地址# 采集目标配置
scrape_configs:# 监控 Prometheus 自身- job_name: 'prometheus'static_configs:- targets: ['localhost:9090']# 示例:监控主机(需提前部署 Node_Exporter)- job_name: 'node_expoter'static_configs:- targets: ['localhost:9100']  labels:group: 'ubuntu-server'# 示例:监控 gpu指标(需提前部署 Dcgm_Exporter)- job_name: 'dcgm_exporter'static_configs:- targets: ['localhost:9400']
告警规则示例:rules/instance-down.yml
groups:- name: instance-healthrules:- alert: InstanceDownexpr: up == 0for: 1mlabels:severity: criticalannotations:summary: "实例 {{ $labels.instance }} 已宕机"description: "实例 {{ $labels.instance }} (job={{ $labels.job }}) 已宕机超过 1 分钟。"
- 编写 docker-compose.yml
version: '3.8'services:prometheus:image: prom/prometheus:latestcontainer_name: prometheusrestart: unless-stoppedcommand:- '--config.file=/etc/prometheus/prometheus.yml'- '--storage.tsdb.path=/prometheus'- '--web.enable-lifecycle' # 支持热加载配置(POST /-/reload)- '--storage.tsdb.retention.time=15d' # 数据保留 15 天ports:- "9090:9090"volumes:- ./config:/etc/prometheus- ./rules:/etc/prometheus/rules- prometheus_data:/prometheus- /etc/localtime:/etc/localtime:ro # 同步主机时间networks:- monitoringnetworks:monitoring:driver: bridgevolumes:prometheus_data:driver: local
三、启动 Prometheus 服务
# 在 /opt/prometheus 目录下执行
docker-compose up -d
验证服务
docker ps

如出现问题则查看日志更具日志保存进行相应的调整
docker logs -f prometheus
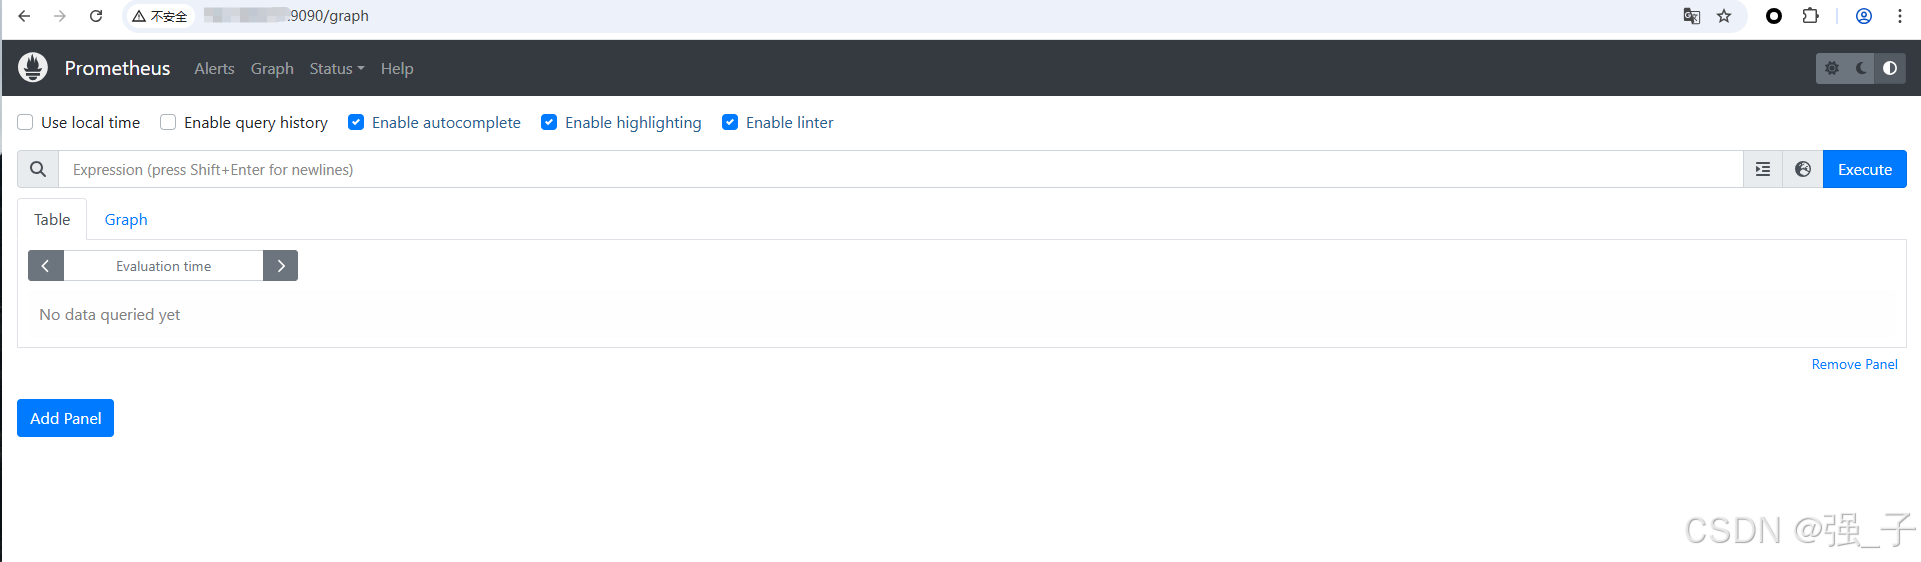
五、访问 Prometheus Web UI
打开浏览器访问:
http://{ip}:9090
查询个exporter状态:
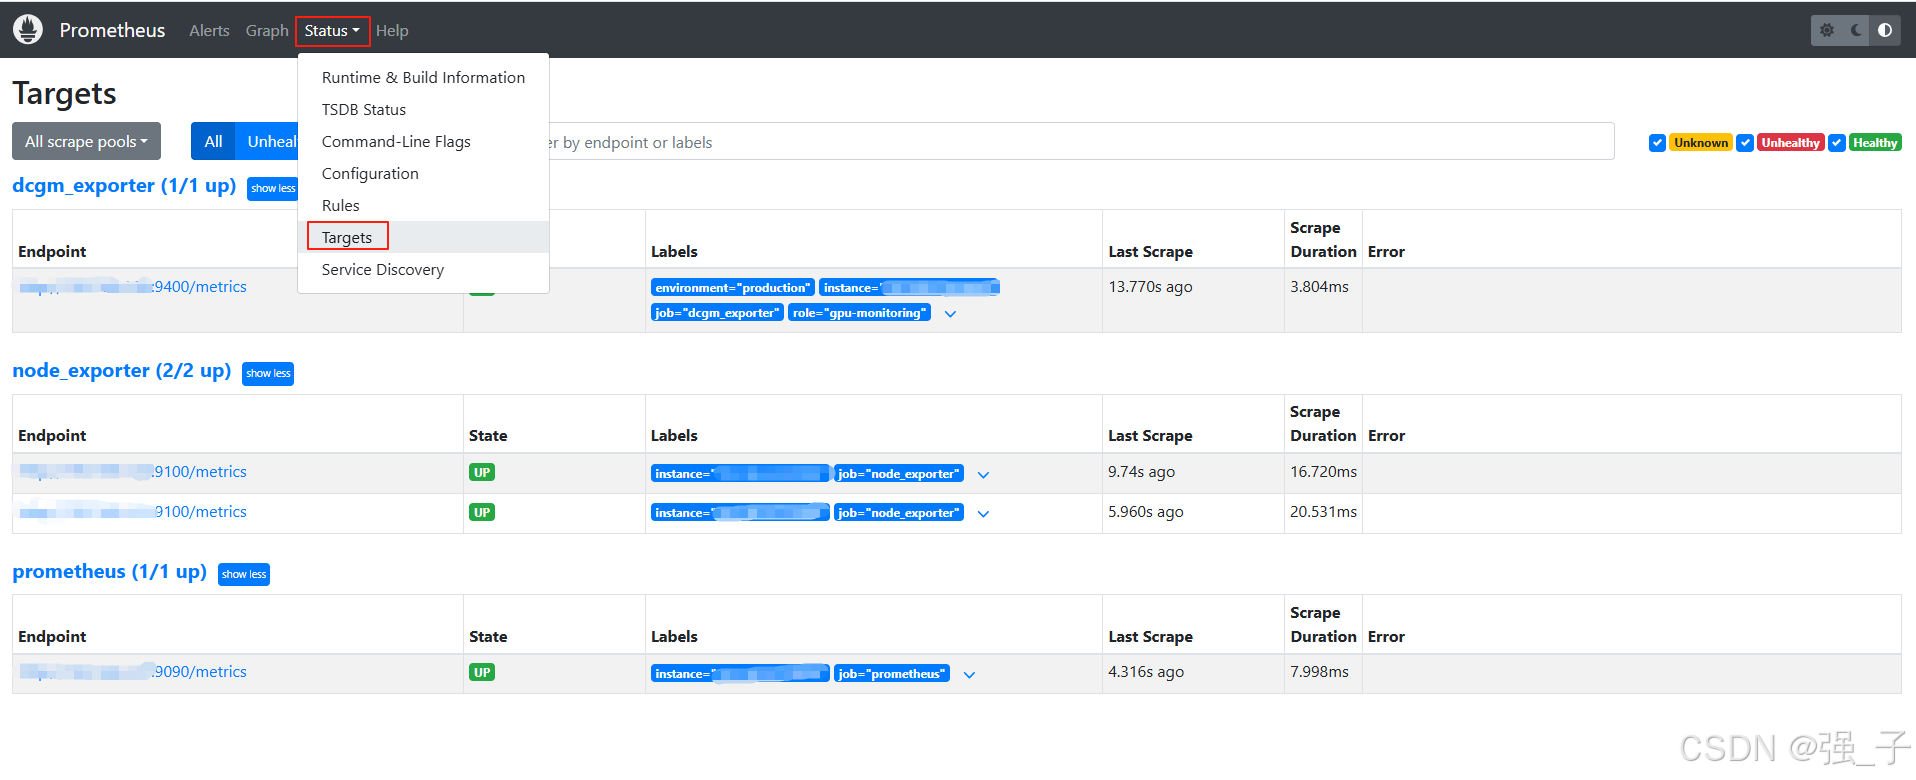
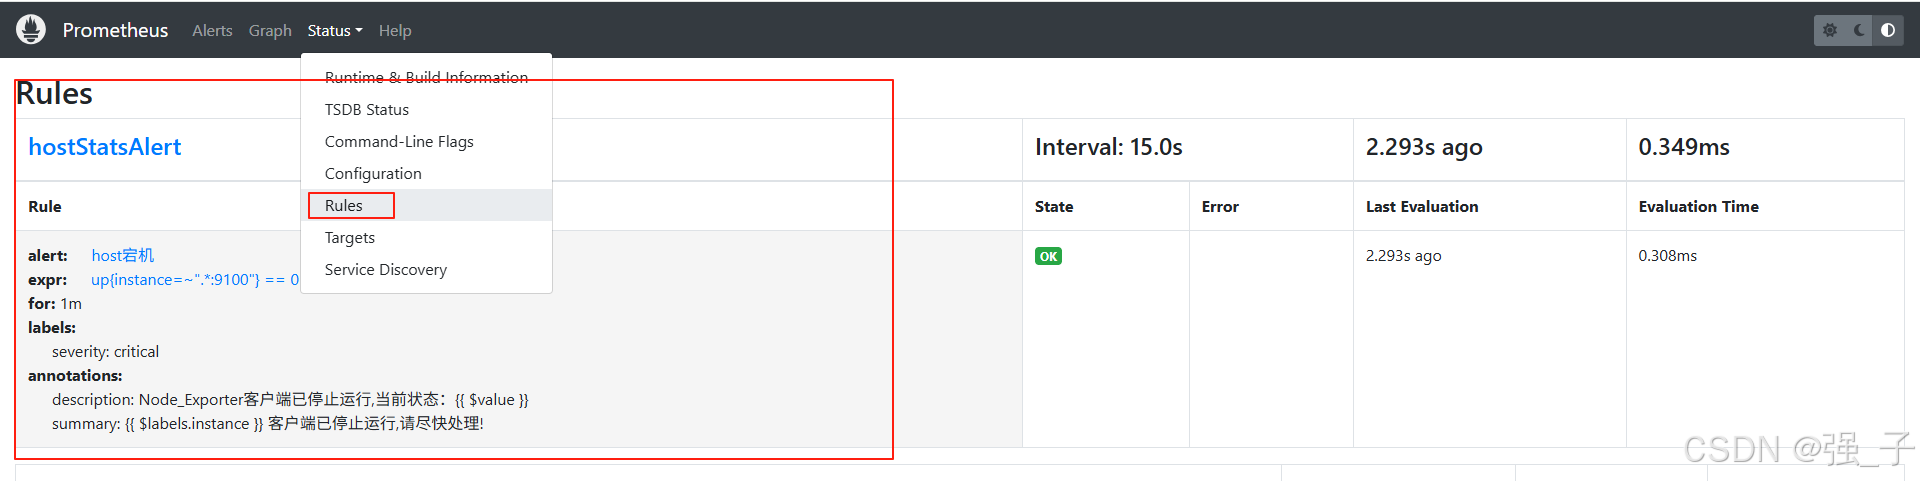
查询报警规则:
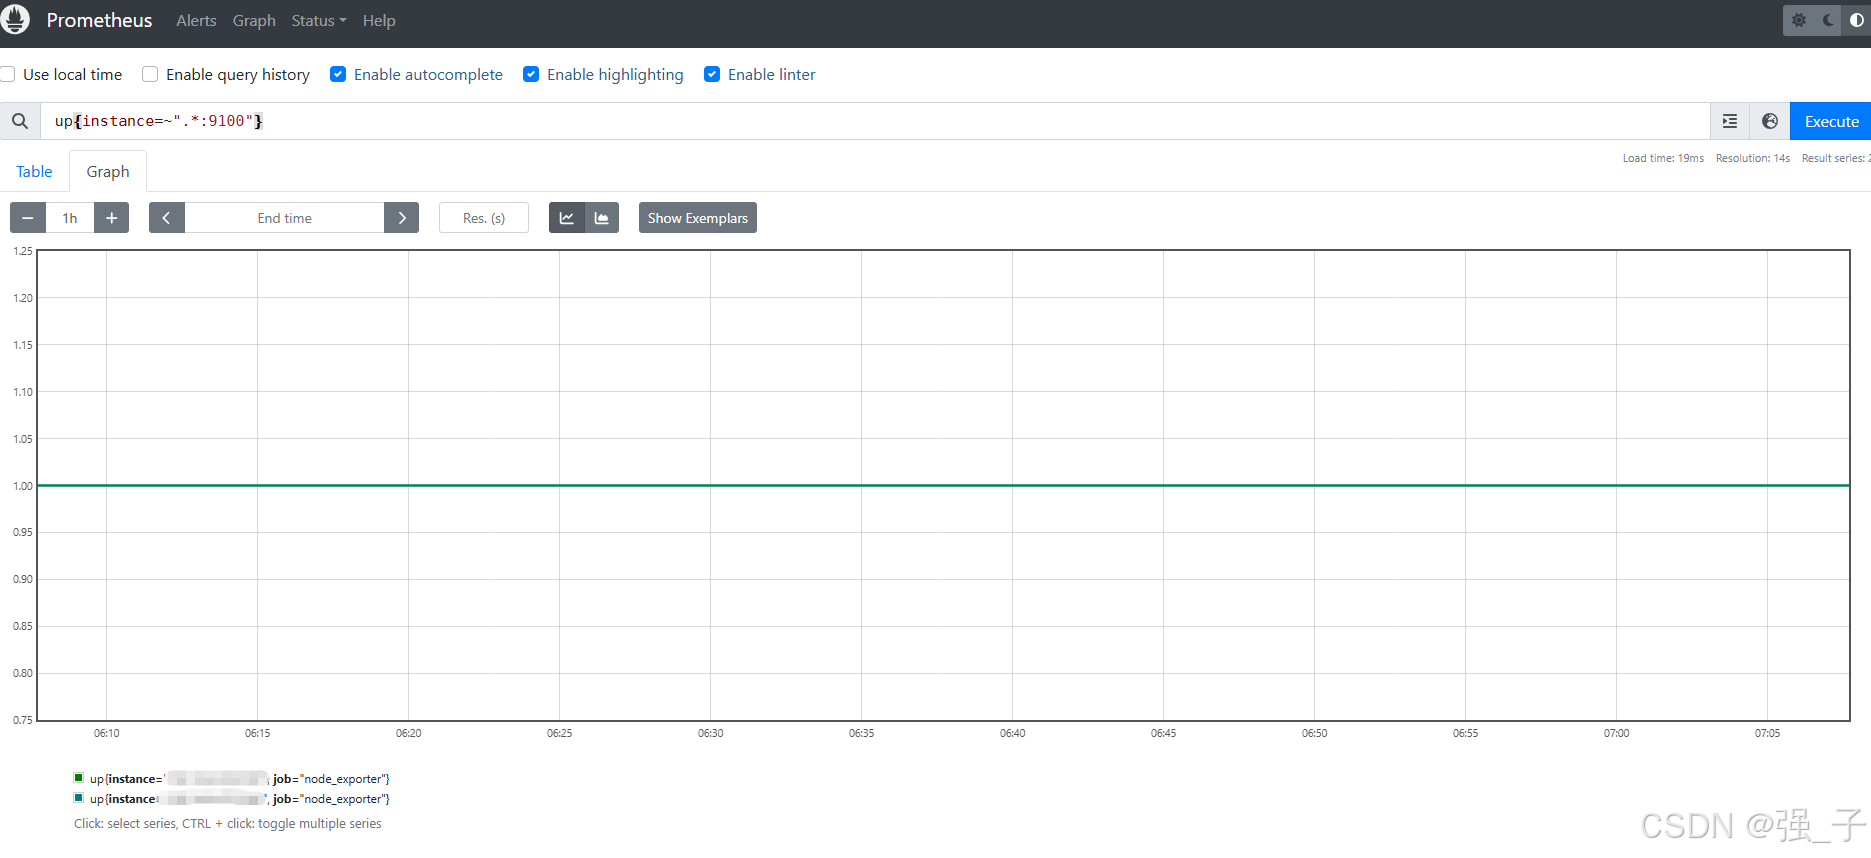
使用PromQL语句查询数据:
Prometheus查询语法官方文档地址:https://prometheus.io/docs/prometheus/latest/querying/basics/
六、配置热加载(无需重启)
当修改 prometheus.yml 或规则文件后,可发送 reload 请求:
curl -X POST http://localhost:9090/-/reload
注意: 需在 docker-compose.yml 中启用 --web.enable-lifecycle