ElasticStack日志平台
目录
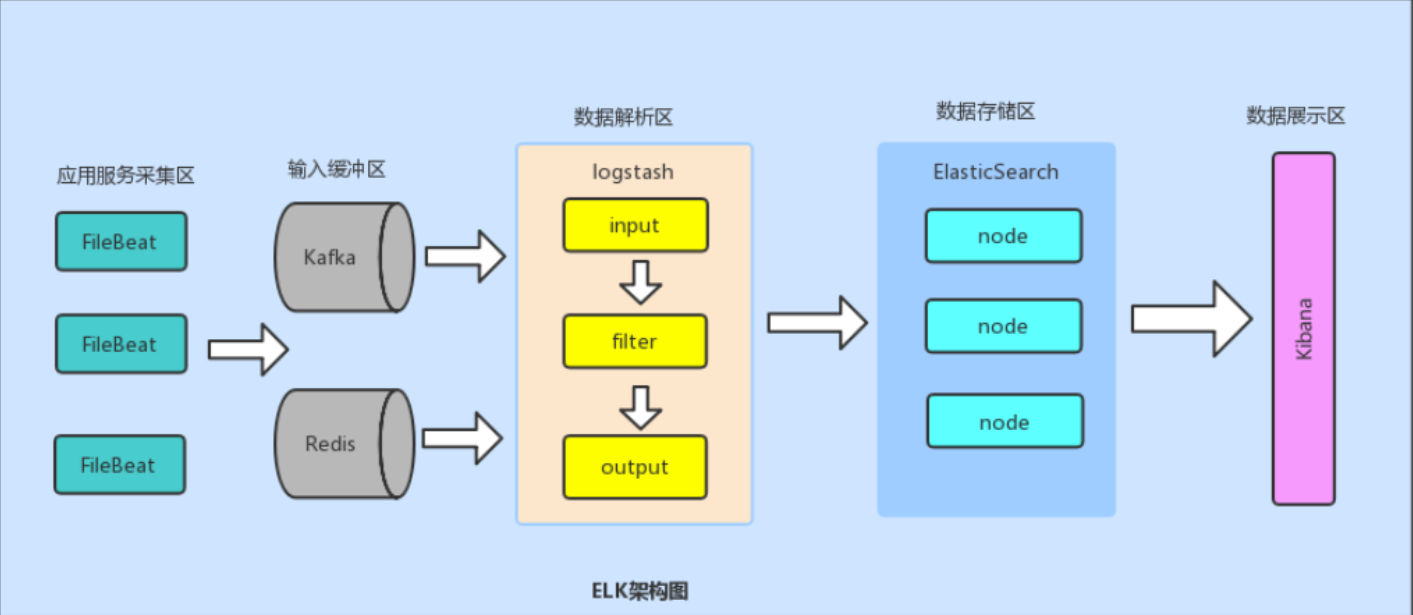
1. 全架构图
编辑
2. 测试节点
3. 本次测试架构图
二、Filebeat
1. 二进制安装
2. filebeat使用
2.1 测试
2.2 修改filebeat本身日志默认位置
3.日志搜集模块总览
3.2 示例一:收集nginx日志
3.3 示例二:收集apache日志
三、Logstash
1. 安装
2. 测试运行
3. 配置输入与输出
4. 常用的过滤器插件
4.1 Grok过滤器插件
4.2 Mutate过滤器插件
5. 使用Geoip插件定位ip地理位置
编辑
编辑
编辑
6. 配置接收 Beats 的输入
6.1 配置
6.2 测试
四、Elasticsearch
1. 二进制安装
2. 环境配置
3. 集群部署【以es01为例,其他两台操作一致】
3.1 安装
3.2 配置环境变量
3.3 创建存储数据和存放证书的目录
3.4 签发证书
3.5 设置集群多节点HTTP证书
3.6 分发证书
3.7 修改配置
3.8 启动集群
3.9 浏览器访问:
3.10 添加扩展程序
五、Kibana
1. 设置es集群kibana账户的密码(es1上操作)
2. 安装kibana
3. 修改kibana配置
4. 创建运行用户
5. 启动kibana
6. 浏览器测试
六、搭建ELK集群
1. 修改Logstash配置文件
2. 启动filebeat和logstash
3. 测试
4. 创建索引
1. 全架构图
2. 测试节点
3. 本次测试架构图
| IP 地址 | 主机名(服务) |
|---|---|
| 172.17.16.178 | filebeat |
| 172.17.16.176 | logstash |
| 172.17.16.172 | es1 |
| 172.17.16.175 | es2 |
| 172.17.16.174 | es3 |
| 172.17.16.173 | kibana |
ELK + Filebeat 架构图(数据流向)
+-----------+ +-------------+ +--------------+ +-------------+
| Servers | ---> | Filebeat | ---> | Logstash | ---> | Elasticsearch |
| (Nginx, | | (日志收集) | | (日志过滤/解析) | | (日志存储+检索) |
| Tomcat等) | +-------------+ +--------------+ +-------------+
|
v
+-------------+
| Kibana |
| (日志展示) |
+-------------+
二、Filebeat
Download Filebeat | Elastic![]() https://www.elastic.co/cn/downloads/beats/filebeat
https://www.elastic.co/cn/downloads/beats/filebeat
1. 二进制安装
# 安装
[root@filebeat01 /]# wget https://artifacts.elastic.co/downloads/beats/filebeat/filebeat-8.15.0-linux-x86_64.tar.gz
[root@filebeat01 /]# tar -xvzf filebeat-8.15.0-linux-x86_64.tar.gz[root@filebeat01 /]# mv filebeat-8.15.0-linux-x86_64 /usr/local/filebeat
[root@filebeat01 /]# ls /usr/local/filebeat
fields.yml  filebeat  filebeat.reference.yml  filebeat.yml  kibana  LICENSE.txt  module  modules.d  NOTICE.txt  README.md# 配置systemd方式的Filebeat启动管理文件
[root@filebeat01 filebeat]# vim /usr/lib/systemd/system/filebeat.service
[root@filebeat01 filebeat]# cat /usr/lib/systemd/system/filebeat.service
[Unit]
Description=Filebeat sends log files to Logstash or directly to Elasticsearch.
Wants=network-online.target
After=network-online.target[Service]ExecStart=/usr/local/filebeat/filebeat -c /usr/local/filebeat/filebeat.yml
Restart=always[Install]
WantedBy=multi-user.target[root@filebeat01 filebeat]# systemctl daemon-reload [root@filebeat01 filebeat]# systemctl status filebeat.service
○ filebeat.service - Filebeat sends log files to Logstash or directly to Elasticsearch.Loaded: loaded (/usr/lib/systemd/system/filebeat.service; disabled; preset: disabled)Active: inactive (dead)# 启动filebeat
[root@filebeat01 filebeat]# systemctl start filebeat.service
[root@filebeat01 filebeat]# systemctl status filebeat.service
● filebeat.service - Filebeat sends log files to Logstash or directly to Elasticsearch.Loaded: loaded (/usr/lib/systemd/system/filebeat.service; disabled; preset: disabled)Active: active (running) since Tue 2025-11-04 17:38:29 CST; 1s agoMain PID: 1623 (filebeat)Tasks: 8 (limit: 5628)Memory: 39.6MCPU: 70msCGroup: /system.slice/filebeat.service└─1623 /usr/local/filebeat/filebeat -c /usr/local/filebeat/filebeat.ymlNov 04 17:38:29 filebeat01 systemd[1]: Started Filebeat sends log files to Logstash or directly to Elasticsearch..
[root@filebeat01 filebeat]#
2. filebeat使用
2.1 测试
[root@filebeat01 filebeat]# cat /tmp/access.log
123.127.39.50 - - [04/Mar/2021:10:50:28 +0800] "GET /logo.jpg HTTP/1.1" 200 14137 "http://81.68.233.173/" "Mozilla/5.0 (Macintosh; Intel Mac OS X 10_13_6) AppleWebKit/537.36 (KHTML, like Gecko) Chrome/88.0.4324.192 Safari/537.36" "-"[root@filebeat01 filebeat]# ls
data  fields.yml  filebeat  filebeat.reference.yml  filebeat.yml  kibana  LICENSE.txt  logs  module  modules.d  NOTICE.txt  README.md
[root@filebeat01 filebeat]# vim filebeat.yml
[root@filebeat01 filebeat]# sed "/^.*#/d;/^$/d" filebeat.yml
filebeat.inputs:
- type: filestreamid: my-filestream-idenabled: true        # false改为truepaths:- /tmp/access.log  # 指定需要收集日志的路径,支持通配符可以写多个
filebeat.config.modules:path: ${path.config}/modules.d/*.ymlreload.enabled: false
setup.template.settings:index.number_of_shards: 1
setup.kibana:
output.console:       # 输出到终端即屏幕上pretty: true
processors:- add_host_metadata:when.not.contains.tags: forwarded- add_cloud_metadata: ~- add_docker_metadata: ~- add_kubernetes_metadata: ~# 运行并观察输出
[root@filebeat01 filebeat]# ./filebeat -c filebeat.yml
{"@timestamp": "2025-11-06T03:33:10.428Z","@metadata": {"beat": "filebeat","type": "_doc","version": "8.15.0"},"agent": {"version": "8.15.0","ephemeral_id": "1c7f37c6-b198-491c-8edd-b2da442e8f99","id": "d4bb3eb5-f86d-4c43-b354-6f5efacfd907","name": "filebeat01","type": "filebeat"},"message": "123.127.39.50 - - [04/Mar/2021:10:50:28 +0800] \"GET /logo.jpg HTTP/1.1\" 200 14137 \"http://81.68.233.173/\" \"Mozilla/5.0 (Macintosh; Intel Mac OS X 10_13_6) AppleWebKit/537.36 (KHTML, like Gecko) Chrome/88.0.4324.192 Safari/537.36\" \"-\"","log": {"offset": 0,"file": {"inode": "9091058","path": "/tmp/access.log","device_id": "64768"}},"input": {"type": "filestream"},"ecs": {"version": "8.0.0"},"host": {"os": {"name": "CentOS Stream","kernel": "5.14.0-592.el9.x86_64","type": "linux","platform": "centos","version": "9","family": "redhat"},"id": "04b2658c610b41d0a825d34297cc9d1e","containerized": false,"ip": ["192.168.159.144","fe80::20c:29ff:feb9:1239"],"mac": ["00-0C-29-B9-12-39"],"name": "filebeat01","hostname": "filebeat01","architecture": "x86_64"}
}
2.2 修改filebeat本身日志默认位置
[root@filebeat01 logs]# grep -C 5 "Logging" /usr/local/filebeat/filebeat.yml when.not.contains.tags: forwarded- add_cloud_metadata: ~- add_docker_metadata: ~- add_kubernetes_metadata: ~# ================================== Logging ===================================# Sets log level. The default log level is info.
# Available log levels are: error, warning, info, debug
#logging.level: debug
path.logs: /var/log  # 修改filebeat本身运行日志默认位置# 查看修改之前的filebeat本身日志默认位置
[root@filebeat01 logs]# pwd
/usr/local/filebeat/logs
[root@filebeat01 logs]# ls
filebeat-20251104-1.ndjson  filebeat-20251104-2.ndjson  filebeat-20251104.ndjson  filebeat-20251106-1.ndjson  filebeat-20251106.ndjson# 重启服务使配置生效
[root@filebeat01 logs]# systemctl restart filebeat.service # 验证
[root@filebeat01 logs]# ls /var/log
anaconda  cron             filebeat-20251106.ndjson  maillog   README   vmware-network.1.log  vmware-vgauthsvc.log.0
audit     dnf.librepo.log  firewalld                 messages  secure   vmware-network.2.log  vmware-vmsvc-root.log
btmp      dnf.log          hawkey.log                nginx     spooler  vmware-network.3.log  vmware-vmtoolsd-root.log
chrony    dnf.rpm.log      lastlog                   private   sssd     vmware-network.log    wtmp
3.日志搜集模块总览
[root@filebeat01 filebeat]# pwd
/usr/local/filebeat# 模块配置文件存储位置
[root@filebeat01 filebeat]# ls modules.d/
activemq.yml.disabled       fortinet.yml.disabled          mongodb.yml.disabled          rabbitmq.yml.disabled
apache.yml.disabled         gcp.yml.disabled               mssql.yml.disabled            redis.yml.disabled
auditd.yml.disabled         google_workspace.yml.disabled  mysqlenterprise.yml.disabled  salesforce.yml.disabled
awsfargate.yml.disabled     haproxy.yml.disabled           mysql.yml.disabled            santa.yml.disabled
aws.yml.disabled            ibmmq.yml.disabled             nats.yml.disabled             snyk.yml.disabled
azure.yml.disabled          icinga.yml.disabled            netflow.yml.disabled          sophos.yml.disabled
cef.yml.disabled            iis.yml.disabled               nginx.yml.disabled            suricata.yml.disabled
checkpoint.yml.disabled     iptables.yml.disabled          o365.yml.disabled             system.yml.disabled
cisco.yml.disabled          juniper.yml.disabled           okta.yml.disabled             threatintel.yml.disabled
coredns.yml.disabled        kafka.yml.disabled             oracle.yml.disabled           traefik.yml.disabled
crowdstrike.yml.disabled    kibana.yml.disabled            osquery.yml.disabled          zeek.yml.disabled
cyberarkpas.yml.disabled    logstash.yml.disabled          panw.yml.disabled             zookeeper.yml.disabled
elasticsearch.yml.disabled  microsoft.yml.disabled         pensando.yml.disabled         zoom.yml.disabled
envoyproxy.yml.disabled     misp.yml.disabled              postgresql.yml.disabled# 查看可启用的模块列表
[root@filebeat01 filebeat]# ./filebeat modules list
Enabled:Disabled:
activemq
apache
auditd
aws
awsfargate
azure
cef
checkpoint
cisco
coredns
crowdstrike
cyberarkpas
elasticsearch
envoyproxy
fortinet
gcp
google_workspace
haproxy
ibmmq
icinga
iis
iptables
juniper
kafka
kibana
logstash
microsoft
misp
mongodb
mssql
mysql
mysqlenterprise
nats
netflow
nginx
o365
okta
oracle
osquery
panw
pensando
postgresql
rabbitmq
redis
salesforce
santa
snyk
sophos
suricata
system
threatintel
traefik
zeek
zookeeper
zoom# 启用nginx日志收集模块
[root@filebeat01 filebeat]# ./filebeat modules enable nginx
Enabled nginx
[root@filebeat01 filebeat]# ./filebeat modules list
Enabled:
nginxDisabled:
activemq
apache
auditd
aws
awsfargate
azure
cef
checkpoint
cisco
……
3.2 示例一:收集nginx日志
# 查看nginx的默认日志存放路径
[root@filebeat01 ~]# egrep "access_log|error_log" /etc/nginx/nginx.conf
error_log /var/log/nginx/error.log;access_log  /var/log/nginx/access.log  main;# 修改nginx日志收集模块的配置文件
[root@filebeat01 filebeat]# vim modules.d/nginx.yml
[root@filebeat01 filebeat]# sed "/^$/d;/^.*#/d" modules.d/nginx.yml
- module: nginxaccess:enabled: truevar.paths:- /var/log/nginx/access.logerror:enabled: truevar.paths:- /var/log/nginx/error.logingress_controller:enabled: false# 另开一终端
[root@filebeat01 filebeat]# curl 127.1
[root@filebeat01 filebeat]# curl 127.1/zhuzhuxia# 原终端测试
[root@filebeat01 filebeat]# ./filebeat -c filebeat.yml # 仅输出完整Json数据中的某些字段
[root@filebeat01 filebeat]# vim filebeat.yml
[root@filebeat01 filebeat]# grep -C 2 "codec.format" filebeat.yml
output.console:pretty: truecodec.format:string: '%{[@timestamp]} %{[message]}'#测试
[root@filebeat01 ~]# curl 127.1/zhuzhuxia
[root@filebeat01 ~]# curl 127.1/# 注意下面是第二个终端显示
[root@filebeat01 filebeat]# ./filebeat -c filebeat.yml
2025-11-06T06:46:57.463Z 127.0.0.1 - - [06/Nov/2025:14:46:38 +0800] "GET /zhuzhuxia HTTP/1.1" 404 3971 "-" "curl/7.76.1" "-"
2025-11-06T06:46:57.463Z 2025/11/06 14:46:38 [error] 933#933: *6 open() "/usr/share/nginx/html/zhuzhuxia" failed (2: No such file or directory), client: 127.0.0.1, server: _, request: "GET /zhuzhuxia HTTP/1.1", host: "127.1"
2025-11-06T06:48:05.473Z 127.0.0.1 - - [06/Nov/2025:14:48:04 +0800] "GET / HTTP/1.1" 200 2713881 "-" "curl/7.76.1" "-"
3.3 示例二:收集apache日志
# 查看apache日志默认路径
[root@filebeat02 logs]# grep -E "CustomLog|ErrorLog" /etc/httpd/conf/httpd.conf | grep -v "^.*#"
ErrorLog "logs/error_log"CustomLog "logs/access_log" combined[root@filebeat02 logs]# pwd
/etc/httpd/logs
[root@filebeat02 logs]# ls
access_log  error_log----------------------------------------------------------------------------[root@filebeat02 ~]# cd /usr/local/filebeat/
[root@filebeat02 filebeat]# vim filebeat.yml
[root@filebeat02 filebeat]# sed "/^$/d;/^.*#/d" filebeat.yml
filebeat.inputs:
- type: filestreamid: my-filestream-idenabled: truepaths:- /var/log/*.log
filebeat.config.modules:path: ${path.config}/modules.d/*.ymlreload.enabled: false
setup.template.settings:index.number_of_shards: 1
setup.kibana:
output.console:codec.format:string: '%{[@timestamp]} %{[message]}'
processors:- add_host_metadata:when.not.contains.tags: forwarded- add_cloud_metadata: ~- add_docker_metadata: ~- add_kubernetes_metadata: ~# 启用apache日志收集模块
[root@filebeat02 filebeat]# ./filebeat modules enable apache
Enabled apache# 配置apache日志收集模块的配置文件
[root@filebeat02 filebeat]# vim modules.d/a
activemq.yml.disabled    auditd.yml.disabled      aws.yml.disabled
apache.yml               awsfargate.yml.disabled  azure.yml.disabled
[root@filebeat02 filebeat]# vim modules.d/apache.yml
[root@filebeat02 filebeat]# sed "/^$/d;/^.*#/d" modules.d/apache.yml
- module: apacheaccess:enabled: truevar.paths:- /etc/httpd/logs/access_logerror:enabled: truevar.paths:- /etc/httpd/logs/error_log# 终端一
[root@filebeat02 ~]# curl 127.1
[root@filebeat02 ~]# curl 127.1/HelloWorld# 终端二
[root@filebeat02 filebeat]# ./filebeat -c filebeat.yml
2025-11-06T07:28:10.302Z 127.0.0.1 - - [06/Nov/2025:15:27:30 +0800] "GET / HTTP/1.1" 400 226 "-" "curl/7.76.1"
2025-11-06T07:29:08.309Z 127.0.0.1 - - [06/Nov/2025:15:29:07 +0800] "GET /HelloWorld HTTP/1.1" 400 226 "-" "curl/7.76.1"
三、Logstash
1. 安装
[root@logstash /]# curl -OL https://artifacts.elastic.co/downloads/logstash/logstash-8.15.0-linux-x86_64.tar.gz
[root@logstash /]# tar -xzf logstash-8.15.0-linux-x86_64.tar.gz
var
[root@logstash /]# mv logstash-8.15.0 /usr/local/logstash[root@logstash /]# ls /usr/local/logstash/
bin     CONTRIBUTORS  Gemfile       jdk          lib          logstash-core             modules     tools   x-pack
config  data          Gemfile.lock  JDK_VERSION  LICENSE.txt  logstash-core-plugin-api  NOTICE.TXT  vendor# 更新java环境
[root@logstash logstash]# vim /etc/profile
[root@logstash logstash]# tail -n 3  /etc/profile
JAVA_HOME=/usr/local/logstash/jdk
PATH=$JAVA_HOME/bin:$PATH
export JAVA_HOME PATH[root@logstash logstash]# source /etc/profile[root@logstash logstash]# java --version
openjdk 21.0.4 2024-07-16 LTS
OpenJDK Runtime Environment Temurin-21.0.4+7 (build 21.0.4+7-LTS)
OpenJDK 64-Bit Server VM Temurin-21.0.4+7 (build 21.0.4+7-LTS, mixed mode, sharing)
2. 测试运行
[root@logstash logstash]# ./bin/logstash -e ''
Using bundled JDK: /usr/local/logstash/jdk
Sending Logstash logs to /usr/local/logstash/logs which is now configured via log4j2.properties
[2025-11-06T14:35:05,476][INFO ][logstash.runner          ] Log4j configuration path used is: /usr/local/logstash/config/log4j2.properties
[2025-11-06T14:35:05,479][WARN ][logstash.runner          ] The use of JAVA_HOME has been deprecated. Logstash 8.0 and later ignores JAVA_HOME and uses the bundled JDK. Running Logstash with the bundled JDK is recommended. The bundled JDK has been verified to work with each specific version of Logstash, and generally provides best performance and reliability. If you have compelling reasons for using your own JDK (organizational-specific compliance requirements, for example), you can configure LS_JAVA_HOME to use that version instead.
[2025-11-06T14:35:05,481][INFO ][logstash.runner          ] Starting Logstash {"logstash.version"=>"8.15.0", "jruby.version"=>"jruby 9.4.8.0 (3.1.4) 2024-07-02 4d41e55a67 OpenJDK 64-Bit Server VM 21.0.4+7-LTS on 21.0.4+7-LTS +indy +jit [x86_64-linux]"}
[2025-11-06T14:35:05,483][INFO ][logstash.runner          ] JVM bootstrap flags: [-Xms1g, -Xmx1g, -Djava.awt.headless=true, -Dfile.encoding=UTF-8, -Djruby.compile.invokedynamic=true, -XX:+HeapDumpOnOutOfMemoryError, -Djava.security.egd=file:/dev/urandom, -Dlog4j2.isThreadContextMapInheritable=true, -Dlogstash.jackson.stream-read-constraints.max-string-length=200000000, -Dlogstash.jackson.stream-read-constraints.max-number-length=10000, -Djruby.regexp.interruptible=true, -Djdk.io.File.enableADS=true, --add-exports=jdk.compiler/com.sun.tools.javac.api=ALL-UNNAMED, --add-exports=jdk.compiler/com.sun.tools.javac.file=ALL-UNNAMED, --add-exports=jdk.compiler/com.sun.tools.javac.parser=ALL-UNNAMED, --add-exports=jdk.compiler/com.sun.tools.javac.tree=ALL-UNNAMED, --add-exports=jdk.compiler/com.sun.tools.javac.util=ALL-UNNAMED, --add-opens=java.base/java.security=ALL-UNNAMED, --add-opens=java.base/java.io=ALL-UNNAMED, --add-opens=java.base/java.nio.channels=ALL-UNNAMED, --add-opens=java.base/sun.nio.ch=ALL-UNNAMED, --add-opens=java.management/sun.management=ALL-UNNAMED, -Dio.netty.allocator.maxOrder=11]
[2025-11-06T14:35:05,486][INFO ][logstash.runner          ] Jackson default value override `logstash.jackson.stream-read-constraints.max-string-length` configured to `200000000`
[2025-11-06T14:35:05,486][INFO ][logstash.runner          ] Jackson default value override `logstash.jackson.stream-read-constraints.max-number-length` configured to `10000`
[2025-11-06T14:35:05,490][INFO ][logstash.settings        ] Creating directory {:setting=>"path.queue", :path=>"/usr/local/logstash/data/queue"}
[2025-11-06T14:35:05,491][INFO ][logstash.settings        ] Creating directory {:setting=>"path.dead_letter_queue", :path=>"/usr/local/logstash/data/dead_letter_queue"}
[2025-11-06T14:35:05,738][WARN ][logstash.config.source.multilocal] Ignoring the 'pipelines.yml' file because modules or command line options are specified
[2025-11-06T14:35:05,753][INFO ][logstash.agent           ] No persistent UUID file found. Generating new UUID {:uuid=>"11e8e5cc-3a99-4e5c-8a52-246f92eebf61", :path=>"/usr/local/logstash/data/uuid"}
[2025-11-06T14:35:06,040][INFO ][logstash.agent           ] Successfully started Logstash API endpoint {:port=>9600, :ssl_enabled=>false}
[2025-11-06T14:35:06,147][INFO ][org.reflections.Reflections] Reflections took 62 ms to scan 1 urls, producing 138 keys and 481 values
[2025-11-06T14:35:06,269][INFO ][logstash.javapipeline    ] Pipeline `main` is configured with `pipeline.ecs_compatibility: v8` setting. All plugins in this pipeline will default to `ecs_compatibility => v8` unless explicitly configured otherwise.
[2025-11-06T14:35:06,290][INFO ][logstash.javapipeline    ][main] Starting pipeline {:pipeline_id=>"main", "pipeline.workers"=>4, "pipeline.batch.size"=>125, "pipeline.batch.delay"=>50, "pipeline.max_inflight"=>500, "pipeline.sources"=>["config string"], :thread=>"#<Thread:0x10c96784 /usr/local/logstash/logstash-core/lib/logstash/java_pipeline.rb:134 run>"}
[2025-11-06T14:35:06,644][INFO ][logstash.javapipeline    ][main] Pipeline Java execution initialization time {"seconds"=>0.35}
[2025-11-06T14:35:06,661][INFO ][logstash.javapipeline    ][main] Pipeline started {"pipeline.id"=>"main"}
The stdin plugin is now waiting for input:
[2025-11-06T14:35:06,677][INFO ][logstash.agent           ] Pipelines running {:count=>1, :running_pipelines=>[:main], :non_running_pipelines=>[]}
hello
{"@timestamp" => 2025-11-06T06:37:37.198940911Z,"@version" => "1","type" => "stdin","message" => "hello","event" => {"original" => "hello"},"host" => {"hostname" => "logstash"}
}# 修改type的值为nginx的示例
[root@logstash logstash]# ./bin/logstash -e "input { stdin { type => nginx } } output { stdout { codec => rubydebug } }"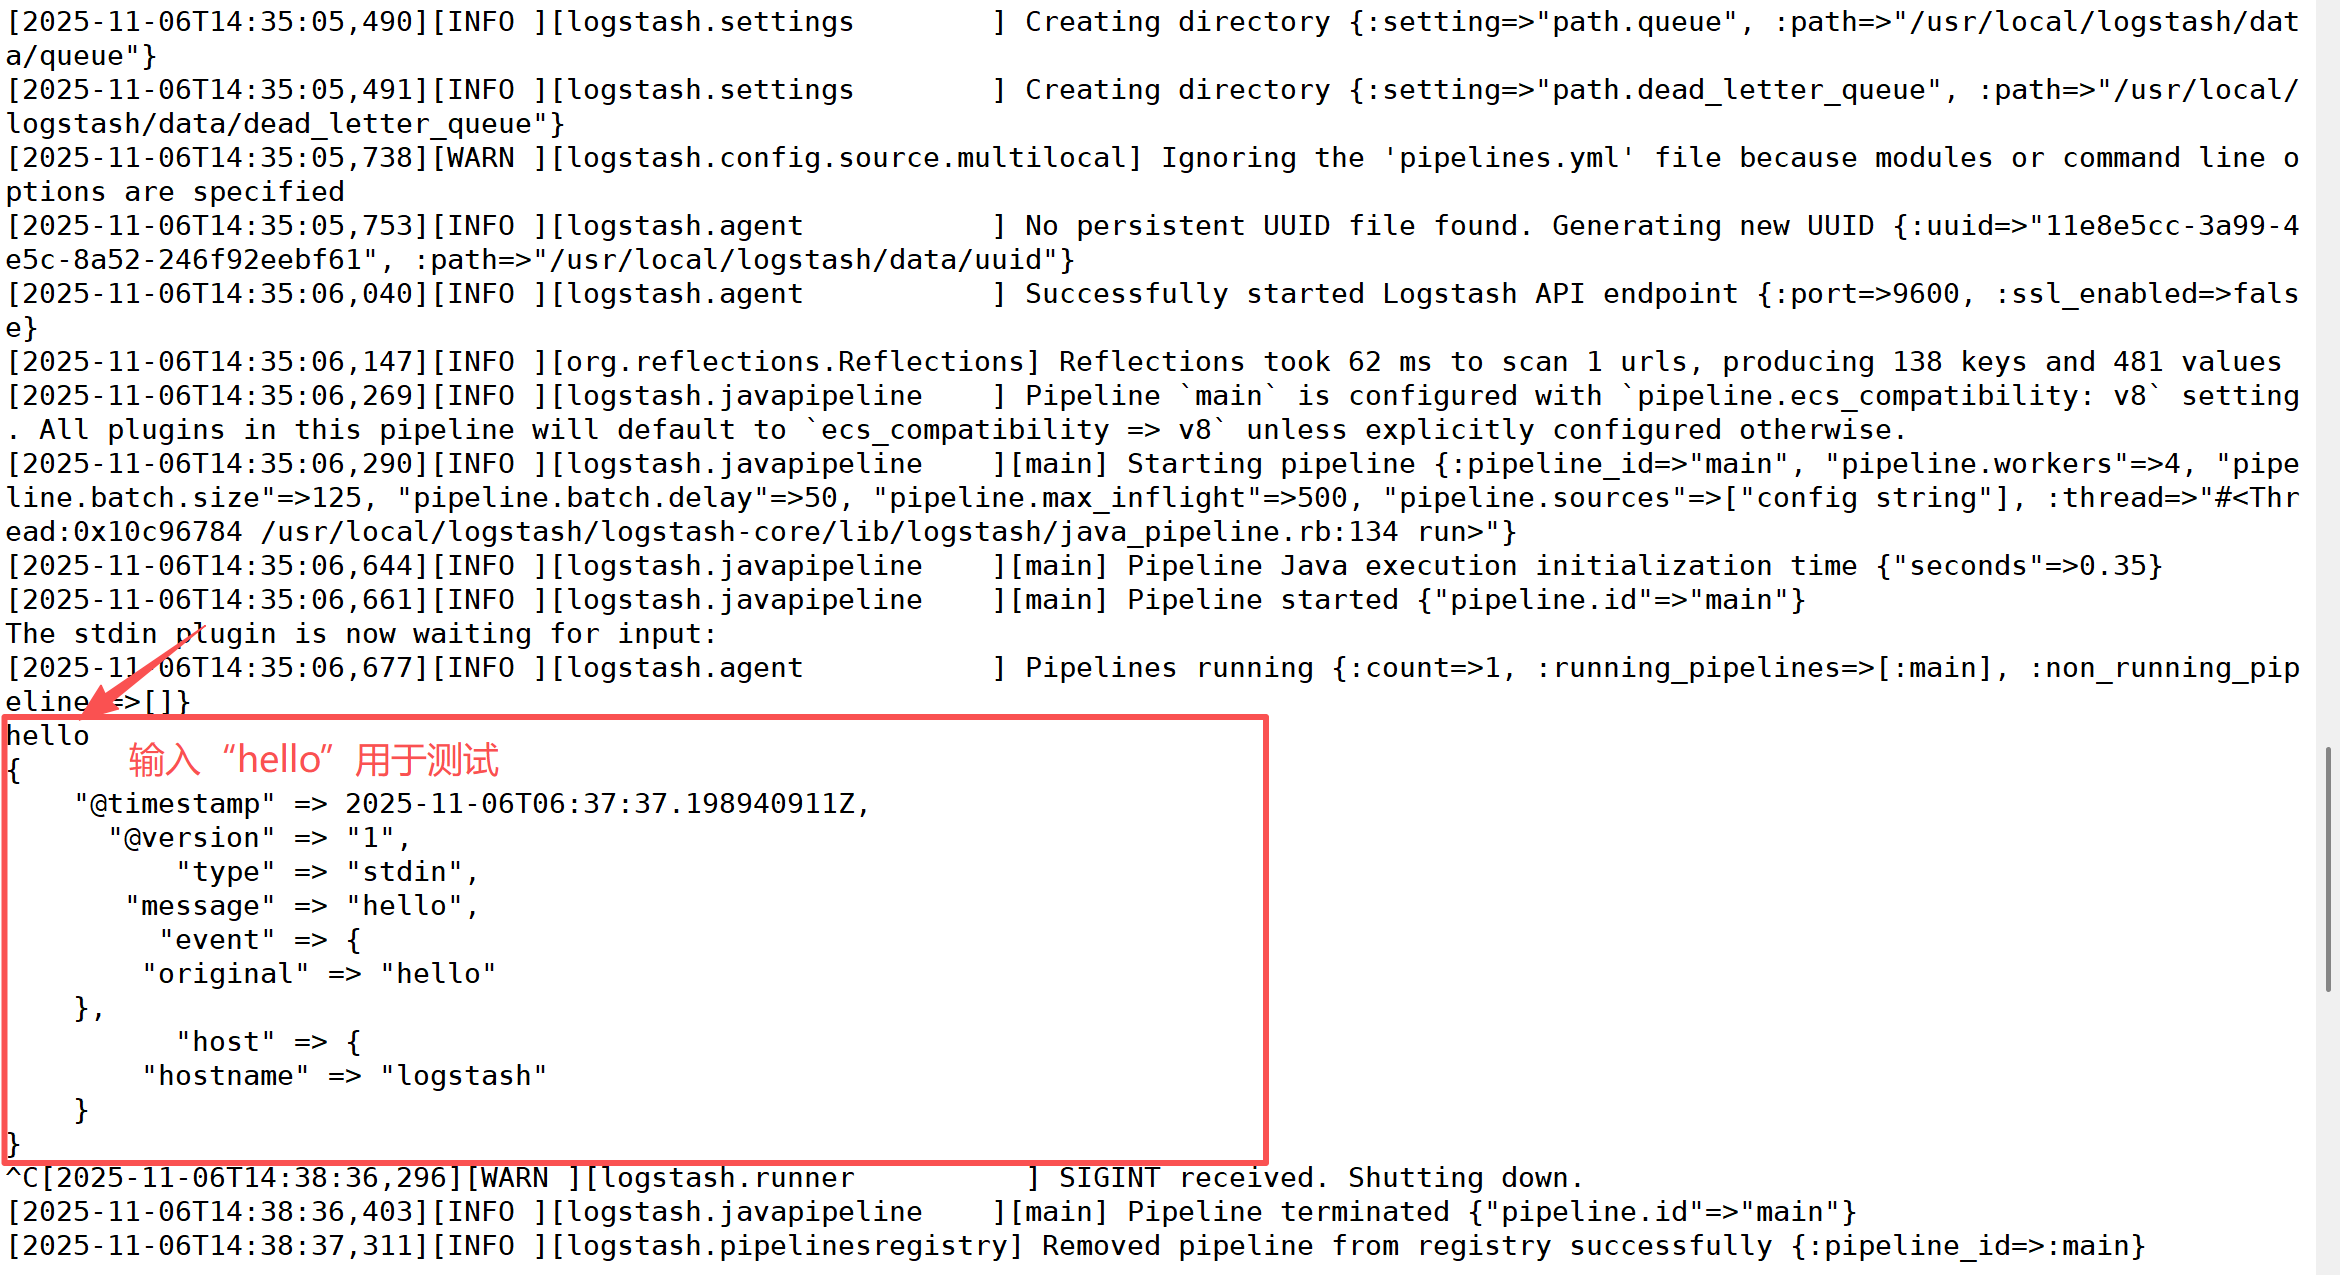
解析:
message字段对应的值是 Logstash 接收到的一行完整的数据
@version是版本信息,可以用于建立索引使用
@timestamp处理此数据的时间戳,可以用于建立索引和搜索
type就是之前input中设置的值,这个值可以任意修改,但是,type是内置的变量,不能修改,用于建立索引和条件判断等
hosts表示从那个主机过来的数据修改
type的值为nginx的示例(主要是区分索引的时候用,这里改了之后没实质效果
3. 配置输入与输出
[root@logstash config]# pwd
/usr/local/logstash/config
[root@logstash config]# vim first_pipeline.conf
[root@logstash config]# cat first_pipeline.conf
input {stdin {}
}
output {stdout {}
}# 检测语法【注意:文件要写绝对路径!即/usr/local/logstash/config/first_pipeline.conf】
[root@logstash config]# /usr/local/logstash/bin/logstash -f /usr/local/logstash/config/first_pipeline.conf --config.test_and_exit
Using bundled JDK: /usr/local/logstash/jdk
Sending Logstash logs to /usr/local/logstash/logs which is now configured via log4j2.properties
[2025-11-06T16:11:07,927][INFO ][logstash.runner          ] Log4j configuration path used is: /usr/local/logstash/config/log4j2.properties
[2025-11-06T16:11:07,930][WARN ][logstash.runner          ] The use of JAVA_HOME has been deprecated. Logstash 8.0 and later ignores JAVA_HOME and uses the bundled JDK. Running Logstash with the bundled JDK is recommended. The bundled JDK has been verified to work with each specific version of Logstash, and generally provides best performance and reliability. If you have compelling reasons for using your own JDK (organizational-specific compliance requirements, for example), you can configure LS_JAVA_HOME to use that version instead.
[2025-11-06T16:11:07,931][INFO ][logstash.runner          ] Starting Logstash {"logstash.version"=>"8.15.0", "jruby.version"=>"jruby 9.4.8.0 (3.1.4) 2024-07-02 4d41e55a67 OpenJDK 64-Bit Server VM 21.0.4+7-LTS on 21.0.4+7-LTS +indy +jit [x86_64-linux]"}
[2025-11-06T16:11:07,933][INFO ][logstash.runner          ] JVM bootstrap flags: [-Xms1g, -Xmx1g, -Djava.awt.headless=true, -Dfile.encoding=UTF-8, -Djruby.compile.invokedynamic=true, -XX:+HeapDumpOnOutOfMemoryError, -Djava.security.egd=file:/dev/urandom, -Dlog4j2.isThreadContextMapInheritable=true, -Dlogstash.jackson.stream-read-constraints.max-string-length=200000000, -Dlogstash.jackson.stream-read-constraints.max-number-length=10000, -Djruby.regexp.interruptible=true, -Djdk.io.File.enableADS=true, --add-exports=jdk.compiler/com.sun.tools.javac.api=ALL-UNNAMED, --add-exports=jdk.compiler/com.sun.tools.javac.file=ALL-UNNAMED, --add-exports=jdk.compiler/com.sun.tools.javac.parser=ALL-UNNAMED, --add-exports=jdk.compiler/com.sun.tools.javac.tree=ALL-UNNAMED, --add-exports=jdk.compiler/com.sun.tools.javac.util=ALL-UNNAMED, --add-opens=java.base/java.security=ALL-UNNAMED, --add-opens=java.base/java.io=ALL-UNNAMED, --add-opens=java.base/java.nio.channels=ALL-UNNAMED, --add-opens=java.base/sun.nio.ch=ALL-UNNAMED, --add-opens=java.management/sun.management=ALL-UNNAMED, -Dio.netty.allocator.maxOrder=11]
[2025-11-06T16:11:07,935][INFO ][logstash.runner          ] Jackson default value override `logstash.jackson.stream-read-constraints.max-string-length` configured to `200000000`
[2025-11-06T16:11:07,935][INFO ][logstash.runner          ] Jackson default value override `logstash.jackson.stream-read-constraints.max-number-length` configured to `10000`
[2025-11-06T16:11:08,161][WARN ][logstash.config.source.multilocal] Ignoring the 'pipelines.yml' file because modules or command line options are specified
[2025-11-06T16:11:08,274][INFO ][org.reflections.Reflections] Reflections took 54 ms to scan 1 urls, producing 138 keys and 481 values
[2025-11-06T16:11:08,388][INFO ][logstash.javapipeline    ] Pipeline `main` is configured with `pipeline.ecs_compatibility: v8` setting. All plugins in this pipeline will default to `ecs_compatibility => v8` unless explicitly configured otherwise.
Configuration OK
[2025-11-06T16:11:08,389][INFO ][logstash.runner          ] Using config.test_and_exit mode. Config Validation Result: OK. Exiting Logstash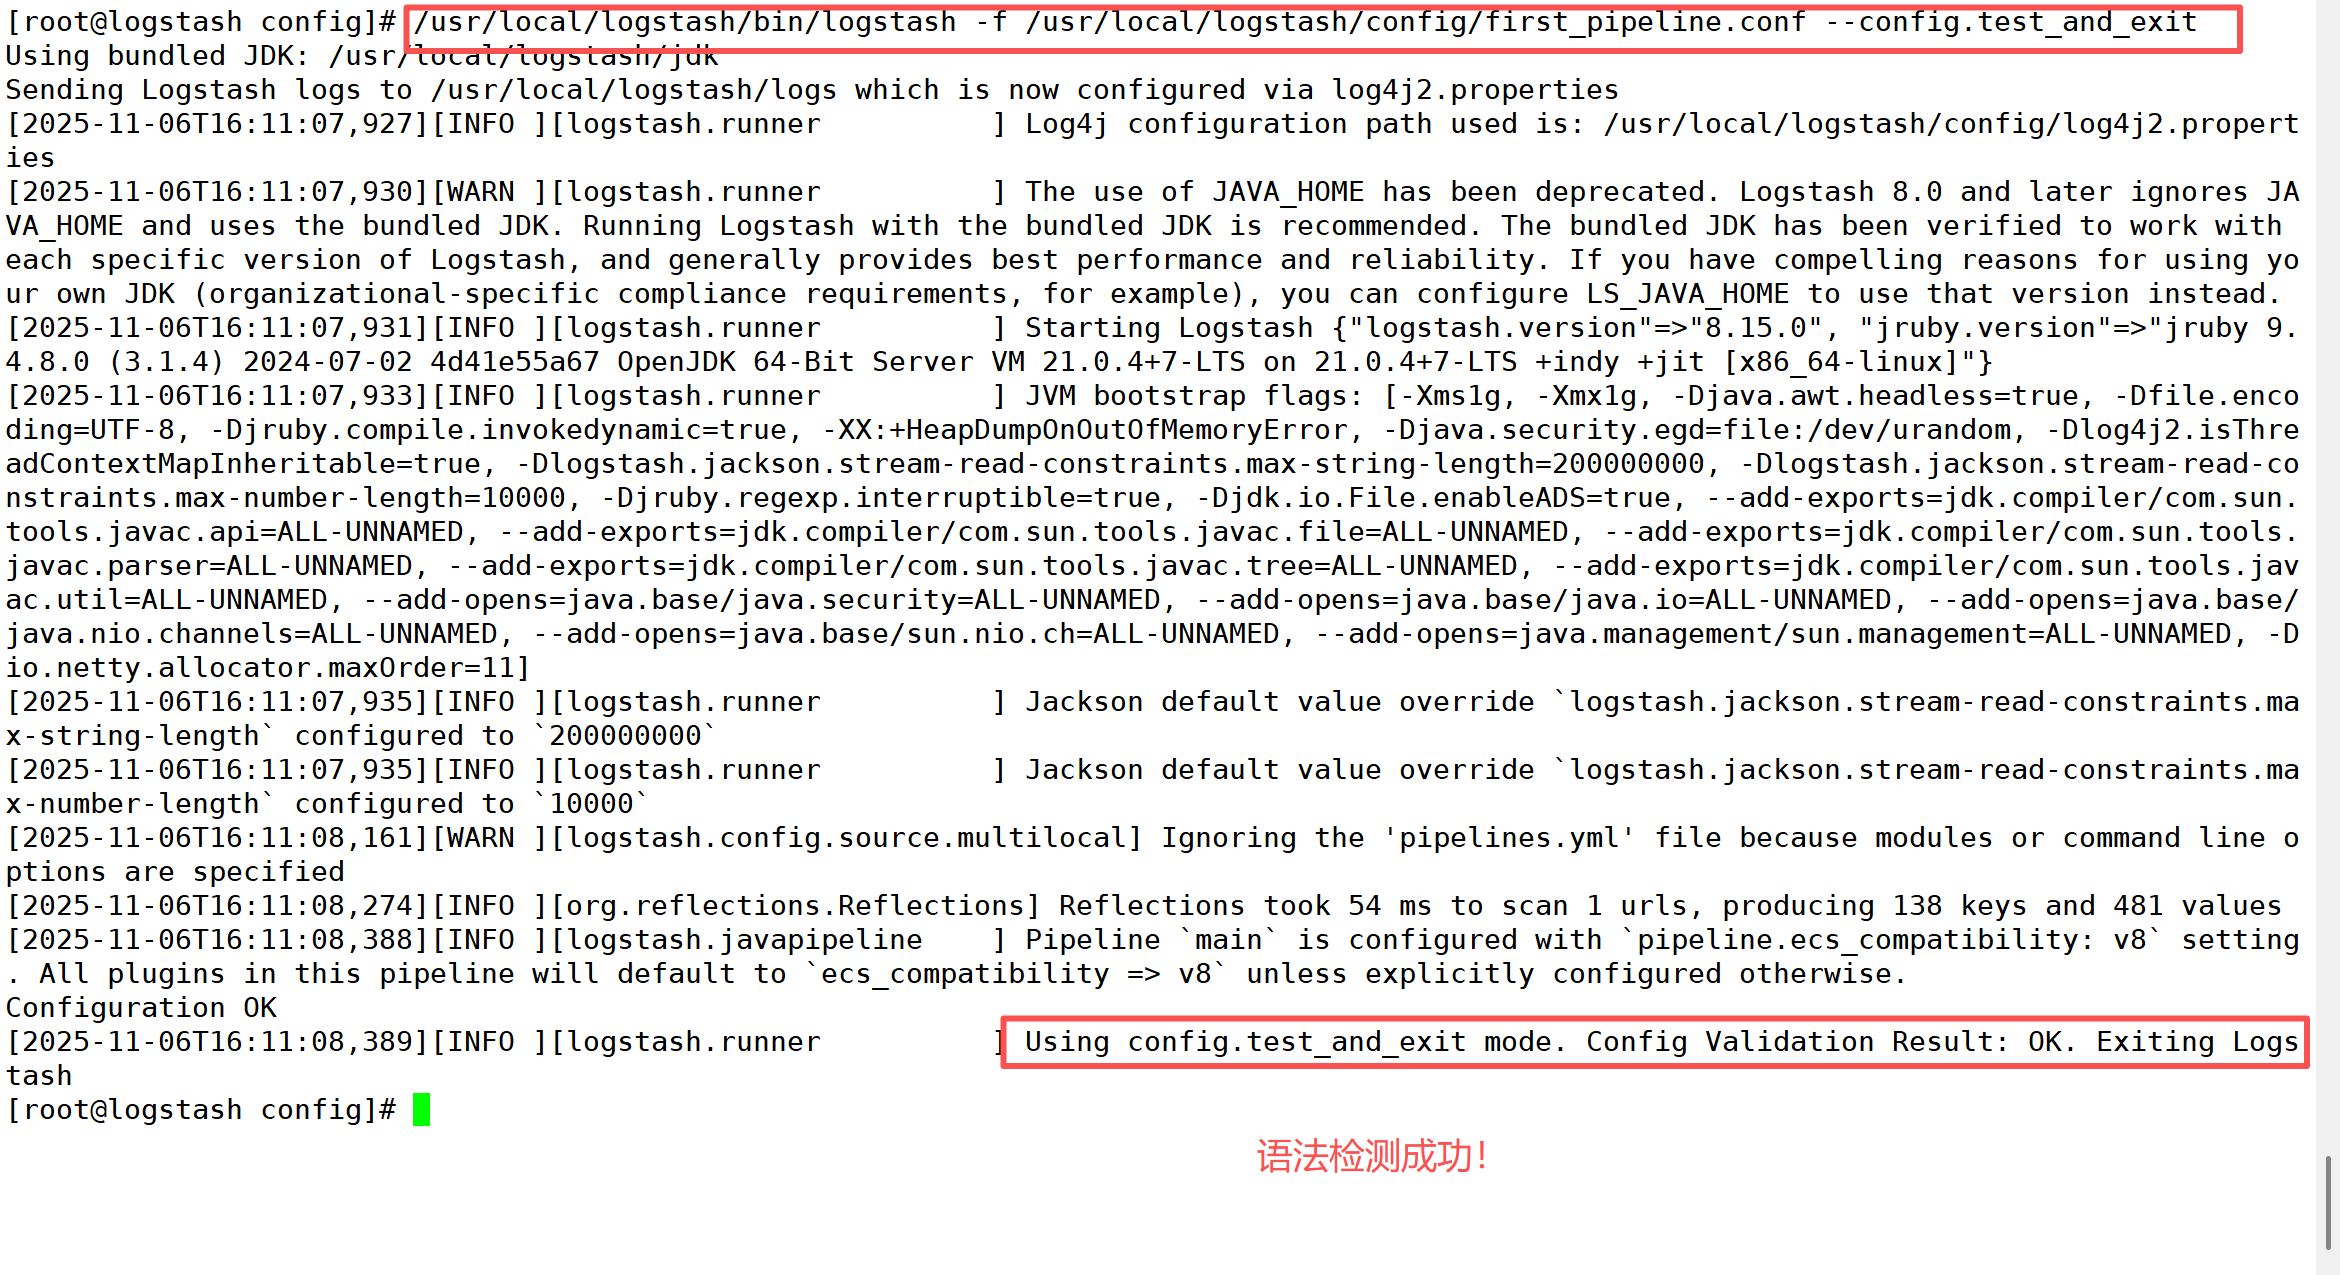
4. 常用的过滤器插件
4.1 Grok过滤器插件
现在有了一个工作管道,但是日志消息的格式不是理想的。你想解析日志消息,以便能从日志中创建特定的命名字段。为此,应使用grok 过滤器插件,可以将非结构化日志数据解析为结构化和可查询的内容。
grok 会根据你感兴趣的内容分配字段名称,并把这些内容和对应的字段名称进行绑定。
grok 如何知道哪些内容是你感兴趣的呢?它是通过自己预定义的模式来识别感兴趣的字段的。可以通过给其配置不同的模式来实现。
这里使用的模式是
%{COMBINEDAPACHELOG}
# 创建测试示例日志文件
[root@logstash ~]# vim /var/log/httpd.log# 确保没有缓存数据
[root@logstash ~]# ls /usr/local/logstash/data/plugins/inputs/file
ls: cannot access '/usr/local/logstash/data/plugins/inputs/file': No such file or directory# 修改管道配置文件
[root@logstash ~]# vim /usr/local/logstash/config/second.conf
[root@logstash ~]# cat /usr/local/logstash/config/second.conf
input {file {path => ["/var/log/httpd.log"]start_position => "beginning"}
}filter {grok {match => { "message" => "%{COMBINEDAPACHELOG}" }}}output {stdout {}
}# 验证
[root@logstash ~]# cd /usr/local/logstash/
[root@logstash logstash]# ./bin/logstash -f /usr/local/logstash/config/second.conf
Using bundled JDK: /usr/local/logstash/jdk
Sending Logstash logs to /usr/local/logstash/logs which is now configured via log4j2.properties
[2025-11-06T17:34:37,146][INFO ][logstash.runner          ] Log4j configuration path used is: /usr/local/logstash/config/log4j2.properties
[2025-11-06T17:34:37,149][WARN ][logstash.runner          ] The use of JAVA_HOME has been deprecated. Logstash 8.0 and later ignores JAVA_HOME and uses the bundled JDK. Running Logstash with the bundled JDK is recommended. The bundled JDK has been verified to work with each specific version of Logstash, and generally provides best performance and reliability. If you have compelling reasons for using your own JDK (organizational-specific compliance requirements, for example), you can configure LS_JAVA_HOME to use that version instead.
[2025-11-06T17:34:37,150][INFO ][logstash.runner          ] Starting Logstash {"logstash.version"=>"8.15.0", "jruby.version"=>"jruby 9.4.8.0 (3.1.4) 2024-07-02 4d41e55a67 OpenJDK 64-Bit Server VM 21.0.4+7-LTS on 21.0.4+7-LTS +indy +jit [x86_64-linux]"}
[2025-11-06T17:34:37,153][INFO ][logstash.runner          ] JVM bootstrap flags: [-Xms1g, -Xmx1g, -Djava.awt.headless=true, -Dfile.encoding=UTF-8, -Djruby.compile.invokedynamic=true, -XX:+HeapDumpOnOutOfMemoryError, -Djava.security.egd=file:/dev/urandom, -Dlog4j2.isThreadContextMapInheritable=true, -Dlogstash.jackson.stream-read-constraints.max-string-length=200000000, -Dlogstash.jackson.stream-read-constraints.max-number-length=10000, -Djruby.regexp.interruptible=true, -Djdk.io.File.enableADS=true, --add-exports=jdk.compiler/com.sun.tools.javac.api=ALL-UNNAMED, --add-exports=jdk.compiler/com.sun.tools.javac.file=ALL-UNNAMED, --add-exports=jdk.compiler/com.sun.tools.javac.parser=ALL-UNNAMED, --add-exports=jdk.compiler/com.sun.tools.javac.tree=ALL-UNNAMED, --add-exports=jdk.compiler/com.sun.tools.javac.util=ALL-UNNAMED, --add-opens=java.base/java.security=ALL-UNNAMED, --add-opens=java.base/java.io=ALL-UNNAMED, --add-opens=java.base/java.nio.channels=ALL-UNNAMED, --add-opens=java.base/sun.nio.ch=ALL-UNNAMED, --add-opens=java.management/sun.management=ALL-UNNAMED, -Dio.netty.allocator.maxOrder=11]
[2025-11-06T17:34:37,155][INFO ][logstash.runner          ] Jackson default value override `logstash.jackson.stream-read-constraints.max-string-length` configured to `200000000`
[2025-11-06T17:34:37,156][INFO ][logstash.runner          ] Jackson default value override `logstash.jackson.stream-read-constraints.max-number-length` configured to `10000`
[2025-11-06T17:34:37,310][WARN ][logstash.config.source.multilocal] Ignoring the 'pipelines.yml' file because modules or command line options are specified
[2025-11-06T17:34:37,746][INFO ][logstash.agent           ] Successfully started Logstash API endpoint {:port=>9600, :ssl_enabled=>false}
[2025-11-06T17:34:37,885][INFO ][org.reflections.Reflections] Reflections took 76 ms to scan 1 urls, producing 138 keys and 481 values
[2025-11-06T17:34:38,170][INFO ][logstash.javapipeline    ] Pipeline `main` is configured with `pipeline.ecs_compatibility: v8` setting. All plugins in this pipeline will default to `ecs_compatibility => v8` unless explicitly configured otherwise.
[2025-11-06T17:34:38,183][WARN ][logstash.filters.grok    ][main] ECS v8 support is a preview of the unreleased ECS v8, and uses the v1 patterns. When Version 8 of the Elastic Common Schema becomes available, this plugin will need to be updated
[2025-11-06T17:34:38,258][INFO ][logstash.javapipeline    ][main] Starting pipeline {:pipeline_id=>"main", "pipeline.workers"=>4, "pipeline.batch.size"=>125, "pipeline.batch.delay"=>50, "pipeline.max_inflight"=>500, "pipeline.sources"=>["/usr/local/logstash/config/second.conf"], :thread=>"#<Thread:0x2b3dd72a /usr/local/logstash/logstash-core/lib/logstash/java_pipeline.rb:134 run>"}
[2025-11-06T17:34:38,817][INFO ][logstash.javapipeline    ][main] Pipeline Java execution initialization time {"seconds"=>0.56}
[2025-11-06T17:34:38,828][INFO ][logstash.inputs.file     ][main] No sincedb_path set, generating one based on the "path" setting {:sincedb_path=>"/usr/local/logstash/data/plugins/inputs/file/.sincedb_aff270f7990dabcdbd0044eac08398ef", :path=>["/var/log/httpd.log"]}
[2025-11-06T17:34:38,831][INFO ][logstash.javapipeline    ][main] Pipeline started {"pipeline.id"=>"main"}
[2025-11-06T17:34:38,836][INFO ][filewatch.observingtail  ][main][2ca38b4f7564ab662b9dba093b0499d5e8c516bc986027b30920b07d4575462e] START, creating Discoverer, Watch with file and sincedb collections
[2025-11-06T17:34:38,838][INFO ][logstash.agent           ] Pipelines running {:count=>1, :running_pipelines=>[:main], :non_running_pipelines=>[]}
{"event" => {"original" => "83.149.9.216 - - [04/Jan/2015:05:13:42 +0000] \"GET /presentations/logstash-monitorama-2013/imageskibana-search.png HTTP/1.1\" 200 203023 \"http://semicomplete.com/presentations/logstash-monitorama-2013/\" \"Mozilla/5.0 (Macintosh; Intel Mac OS X 10_9_1) AppleWebKit/537.36 (KHTML, like Gecko) Chrome/32.0.1700.77 Safari/537.36\""},"log" => {"file" => {"path" => "/var/log/httpd.log"}},"message" => "83.149.9.216 - - [04/Jan/2015:05:13:42 +0000] \"GET /presentations/logstash-monitorama-2013/imageskibana-search.png HTTP/1.1\" 200 203023 \"http://semicomplete.com/presentations/logstash-monitorama-2013/\" \"Mozilla/5.0 (Macintosh; Intel Mac OS X 10_9_1) AppleWebKit/537.36 (KHTML, like Gecko) Chrome/32.0.1700.77 Safari/537.36\"","@version" => "1","tags" => [[0] "_grokparsefailure"],"@timestamp" => 2025-11-06T09:34:38.868524558Z,"host" => {"name" => "logstash"}
}
4.2 Mutate过滤器插件
# 使用remove_field移除字段 “message”和“@version”, rename重新命名字段“source”。【remove_field可以移除任意的字段,它可以接收的值是一个数组。】[root@logstash logstash]# cat config/second.conf
input {file {path => ["/var/log/httpd.log"]start_position => "beginning"}
}filter {grok {match => { "message" => "%{COMBINEDAPACHELOG}" }}mutate {rename => {"source" => "source_ip"}}mutate {remove_field => ["message","@version"]}}output {stdout {}
}[root@logstash logstash]# ./bin/logstash -f /usr/local/logstash/config/second.conf
Using bundled JDK: /usr/local/logstash/jdk
Sending Logstash logs to /usr/local/logstash/logs which is now configured via log4j2.properties
[2025-11-06T17:49:11,105][INFO ][logstash.runner          ] Log4j configuration path used is: /usr/local/logstash/config/log4j2.properties
[2025-11-06T17:49:11,109][WARN ][logstash.runner          ] The use of JAVA_HOME has been deprecated. Logstash 8.0 and later ignores JAVA_HOME and uses the bundled JDK. Running Logstash with the bundled JDK is recommended. The bundled JDK has been verified to work with each specific version of Logstash, and generally provides best performance and reliability. If you have compelling reasons for using your own JDK (organizational-specific compliance requirements, for example), you can configure LS_JAVA_HOME to use that version instead.
[2025-11-06T17:49:11,109][INFO ][logstash.runner          ] Starting Logstash {"logstash.version"=>"8.15.0", "jruby.version"=>"jruby 9.4.8.0 (3.1.4) 2024-07-02 4d41e55a67 OpenJDK 64-Bit Server VM 21.0.4+7-LTS on 21.0.4+7-LTS +indy +jit [x86_64-linux]"}
[2025-11-06T17:49:11,111][INFO ][logstash.runner          ] JVM bootstrap flags: [-Xms1g, -Xmx1g, -Djava.awt.headless=true, -Dfile.encoding=UTF-8, -Djruby.compile.invokedynamic=true, -XX:+HeapDumpOnOutOfMemoryError, -Djava.security.egd=file:/dev/urandom, -Dlog4j2.isThreadContextMapInheritable=true, -Dlogstash.jackson.stream-read-constraints.max-string-length=200000000, -Dlogstash.jackson.stream-read-constraints.max-number-length=10000, -Djruby.regexp.interruptible=true, -Djdk.io.File.enableADS=true, --add-exports=jdk.compiler/com.sun.tools.javac.api=ALL-UNNAMED, --add-exports=jdk.compiler/com.sun.tools.javac.file=ALL-UNNAMED, --add-exports=jdk.compiler/com.sun.tools.javac.parser=ALL-UNNAMED, --add-exports=jdk.compiler/com.sun.tools.javac.tree=ALL-UNNAMED, --add-exports=jdk.compiler/com.sun.tools.javac.util=ALL-UNNAMED, --add-opens=java.base/java.security=ALL-UNNAMED, --add-opens=java.base/java.io=ALL-UNNAMED, --add-opens=java.base/java.nio.channels=ALL-UNNAMED, --add-opens=java.base/sun.nio.ch=ALL-UNNAMED, --add-opens=java.management/sun.management=ALL-UNNAMED, -Dio.netty.allocator.maxOrder=11]
[2025-11-06T17:49:11,114][INFO ][logstash.runner          ] Jackson default value override `logstash.jackson.stream-read-constraints.max-string-length` configured to `200000000`
[2025-11-06T17:49:11,115][INFO ][logstash.runner          ] Jackson default value override `logstash.jackson.stream-read-constraints.max-number-length` configured to `10000`
[2025-11-06T17:49:11,334][WARN ][logstash.config.source.multilocal] Ignoring the 'pipelines.yml' file because modules or command line options are specified
[2025-11-06T17:49:11,653][INFO ][logstash.agent           ] Successfully started Logstash API endpoint {:port=>9600, :ssl_enabled=>false}
[2025-11-06T17:49:11,831][INFO ][org.reflections.Reflections] Reflections took 59 ms to scan 1 urls, producing 138 keys and 481 values
[2025-11-06T17:49:12,081][INFO ][logstash.javapipeline    ] Pipeline `main` is configured with `pipeline.ecs_compatibility: v8` setting. All plugins in this pipeline will default to `ecs_compatibility => v8` unless explicitly configured otherwise.
[2025-11-06T17:49:12,095][WARN ][logstash.filters.grok    ][main] ECS v8 support is a preview of the unreleased ECS v8, and uses the v1 patterns. When Version 8 of the Elastic Common Schema becomes available, this plugin will need to be updated
[2025-11-06T17:49:12,166][INFO ][logstash.javapipeline    ][main] Starting pipeline {:pipeline_id=>"main", "pipeline.workers"=>4, "pipeline.batch.size"=>125, "pipeline.batch.delay"=>50, "pipeline.max_inflight"=>500, "pipeline.sources"=>["/usr/local/logstash/config/second02.conf"], :thread=>"#<Thread:0x7201a9fb /usr/local/logstash/logstash-core/lib/logstash/java_pipeline.rb:134 run>"}
[2025-11-06T17:49:12,674][INFO ][logstash.javapipeline    ][main] Pipeline Java execution initialization time {"seconds"=>0.51}
[2025-11-06T17:49:12,684][INFO ][logstash.inputs.file     ][main] No sincedb_path set, generating one based on the "path" setting {:sincedb_path=>"/usr/local/logstash/data/plugins/inputs/file/.sincedb_aff270f7990dabcdbd0044eac08398ef", :path=>["/var/log/httpd.log"]}
[2025-11-06T17:49:12,686][INFO ][logstash.javapipeline    ][main] Pipeline started {"pipeline.id"=>"main"}
[2025-11-06T17:49:12,691][INFO ][filewatch.observingtail  ][main][bcabc056a8bc9ef50c8de23b1a49a189aa696f801da7fd4ea1cc162bbcd7dba1] START, creating Discoverer, Watch with file and sincedb collections
[2025-11-06T17:49:12,701][INFO ][logstash.agent           ] Pipelines running {:count=>1, :running_pipelines=>[:main], :non_running_pipelines=>[]}
{"tags" => [[0] "_grokparsefailure"],"log" => {"file" => {"path" => "/var/log/httpd.log"}},"event" => {"original" => ""},"@timestamp" => 2025-11-06T09:49:12.727098892Z,"host" => {"name" => "logstash"}
}
{"user_agent" => {"original" => "Mozilla/5.0 (Macintosh; Intel Mac OS X 10_9_1) AppleWebKit/537.36 (KHTML, like Gecko) Chrome/32.0.1700.77 Safari/537.36"},"timestamp" => "04/Jan/2015:05:13:42 +0000","log" => {"file" => {"path" => "/var/log/httpd.log"}},"http" => {"version" => "1.1","request" => {"referrer" => "http://semicomplete.com/presentations/logstash-monitorama-2013/","method" => "GET"},"response" => {"status_code" => 200,"body" => {"bytes" => 203023}}},"event" => {"original" => "83.149.9.216 - - [04/Jan/2015:05:13:42 +0000] \"GET /presentations/logstash-monitorama-2013/imageskibana-search.png HTTP/1.1\" 200 203023 \"http://semicomplete.com/presentations/logstash-monitorama-2013/\" \"Mozilla/5.0 (Macintosh; Intel Mac OS X 10_9_1) AppleWebKit/537.36 (KHTML, like Gecko) Chrome/32.0.1700.77 Safari/537.36\""},"url" => {"original" => "/presentations/logstash-monitorama-2013/imageskibana-search.png"},"@timestamp" => 2025-11-06T09:49:12.718712826Z,"host" => {"name" => "logstash"},"source_ip" => {"address" => "83.149.9.216"}
}
{"tags" => [[0] "_grokparsefailure"],"log" => {"file" => {"path" => "/var/log/httpd.log"}},"event" => {"original" => ""},"@timestamp" => 2025-11-06T09:49:12.726587058Z,"host" => {"name" => "logstash"}
}
{"user_agent" => {"original" => "Mozilla/5.0 (Macintosh; Intel Mac OS X 10_9_1) AppleWebKit/537.36 (KHTML, like Gecko) Chrome/32.0.1700.77 Safari/537.36"},"timestamp" => "20/Feb/2025:17:47:42 +0000","log" => {"file" => {"path" => "/var/log/httpd.log"}},"http" => {"version" => "1.1","request" => {"referrer" => "http://semicomplete.com/presentations/logstash-monitorama-2013/","method" => "GET"},"response" => {"status_code" => 200,"body" => {"bytes" => 203023}}},"event" => {"original" => "123.119.6.15 - - [20/Feb/2025:17:47:42 +0000] \"GET /presentations/logstash-monitorama-2013/imageskibana-search.png HTTP/1.1\" 200 203023 \"http://semicomplete.com/presentations/logstash-monitorama-2013/\" \"Mozilla/5.0 (Macintosh; Intel Mac OS X 10_9_1) AppleWebKit/537.36 (KHTML, like Gecko) Chrome/32.0.1700.77 Safari/537.36\""},"url" => {"original" => "/presentations/logstash-monitorama-2013/imageskibana-search.png"},"@timestamp" => 2025-11-06T09:49:12.726896286Z,"host" => {"name" => "logstash"},"source_ip" => {"address" => "123.119.6.15"}
}
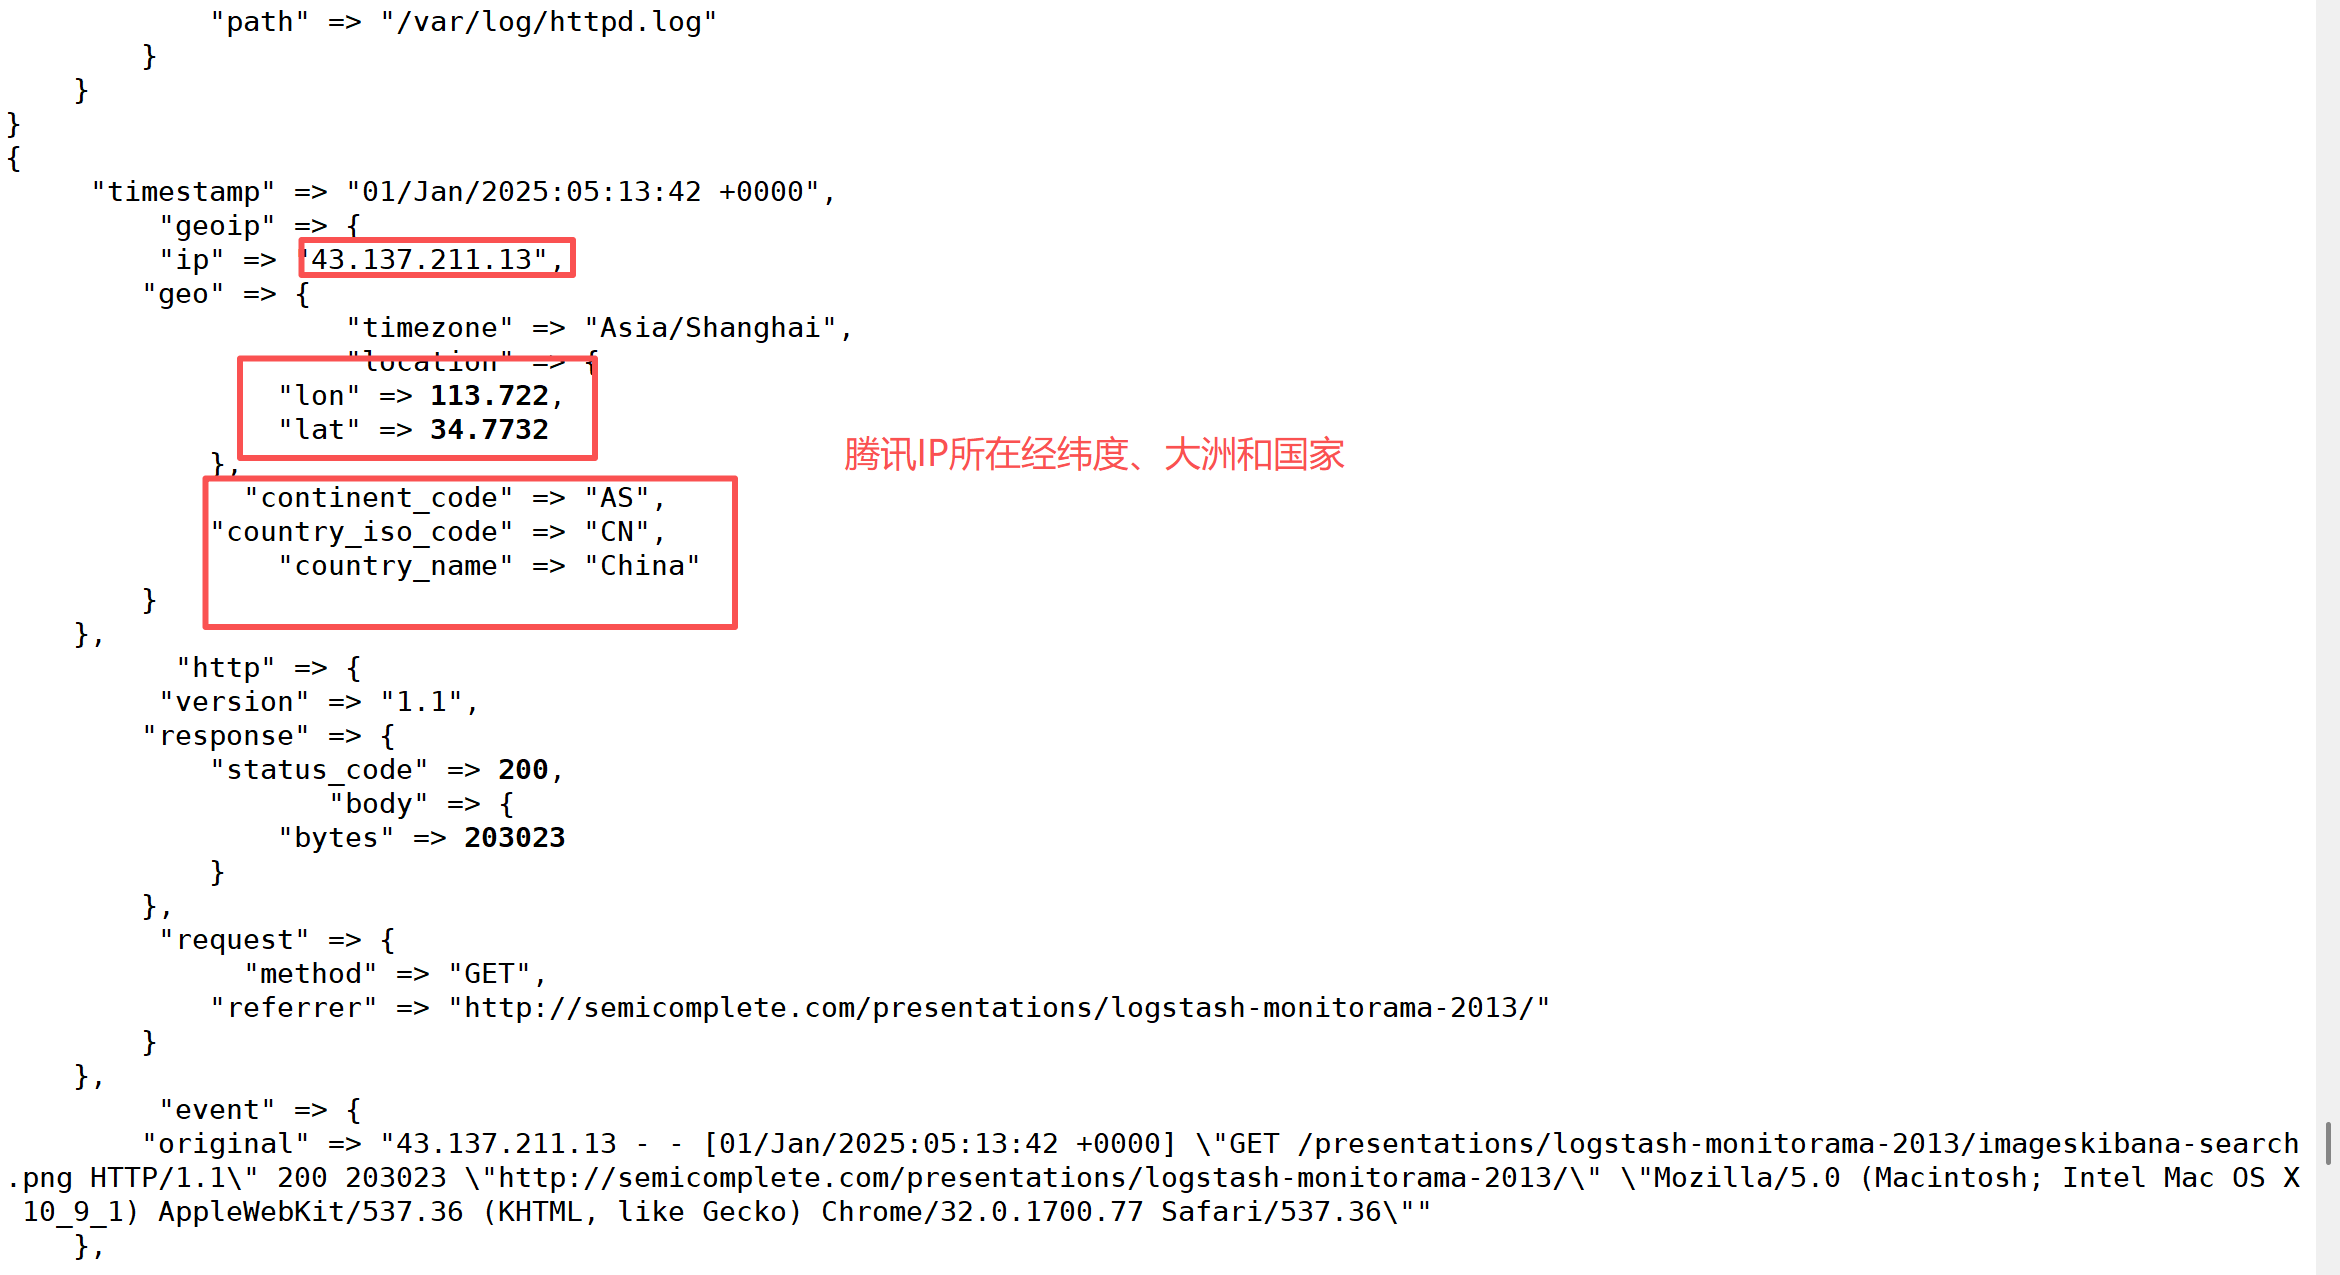
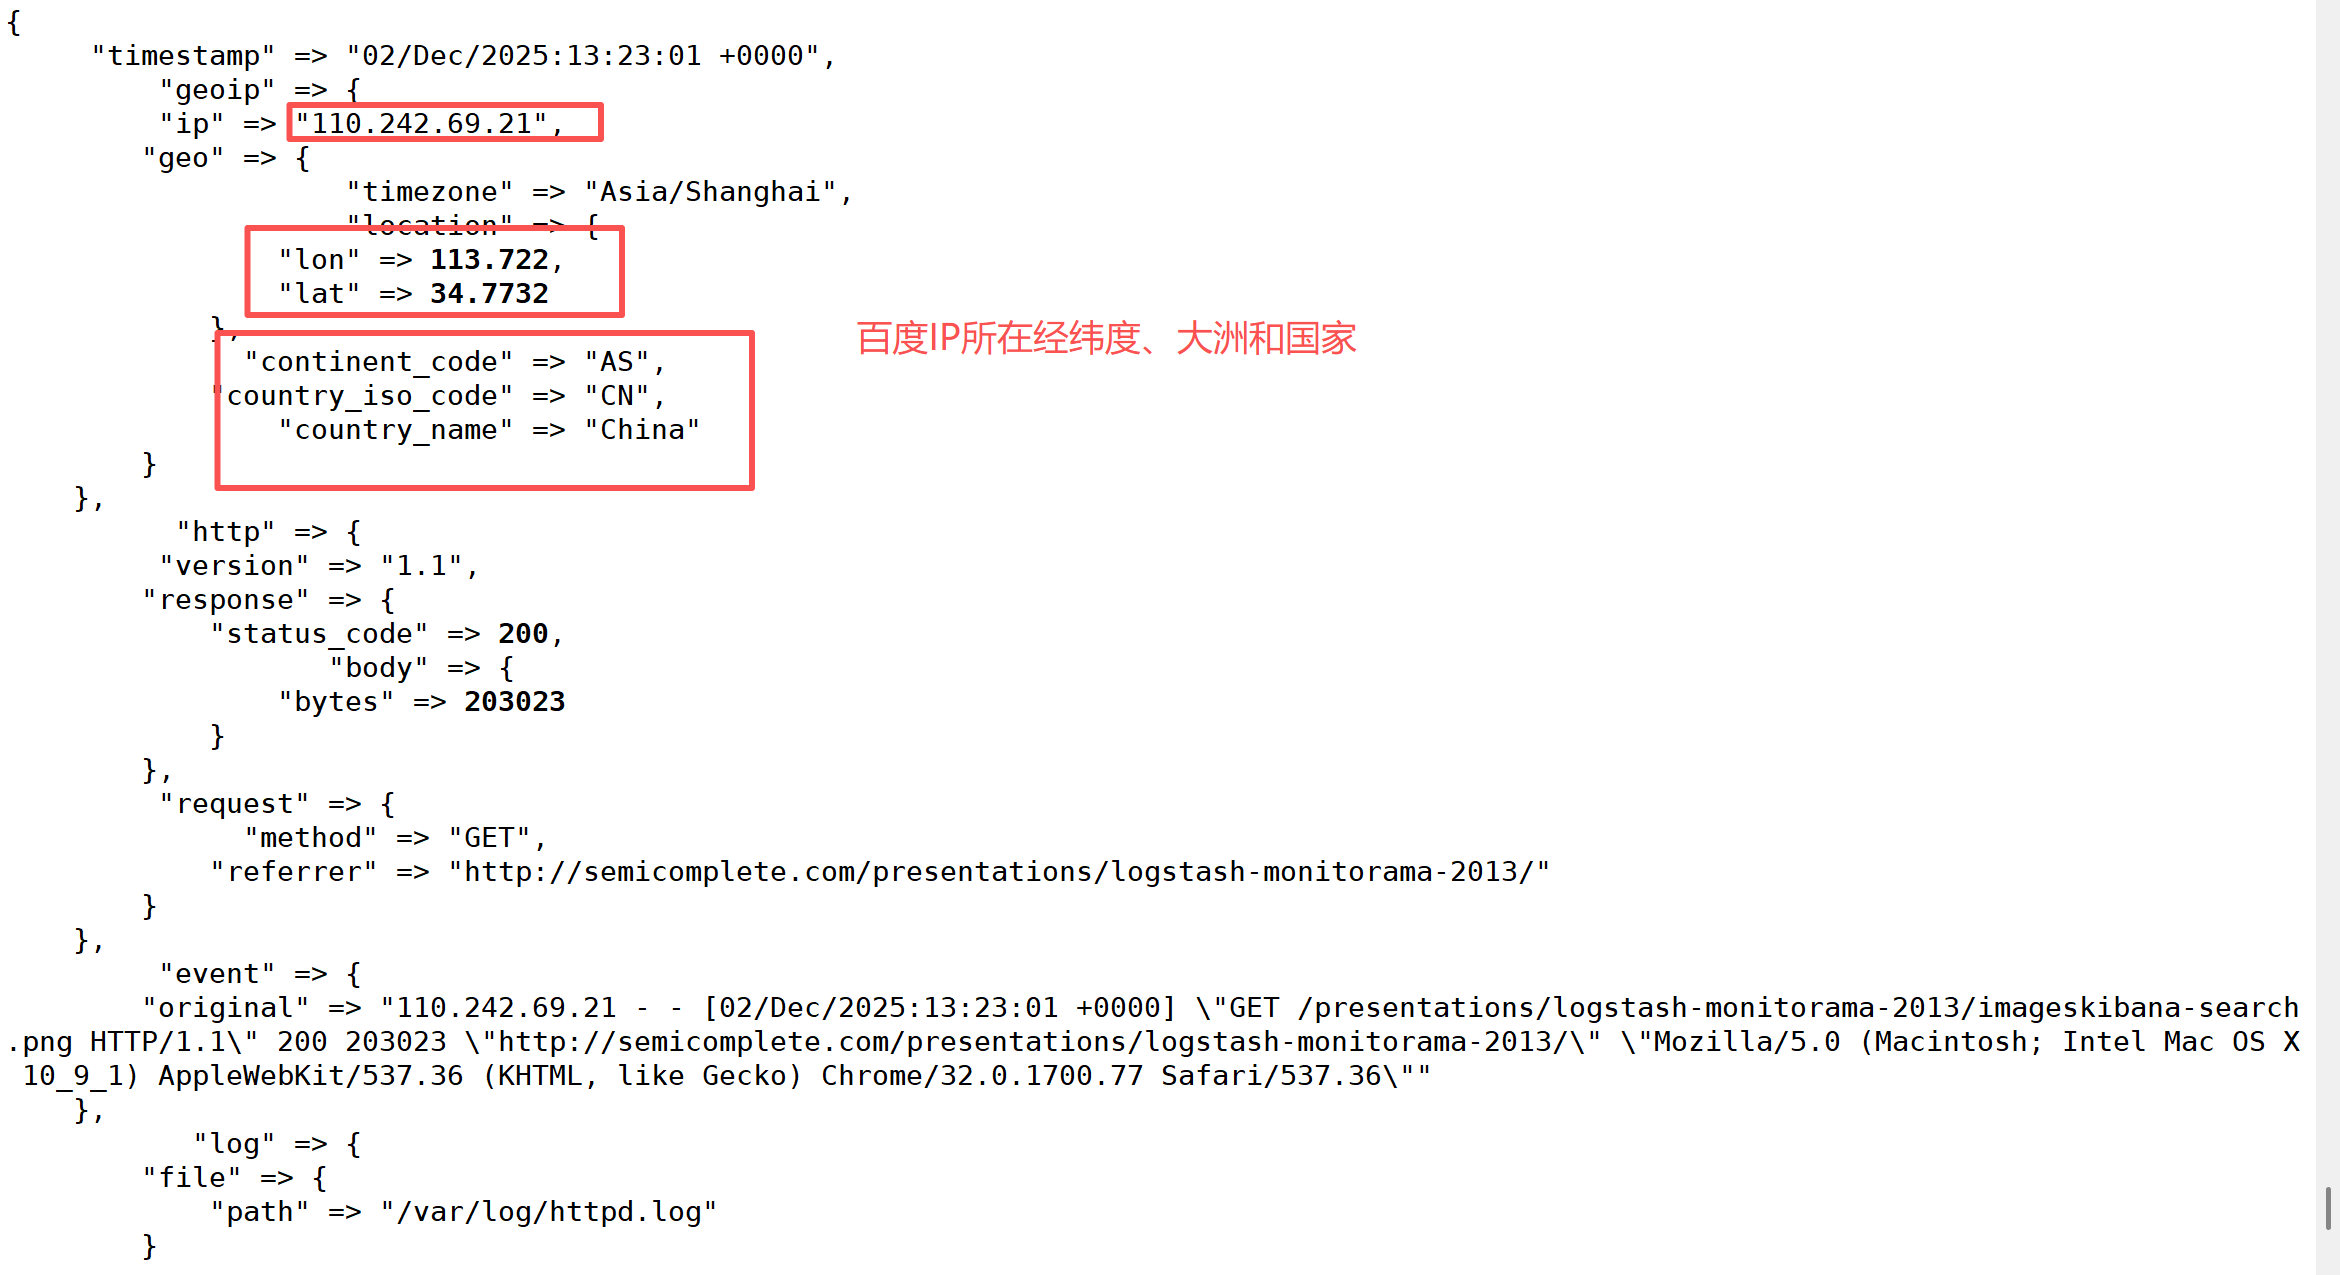
5. 使用Geoip插件定位ip地理位置
# 下载Maxmind GeoLite2数据库
[root@logstash ~]# tar xvzf GeoLite2-City_20240903.tar.gz -C /usr/local/logstash/
[root@logstash logstash]# mv GeoLite2-City_20240903 GeoLite2-City
[root@logstash logstash]# ls GeoLite2-City/
COPYRIGHT.txt  GeoLite2-City.mmdb  LICENSE.txt  README.txt# 修改管道配置文件
[root@logstash config]# vim third.conf
[root@logstash config]# cat third.conf
input {file {path => ["/var/log/httpd.log"]start_position => "beginning"}
}filter {grok {match => { "message" => "%{COMBINEDAPACHELOG}" }}mutate {rename => {"source" => "source_ip"}}mutate {remove_field => ["message","@version"]}geoip {source => "[source_ip][address]"target => "geoip"database => "/usr/local/logstash/GeoLite2-City/GeoLite2-City.mmdb"}
}output {stdout {}
}# 编辑测试日志文件
[root@logstash file]# vim /var/log/httpd.log
[root@logstash file]# cat /var/log/httpd.log
43.137.211.13 - - [01/Jan/2025:05:13:42 +0000] "GET /presentations/logstash-monitorama-2013/imageskibana-search.png HTTP/1.1" 200 203023 "http://semicomplete.com/presentations/logstash-monitorama-2013/" "Mozilla/5.0 (Macintosh; Intel Mac OS X 10_9_1) AppleWebKit/537.36 (KHTML, like Gecko) Chrome/32.0.1700.77 Safari/537.36"110.242.69.21 - - [02/Dec/2025:13:23:01 +0000] "GET /presentations/logstash-monitorama-2013/imageskibana-search.png HTTP/1.1" 200 203023 "http://semicomplete.com/presentations/logstash-monitorama-2013/" "Mozilla/5.0 (Macintosh; Intel Mac OS X 10_9_1) AppleWebKit/537.36 (KHTML, like Gecko) Chrome/32.0.1700.77 Safari/537.36"# 测试
[root@logstash logstash]# pwd
/usr/local/logstash
# 每次测试之前需要删除缓存数据(如果有)
[root@logstash logstash]# rm -rf data/plugins/inputs/file/.sincedb_aff270f7990dabcdbd0044eac08398ef[root@logstash logstash]# ./bin/logstash -f /usr/local/logstash/config/third.conf 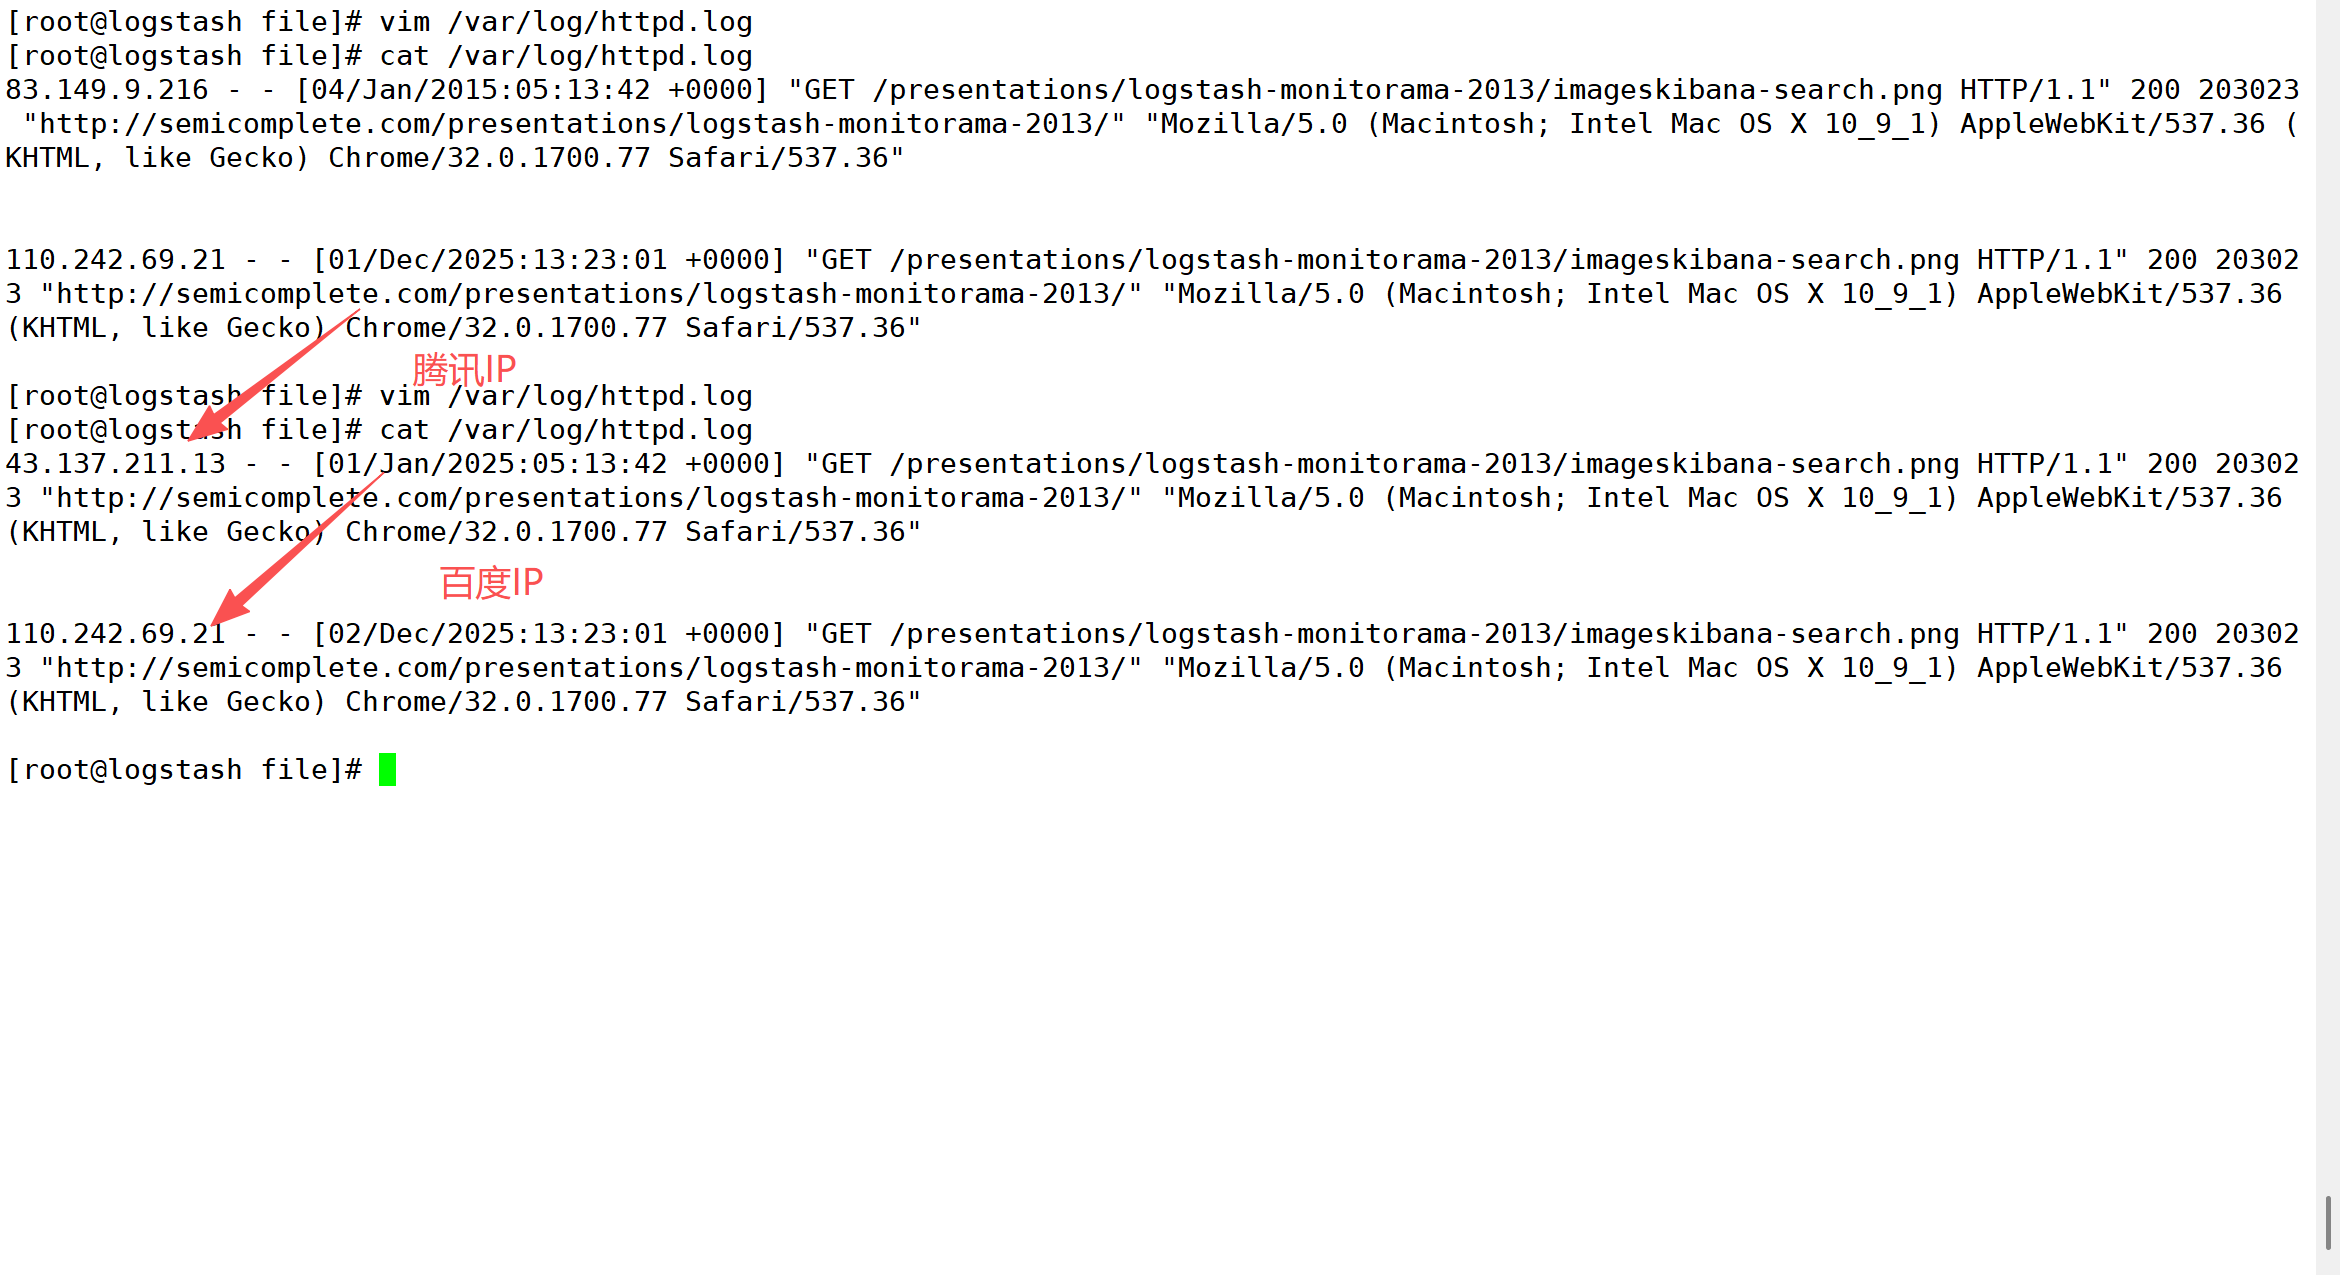
6. 配置接收 Beats 的输入
6.1 配置
# 监听 5044 端口,接收 filebeat 的输入
[root@logstash logstash]# vim config/fourth.conf
[root@logstash logstash]# cat config/fourth.conf
input {beats {port => 5044}
}filter {grok {match => { "message" => "%{COMBINEDAPACHELOG}" }}
}output {stdout {}
}# 修改filebeat的yml文件
[root@filebeat01 filebeat]# vim filebeat.yml
[root@filebeat01 filebeat]# grep -C 2 "output.logstash" filebeat.yml# ------------------------------ Logstash Output -------------------------------
output.logstash:# The Logstash hostshosts: ["logstash:5044"]  # 如果/etc/hosts内没有解析,则写ip地址# 清除缓存目录[root@filebeat01 filebeat]# rm -rf /usr/local/filebeat/data/
6.2 测试
[root@filebeat01 filebeat]# ./filebeat -c filebeat.yml
[root@logstash logstash]# ./bin/logstash -f /usr/local/logstash/config/fourth.conf# 另一台机器上curl测试
[root@client ~]# curl 172.17.16.178/Aliyun_nice
[root@client ~]# curl 172.17.16.178# 在logstash节点观察
{"tags" => [[0] "beats_input_codec_plain_applied"],"log" => {"offset" => 512,"file" => {"path" => "/var/log/nginx/access.log"}},"fileset" => {"name" => "access"},"source" => {"address" => "192.168.159.143"},"message" => "192.168.159.143 - - [07/Nov/2025:14:26:17 +0800] \"GET /Aliyun_nice HTTP/1.1\" 404 3971 \"-\" \"curl/7.76.1\" \"-\"","input" => {"type" => "log"},"event" => {"module" => "nginx","dataset" => "nginx.access","original" => "192.168.159.143 - - [07/Nov/2025:14:26:17 +0800] \"GET /Aliyun_nice HTTP/1.1\" 404 3971 \"-\" \"curl/7.76.1\" \"-\"","timezone" => "+08:00"},"@timestamp" => 2025-11-07T06:26:19.425Z,"agent" => {"name" => "filebeat01","version" => "8.15.0","type" => "filebeat","ephemeral_id" => "1c4b0712-800a-4ef6-81ed-2f47abe57468","id" => "1d803d78-8003-4274-bca0-df072935e048"},"service" => {"type" => "nginx"},"timestamp" => "07/Nov/2025:14:26:17 +0800","http" => {"version" => "1.1","response" => {"status_code" => 404,"body" => {"bytes" => 3971}},"request" => {"method" => "GET"}},"ecs" => {"version" => "1.12.0"},"@version" => "1","user_agent" => {"original" => "curl/7.76.1"},"url" => {"original" => "/Aliyun_nice"},"host" => {"mac" => [[0] "00-0C-29-B9-12-39"],"hostname" => "filebeat01","architecture" => "x86_64","id" => "04b2658c610b41d0a825d34297cc9d1e","ip" => [[0] "192.168.159.144",[1] "fe80::20c:29ff:feb9:1239"],"os" => {"kernel" => "5.14.0-592.el9.x86_64","type" => "linux","version" => "9","name" => "CentOS Stream","platform" => "centos","family" => "redhat"},"name" => "filebeat01","containerized" => false}
}
{"tags" => [[0] "beats_input_codec_plain_applied"],"log" => {"offset" => 620,"file" => {"path" => "/var/log/nginx/access.log"}},"fileset" => {"name" => "access"},"source" => {"address" => "192.168.159.143"},"message" => "192.168.159.143 - - [07/Nov/2025:14:27:33 +0800] \"GET / HTTP/1.1\" 200 2713881 \"-\" \"curl/7.76.1\" \"-\"","input" => {"type" => "log"},"event" => {"module" => "nginx","dataset" => "nginx.access","original" => "192.168.159.143 - - [07/Nov/2025:14:27:33 +0800] \"GET / HTTP/1.1\" 200 2713881 \"-\" \"curl/7.76.1\" \"-\"","timezone" => "+08:00"},"@timestamp" => 2025-11-07T06:27:34.435Z,"agent" => {"ephemeral_id" => "1c4b0712-800a-4ef6-81ed-2f47abe57468","name" => "filebeat01","type" => "filebeat","version" => "8.15.0","id" => "1d803d78-8003-4274-bca0-df072935e048"},"service" => {"type" => "nginx"},"timestamp" => "07/Nov/2025:14:27:33 +0800","http" => {"version" => "1.1","response" => {"status_code" => 200,"body" => {"bytes" => 2713881}},"request" => {"method" => "GET"}},"ecs" => {"version" => "1.12.0"},"@version" => "1","user_agent" => {"original" => "curl/7.76.1"},"url" => {"original" => "/"},"host" => {"mac" => [[0] "00-0C-29-B9-12-39"],"hostname" => "filebeat01","architecture" => "x86_64","id" => "04b2658c610b41d0a825d34297cc9d1e","name" => "filebeat01","os" => {"kernel" => "5.14.0-592.el9.x86_64","type" => "linux","version" => "9","name" => "CentOS Stream","platform" => "centos","family" => "redhat"},"ip" => [[0] "192.168.159.144",[1] "fe80::20c:29ff:feb9:1239"],"containerized" => false}
}
四、Elasticsearch
1. 二进制安装
Download Elasticsearch | Elastic![]() https://www.elastic.co/downloads/elasticsearch
https://www.elastic.co/downloads/elasticsearch
2. 环境配置
[root@es01 ~]# cat /etc/hosts
::1 localhost localhost.localdomain localhost6 localhost6.localdomain6
127.0.0.1 localhost localhost.localdomain localhost4 localhost4.localdomain4172.17.16.178 filebeat
172.17.16.176 logstash
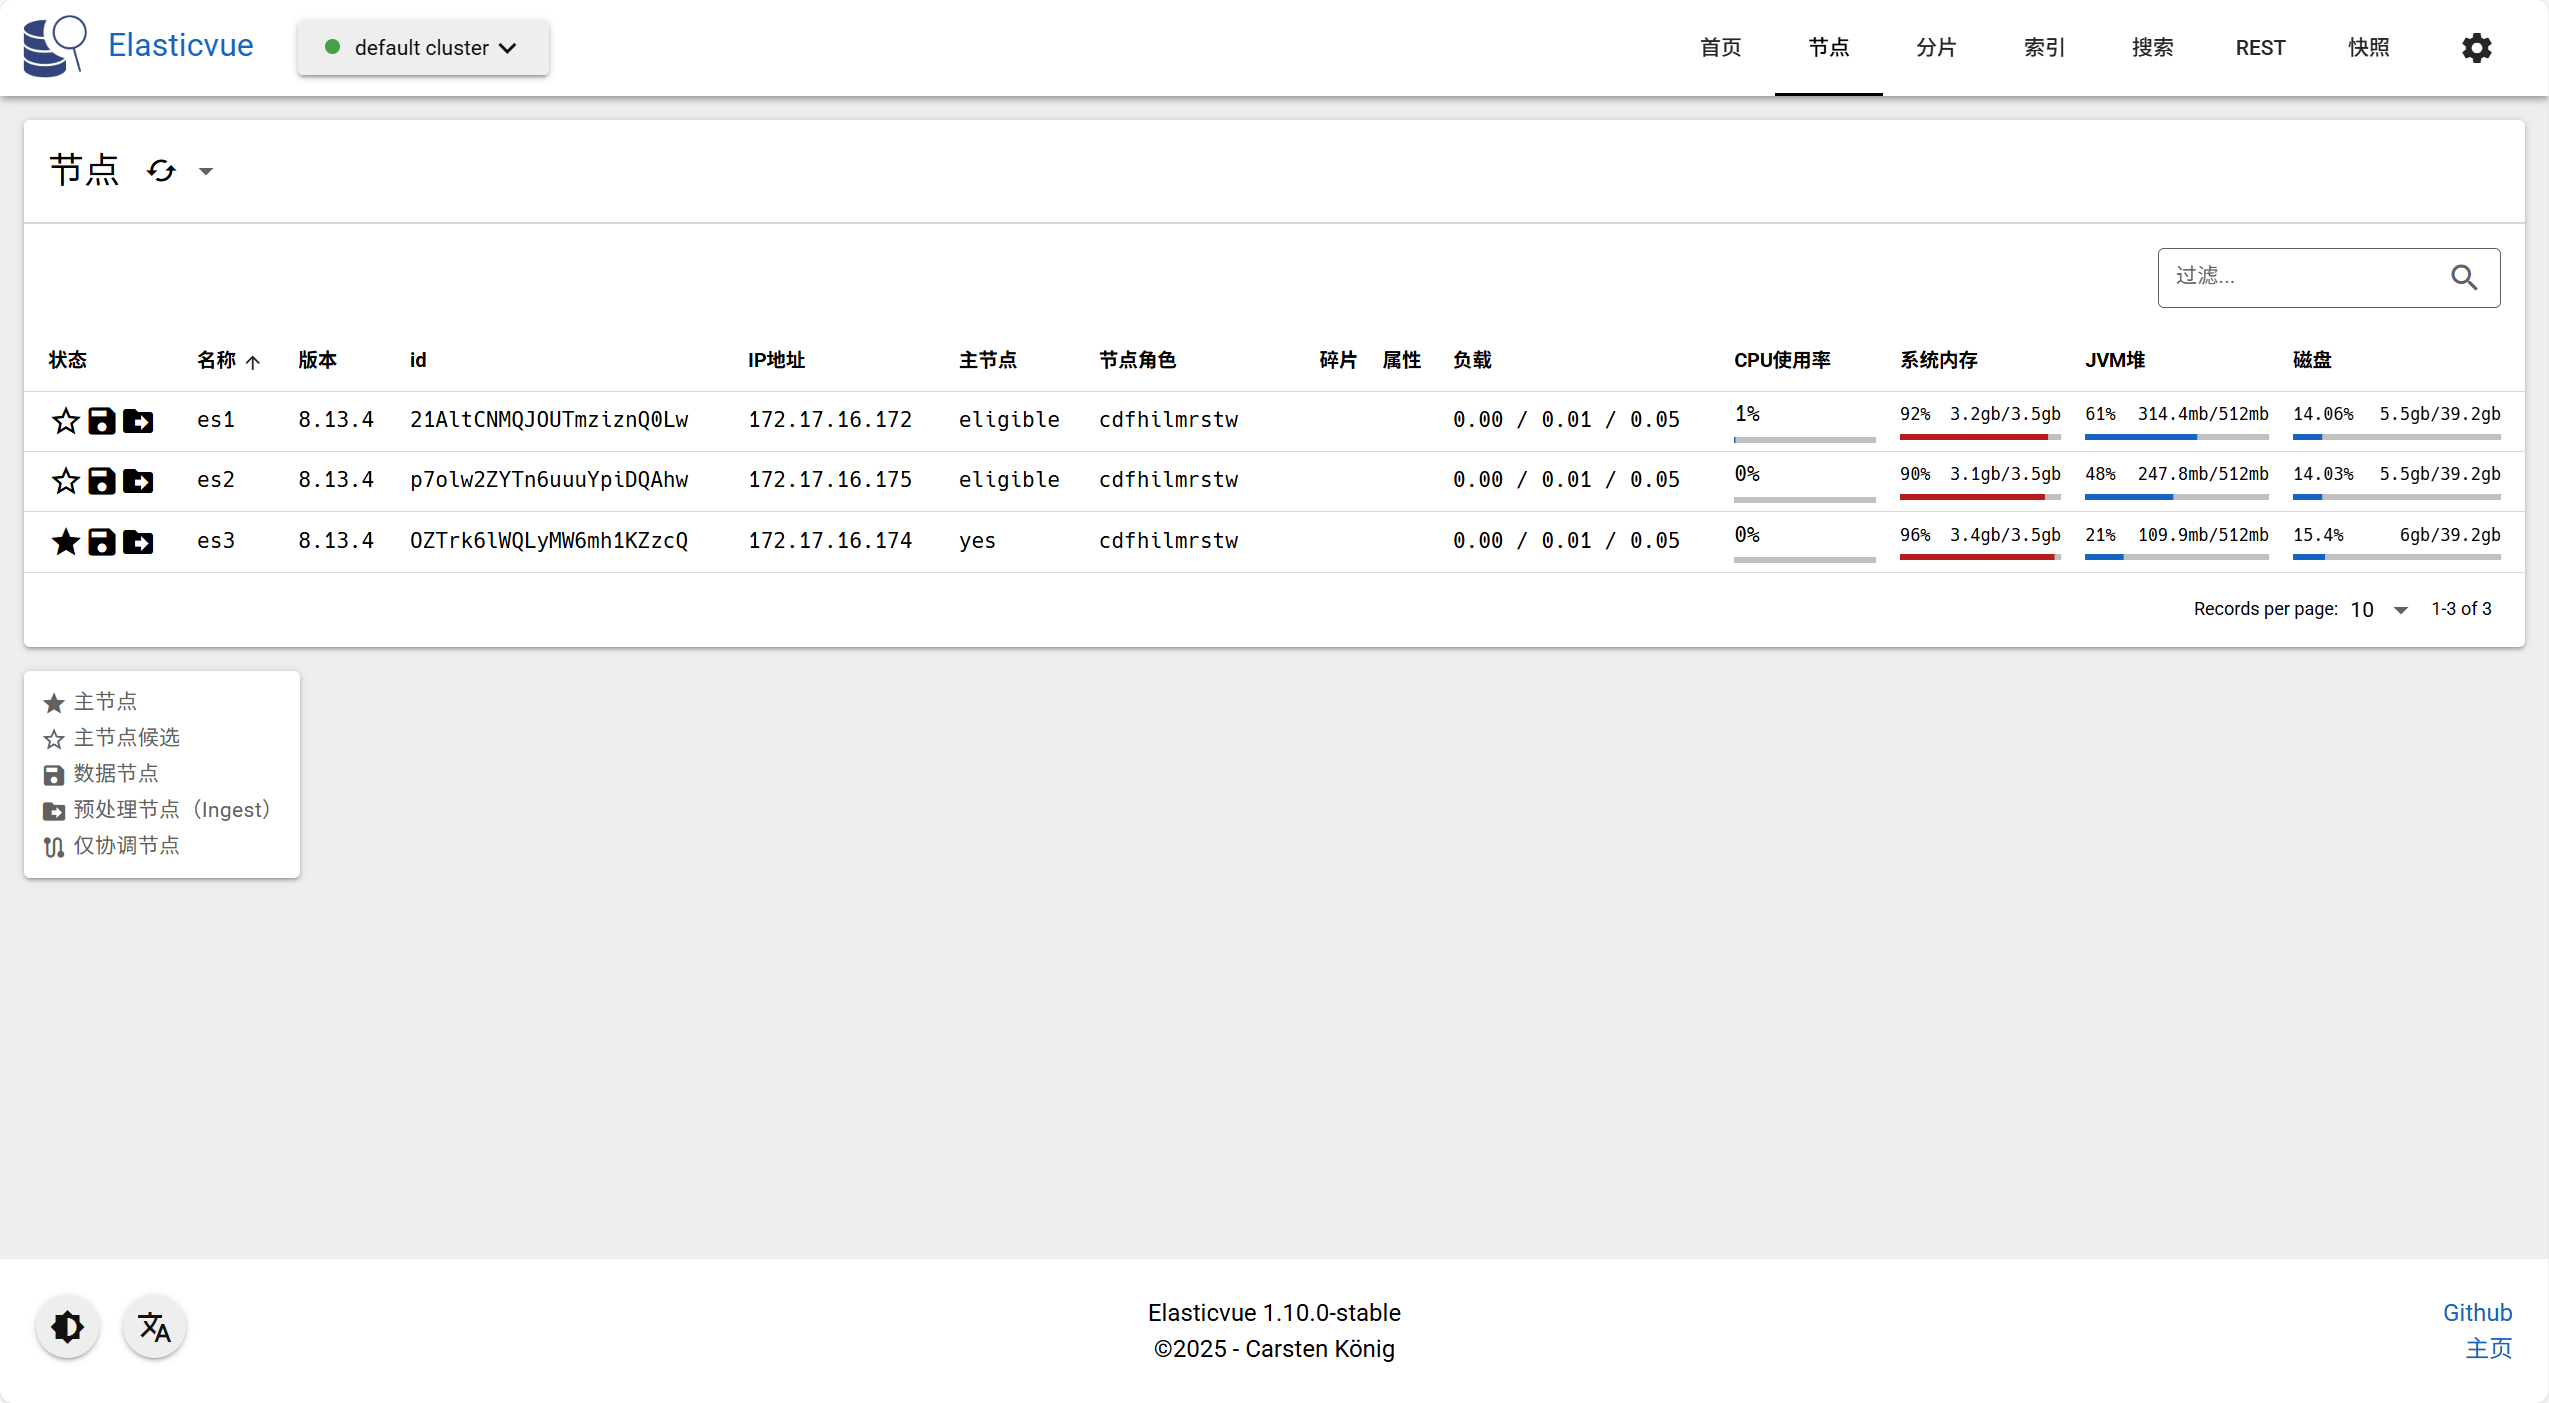
172.17.16.172 es1
172.17.16.175 es2
172.17.16.174 es3
172.17.16.173 kibana[root@es01 ~]# tail -n 4 /etc/security/limits.conf
* soft nofile 65536
* hard nofile 131072
* soft nproc 4096
* hard nproc 6553[root@es01 ~]# tail -n 1 /etc/sysctl.conf
vm.max_map_count=262144[root@es01 ~]# sysctl -p
vm.max_map_count = 2621443. 集群部署【以es01为例,其他两台操作一致】
3.1 安装
[root@es01 ~]# mv elasticsearch-8.13.4 /usr/local/es
[root@es01 ~]# ls /usr/local/es
bin  config  jdk  lib  LICENSE.txt  logs  modules  NOTICE.txt  plugins  README.asciidoc[root@es01 ~]#  useradd elasticsearch && echo 1|passwd --stdin elasticsearch
Changing password for user elasticsearch.
passwd: all authentication tokens updated successfully.
[root@es01 ~]# chown -R elasticsearch.elasticsearch /usr/local/es
3.2 配置环境变量
[root@es01 ~]# vim /etc/profile.d/es.sh
[root@es01 ~]# cat /etc/profile.d/es.sh
export JAVA_HOME=/usr/local/es/jdk
export ES_HOME=/usr/local/es
export PATH=$ES_HOME/bin:$JAVA_HOME/bin:$PATH
[root@es01 ~]# chmod +x /etc/profile.d/es.sh
[root@es01 ~]# source /etc/profile.d/es.sh
[root@es01 ~]# java --version
openjdk 22.0.1 2024-04-16
OpenJDK Runtime Environment (build 22.0.1+8-16)
OpenJDK 64-Bit Server VM (build 22.0.1+8-16, mixed mode, sharing)
3.3 创建存储数据和存放证书的目录
[root@es01 ~]# cd /usr/local/es/
[root@es01 es]# ls
bin  config  jdk  lib  LICENSE.txt  logs  modules  NOTICE.txt  plugins  README.asciidoc[root@es01 es]# mkdir data[root@es01 es]# mkdir config/certs[root@es01 es]# chown -R elasticsearch.elasticsearch /usr/local/es
3.4 签发证书
[root@es01 ~]# su - elasticsearch
[elasticsearch@es01 ~]$ cd /usr/local/es/bin# 两次回车
[elasticsearch@es01 bin]$ ./elasticsearch-certutil ca# 三次回车
[elasticsearch@es01 bin]$ ./elasticsearch-certutil cert --ca elastic-stack-ca.p12[elasticsearch@es01 bin]$ cd /usr/local/es/[elasticsearch@es01 es]$ ls
bin     data                      elastic-stack-ca.p12  lib          logs     NOTICE.txt  README.asciidoc
config  elastic-certificates.p12  jdk                   LICENSE.txt  modules  plugins
[elasticsearch@es01 es]$ mv *p12 config/certs/
[elasticsearch@es01 es]$ ls config/certs/
elastic-certificates.p12  elastic-stack-ca.p12
3.5 设置集群多节点HTTP证书
[elasticsearch@es01 es]$ cd /usr/local/es/bin/[elasticsearch@es01 bin]$ ./elasticsearch-certutil http
3.6 分发证书
[elasticsearch@es01 es]$ ls
bin  config  data  elasticsearch-ssl-http.zip  jdk  lib  LICENSE.txt  logs  modules  NOTICE.txt  plugins  README.asciidoc[elasticsearch@es01 es]$ unzip elasticsearch-ssl-http.zip [elasticsearch@es01 es]$ mv ./elasticsearch/http.p12 config/certs/[elasticsearch@es01 es]$ mv ./kibana/elasticsearch-ca.pem config/certs/[elasticsearch@es01 es]$ cd config/certs/
[elasticsearch@es01 certs]$ ls
elastic-certificates.p12  elasticsearch-ca.pem  elastic-stack-ca.p12  http.p12[elasticsearch@es01 certs]$ scp * es02:/usr/local/es/config/certs/[elasticsearch@es01 certs]$ scp * es03:/usr/local/es/config/certs/
3.7 修改配置
[elasticsearch@es01 es]$ grep -v "^#" config/elasticsearch.yml
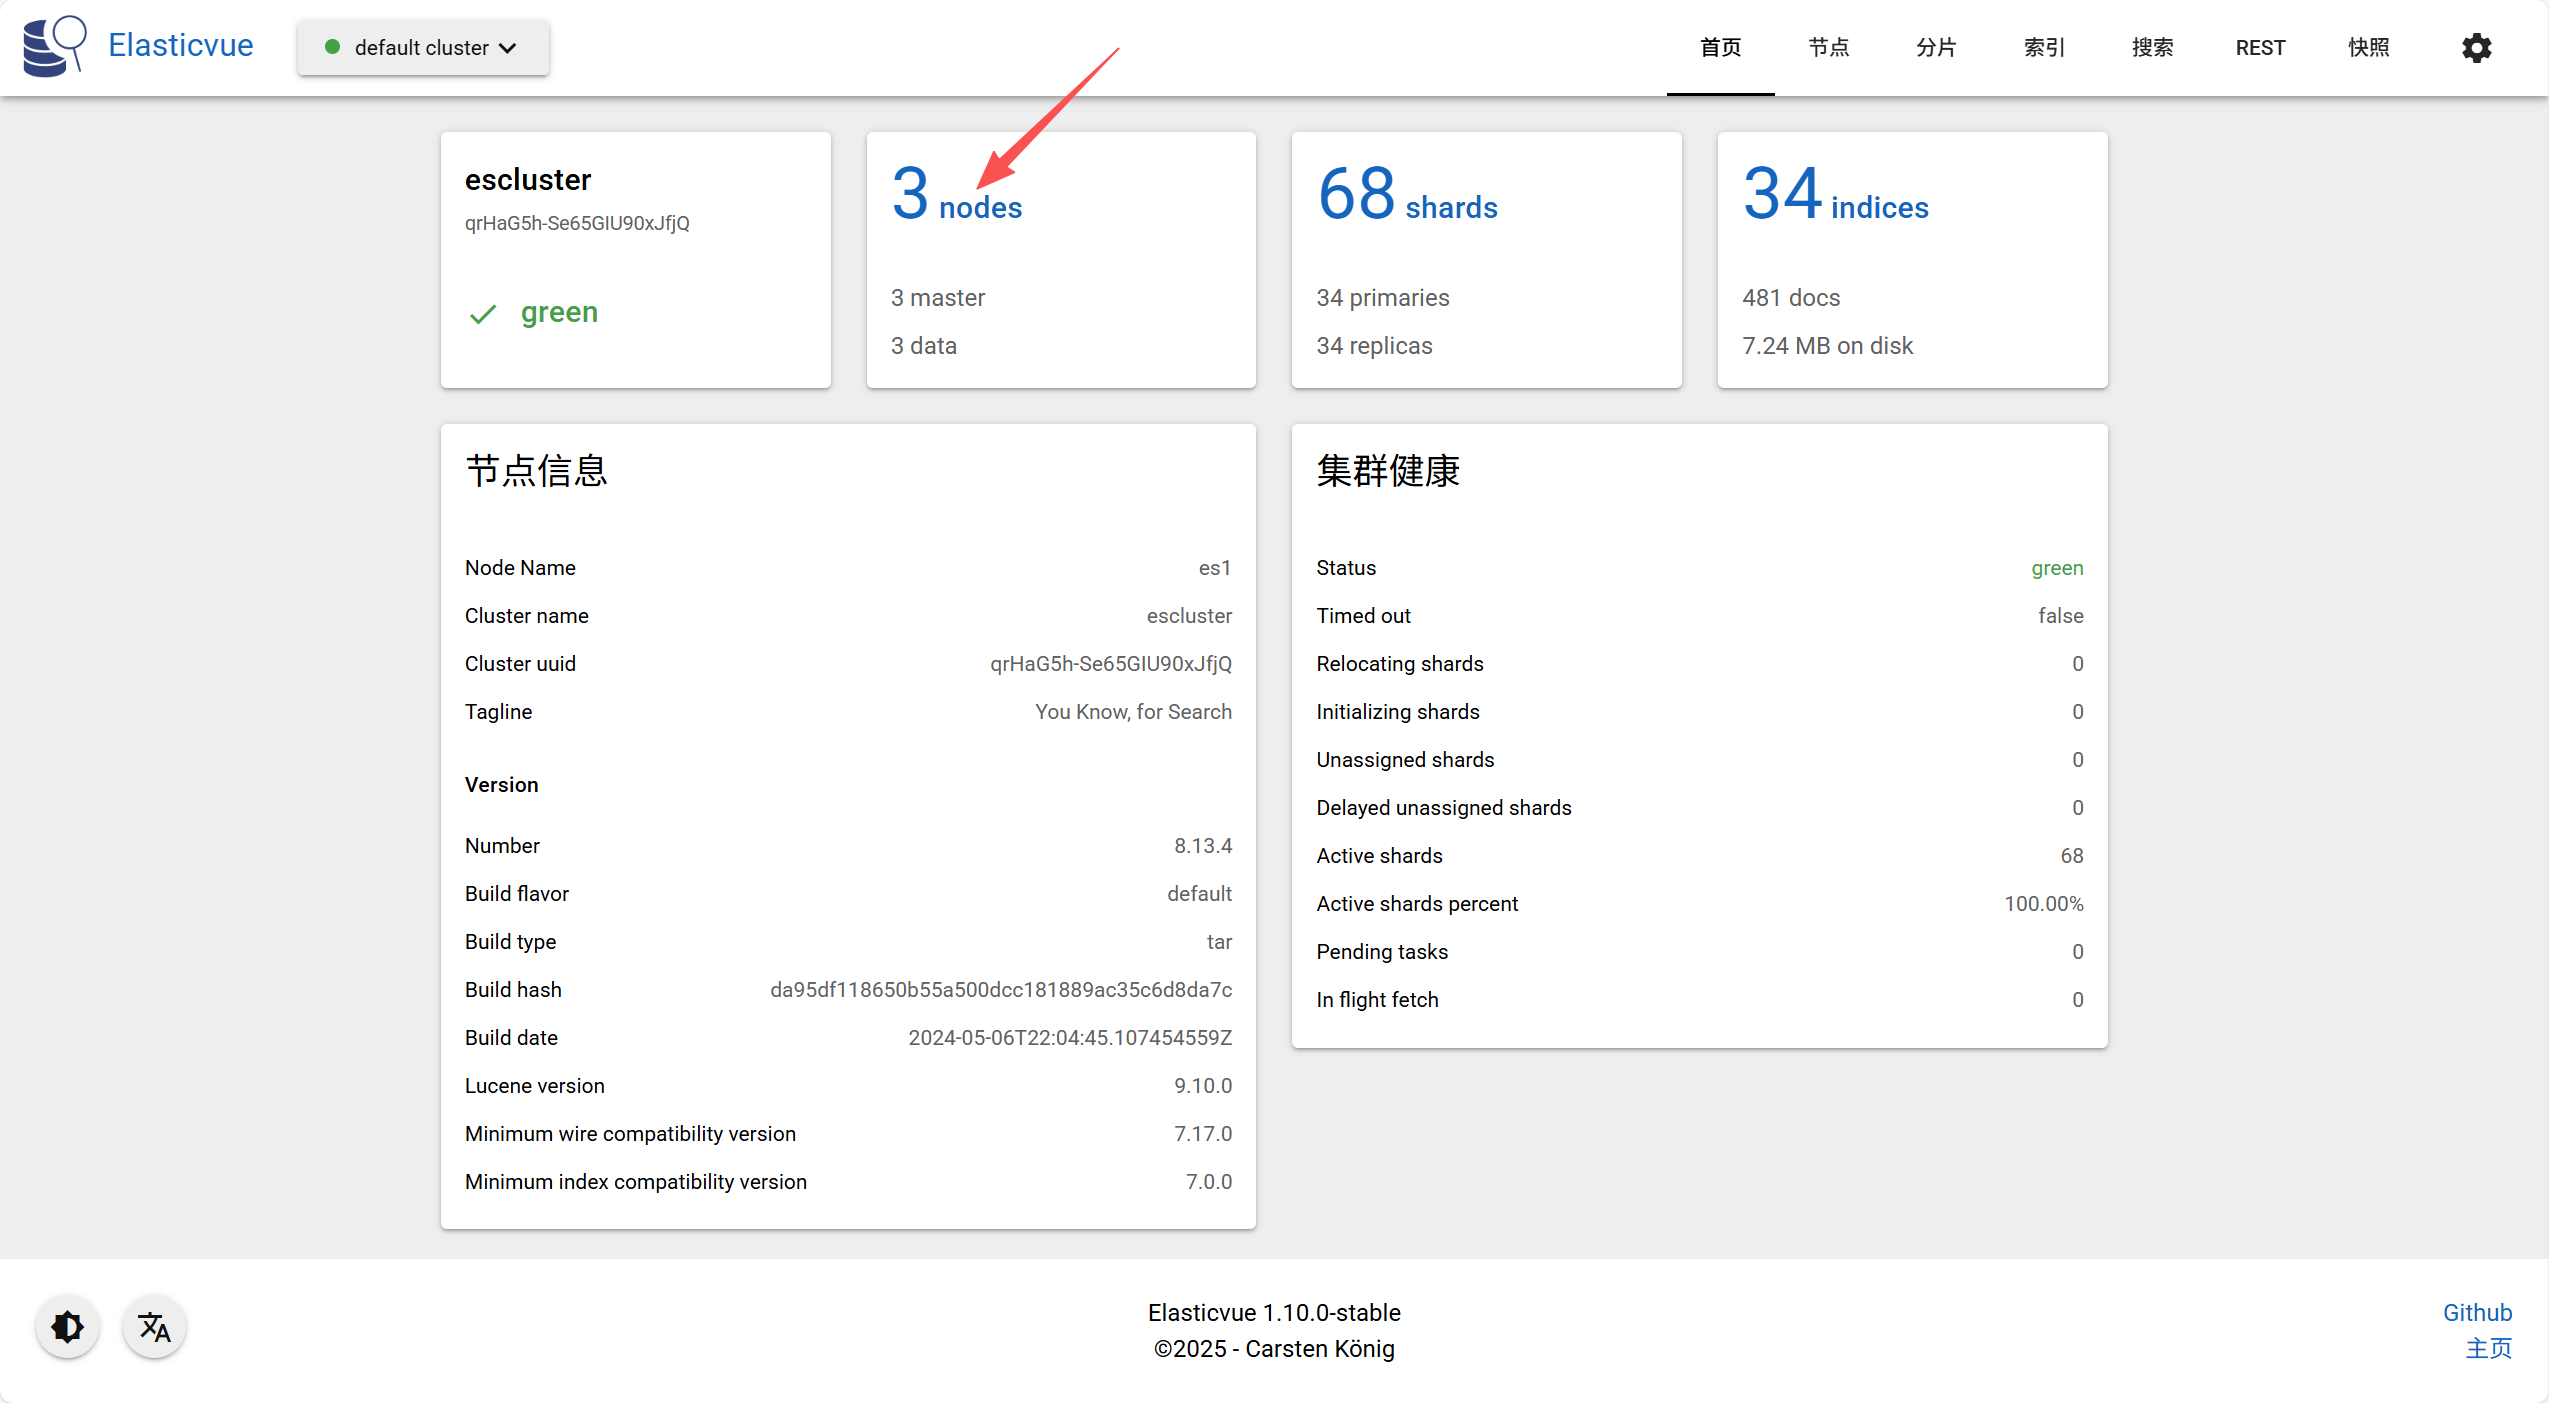
cluster.name: escluster
node.name: es01
path.data: /usr/local/es/data
path.logs: /usr/local/es/logs
network.host: 0.0.0.0
http.port: 9200
discovery.seed_hosts: ["es01","es02","es03"]
cluster.initial_master_nodes: ["es01","es02","es03"]
xpack.security.enabled: true
xpack.security.enrollment.enabled: true
xpack.security.http.ssl:enabled: truekeystore.path: /usr/local/es/config/certs/http.p12#keystore.password: 123456truststore.path: /usr/local/es/config/certs/http.p12#truststore.password: 123456
xpack.security.transport.ssl:enabled: trueverification_mode: certificatekeystore.path: /usr/local/es/config/certs/elastic-certificates.p12#keystore.password: 123456truststore.path: /usr/local/es/config/certs/elastic-certificates.p12#truststore.password: 123456
http.host: [_local_, _site_]
ingest.geoip.downloader.enabled: false
xpack.security.http.ssl.client_authentication: none# JVM参数调整
[elasticsearch@es01 es]$ vim config/jvm.options
-Xms4g
-Xmx4g
3.8 启动集群
| 命令 | 作用 | 举例 |
|---|---|---|
& | 表示“后台运行”该命令,不占当前终端 | python app.py & |
nohup | 表示“忽略挂起信号”,即使关闭终端也不退出 | nohup python app.py |
nohup + & | 结合使用:后台运行且不会因退出终端而终止 | nohup python app.py & |
# 启动集群
[elasticsearch@es01 ~]$ nohup /usr/local/es/bin/elasticsearch &# 设置登录密码
[elasticsearch@es01 ~]$ /usr/local/es/bin/elasticsearch-reset-password -u elastic -i
elasticsearch在测试时报错:curl: (7) Failed connect to 192.168.109.131:9200; 拒绝连接
解决方案:调整jvm的内存
文件 /usr/local/es/config/jvm.options参数为
-Xms512m
-Xmx512m
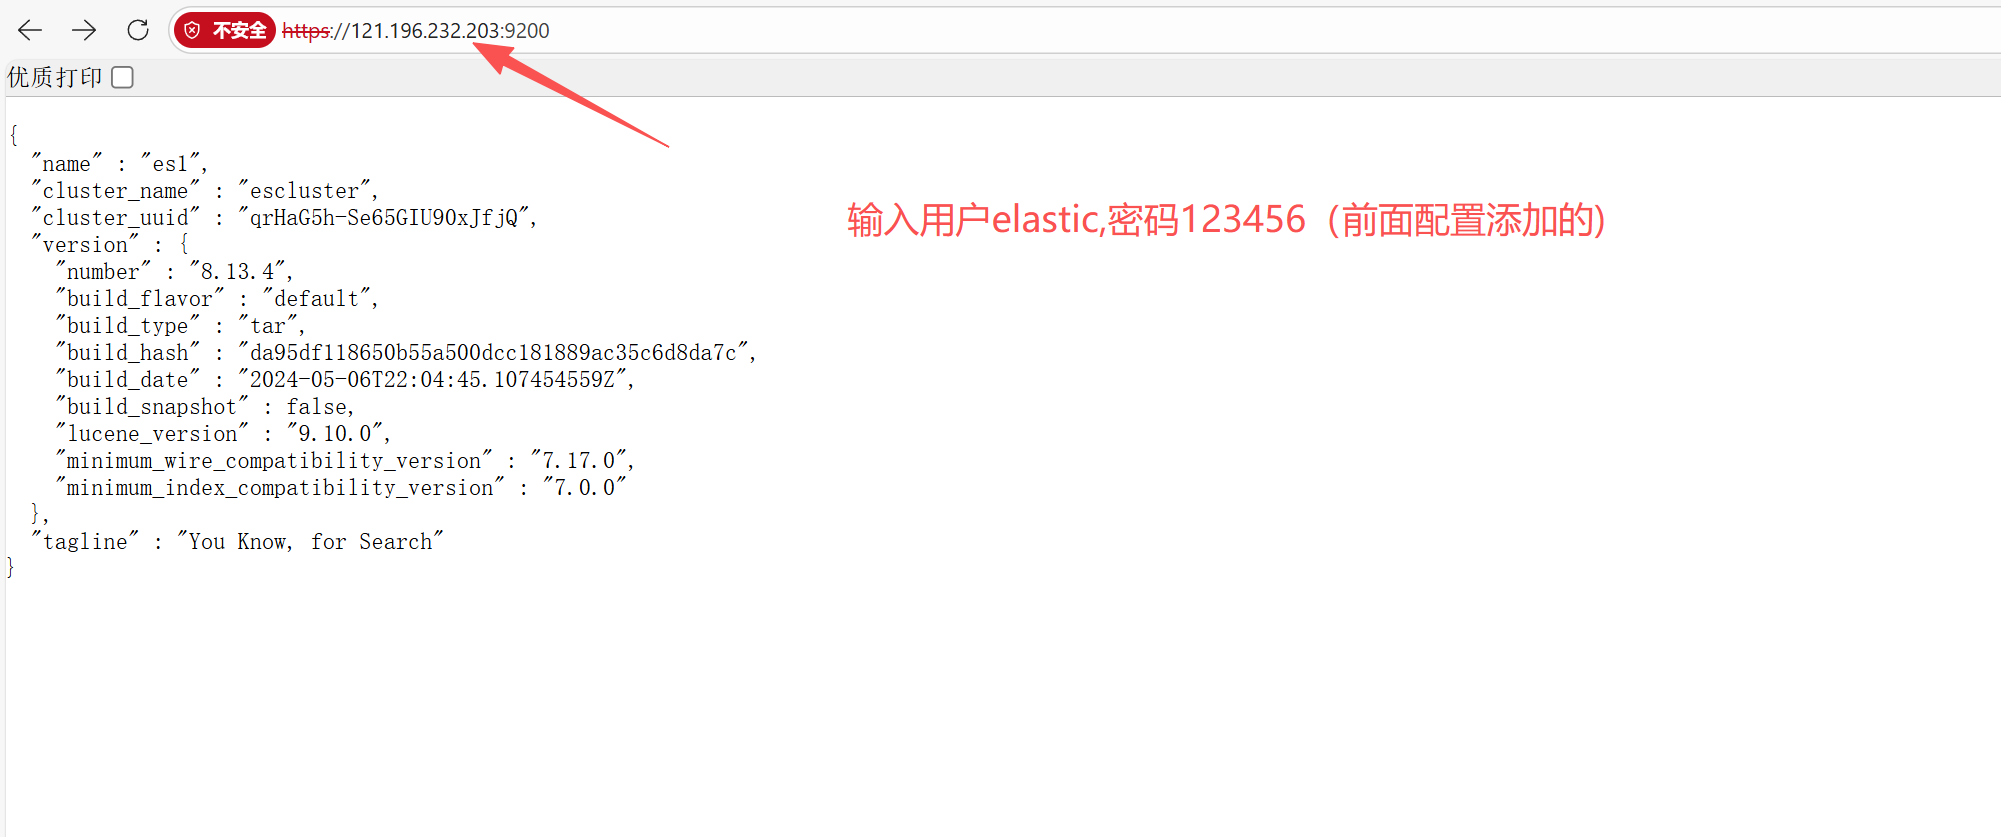
3.9 浏览器访问:
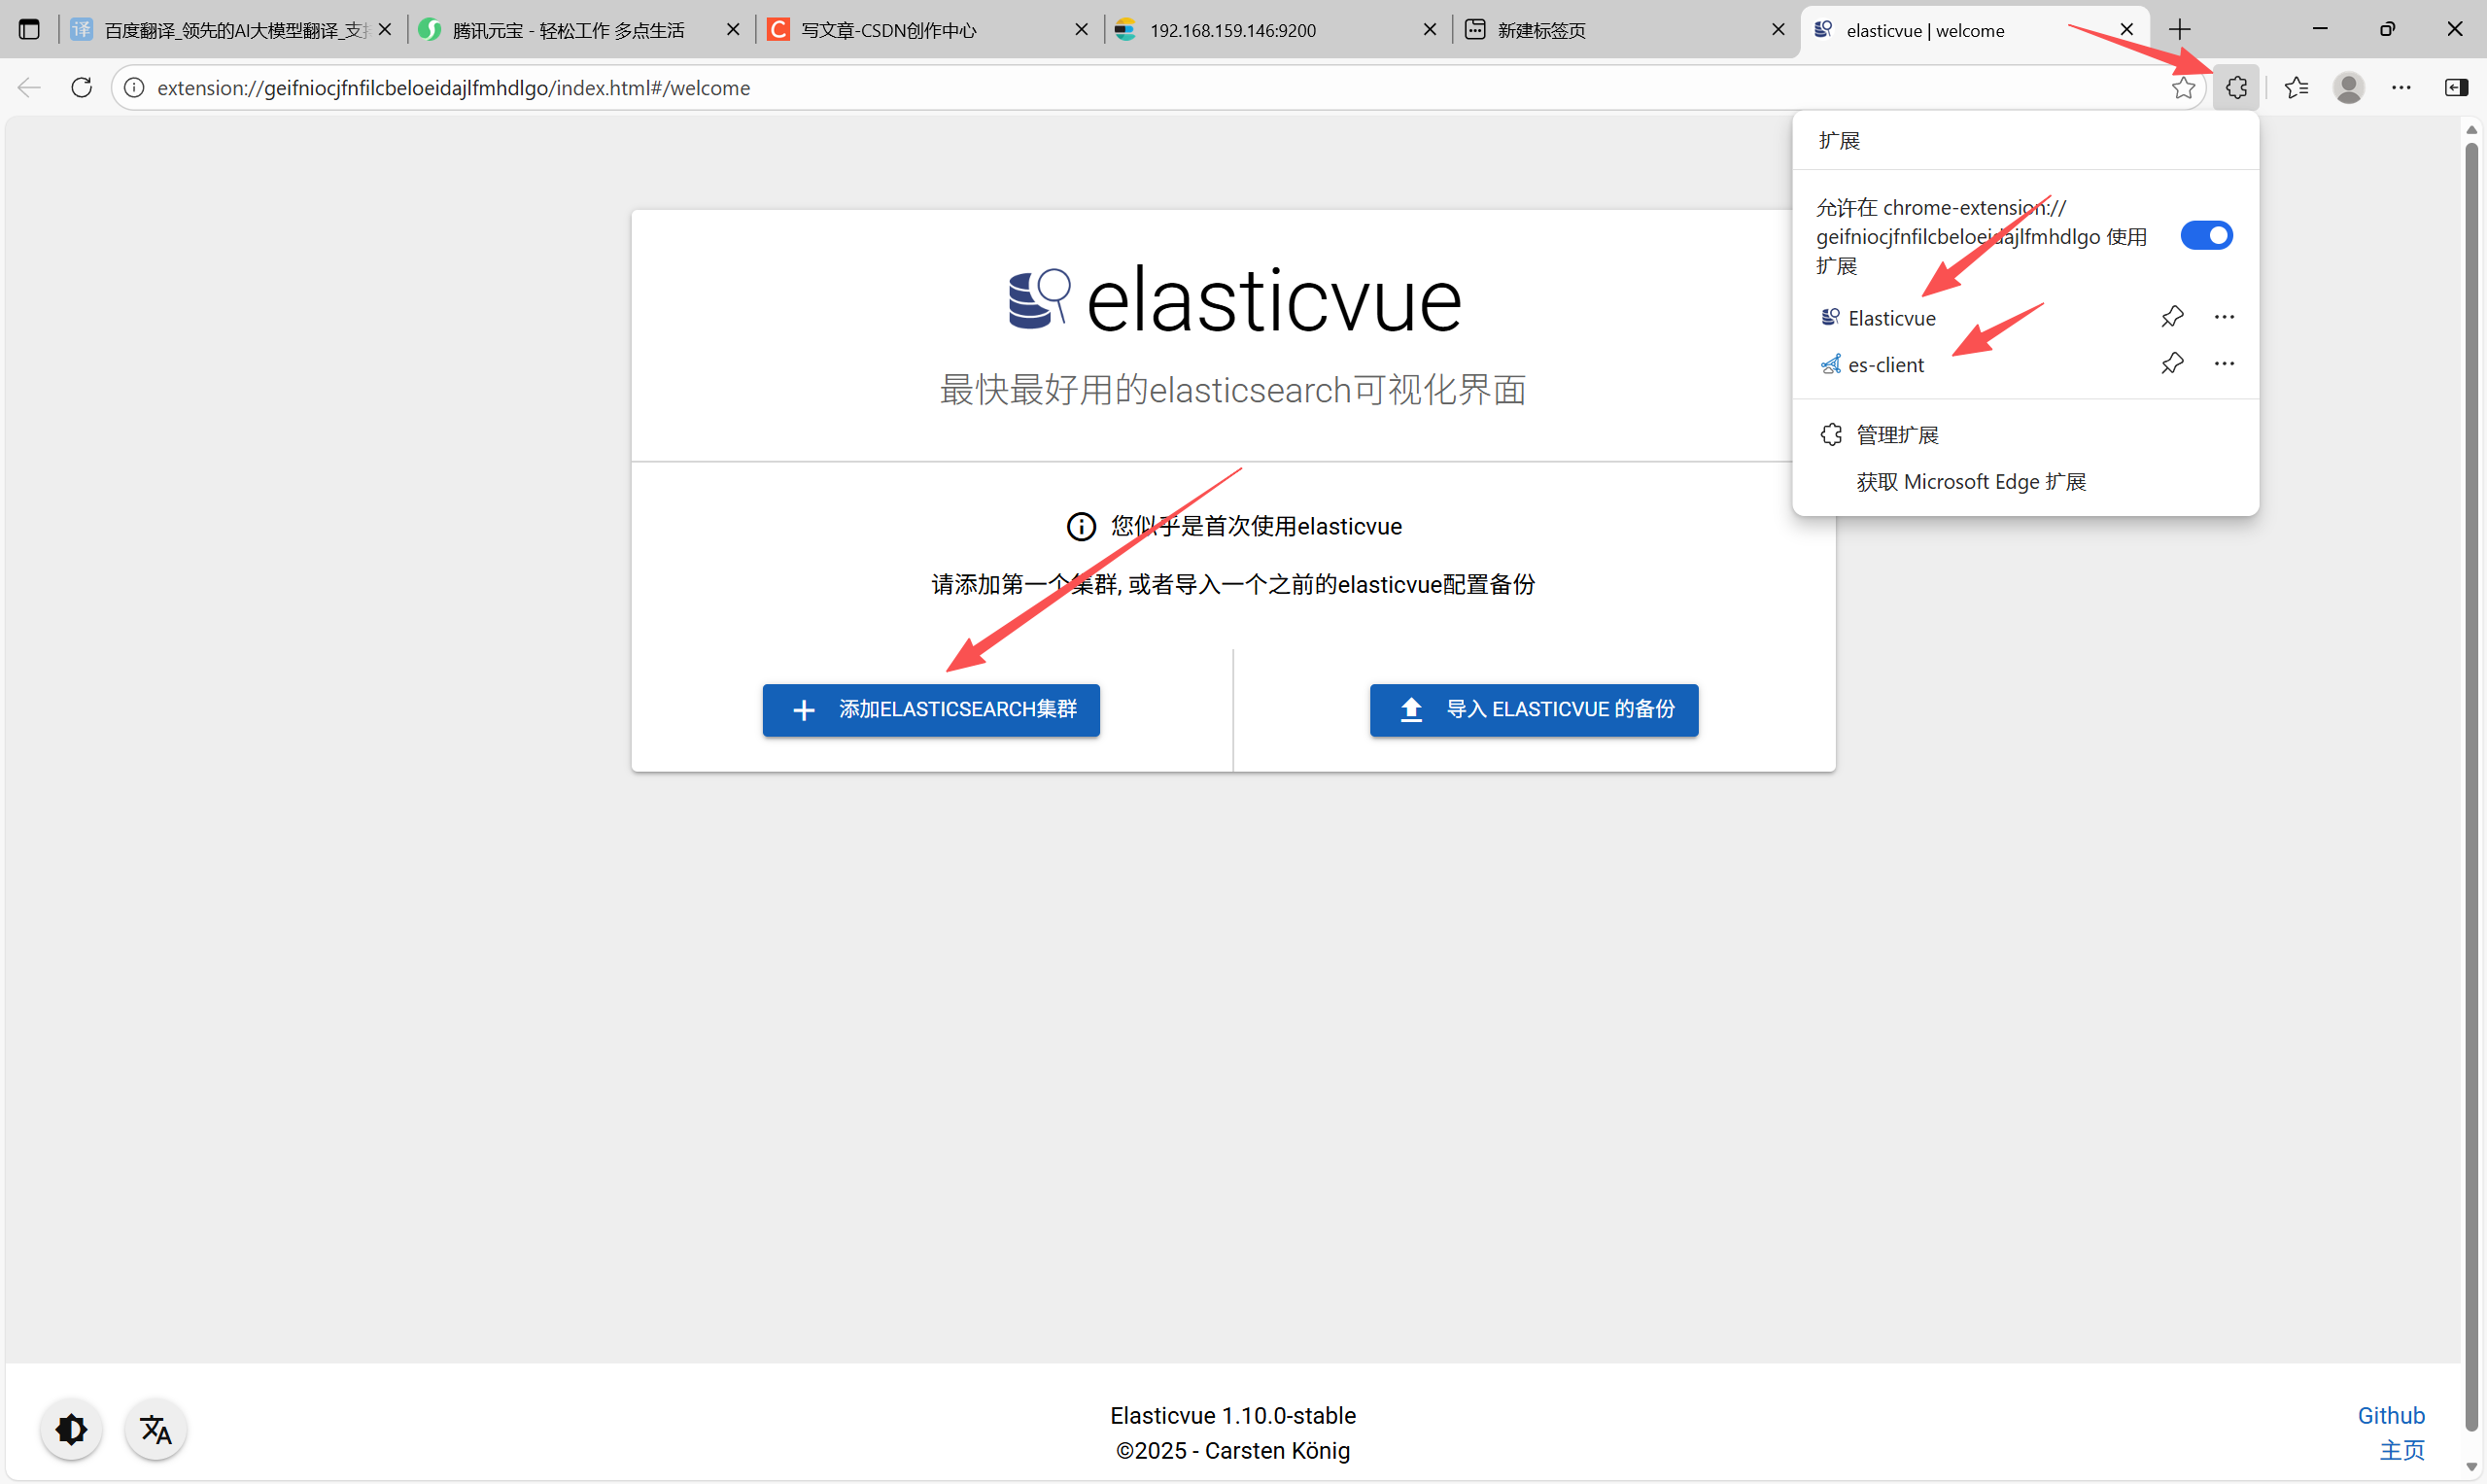
3.10 添加扩展程序
!!!注意:添加集群时是:https:// 开头
五、Kibana
1. 设置es集群kibana账户的密码(es1上操作)
用于kibana连接es集群
[elasticsearch@es1 es]$ /usr/local/es/bin/elasticsearch-reset-password -u kibana -i2. 安装kibana
注意kibana的版本必须和es版本一致,否则连接失败
[root@kibana ~]# wget https://artifacts.elastic.co/downloads/kibana/kibana-8.13.4-linux-x86_64.tar.gz[root@kibana ~]# tar xf kibana-8.14.1-linux-x86_64.tar.gz [root@kibana ~]# mv kibana-8.14.1 /usr/local/kibana[root@kibana ~]# mkdir /usr/local/kibana/config/certs3. 修改kibana配置
�[root@kibana ~]# vim /usr/local/kibana/config/kibana.yml
[root@kibana ~]# tail -n 8 /usr/local/kibana/config/kibana.yml
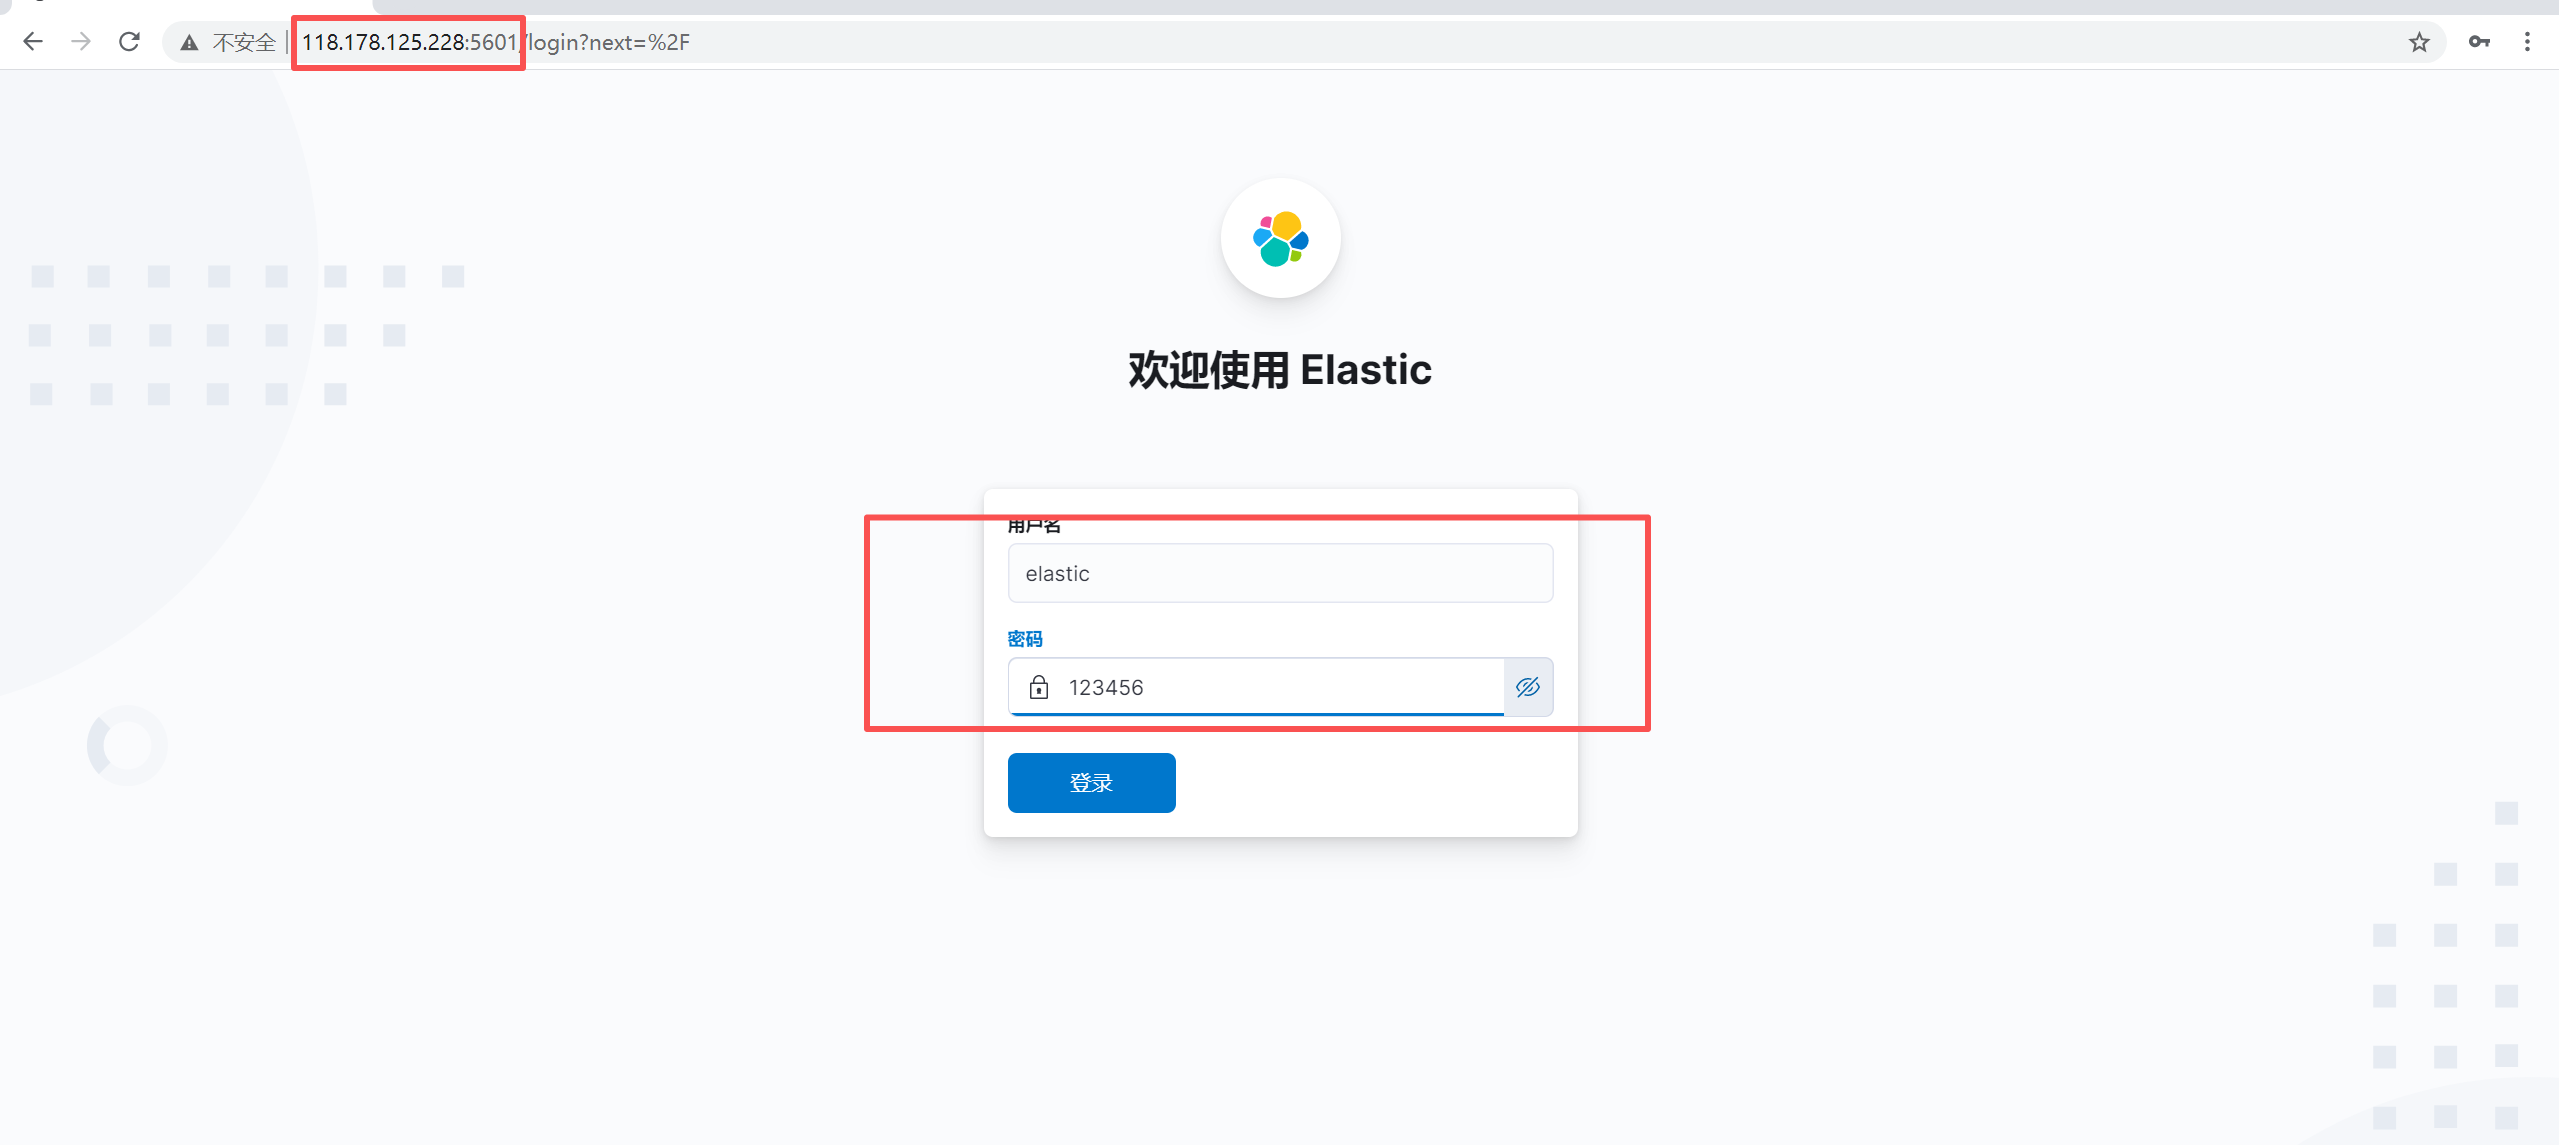
server.port: 5601
server.host: "0.0.0.0"
server.name: kibana
elasticsearch.hosts: ["https://es1:9200"]
elasticsearch.username: kibana
elasticsearch.password: 123456
elasticsearch.ssl.certificateAuthorities: [ "/usr/local/kibana/config/certs/elasticsearch-ca.pem" ]
i18n.locale: "zh-CN" # 拷贝es集群的CA证书到ki
[root@es1 ~]# cd /usr/local/es/config/certs/[root@es1 certs]# scp elasticsearch-ca.pem kibana:/usr/local/kibana/config/certs/4. 创建运行用户
[root@kibana kibana]# useradd kibana[root@kibana kibana]# echo 123456 |passwd --stdin kibana[root@kibana kibana]# chown -R kibana.kibana /usr/local/kibana/5. 启动kibana
root@kibana ~]# su - kibana [kibana@kibana ~]$ nohup ./bin/kibana &6. 浏览器测试
六、搭建ELK集群
前面的实验中filebeat和logstash服务器已连通,es01已经和kibana连通,因此现在需要连通logstash和es01服务器。
1. 修改Logstash配置文件
[root@logstash logstash]# pwd
/usr/local/logstash
[root@logstash logstash]# cat config/logstash_es.conf
input {beats {port => 5044}
}output {elasticsearch {hosts => ["https://es1:9200"]index => "%{[@metadata][beat]}-%{[@metadata][version]}-%{+YYYY.MM.dd}"user => "elastic"password => "123456"ssl => truessl_certificate_verification => truecacert => "/usr/local/logstash/config/certs/elasticsearch-ca.pem"}
}
2. 启动filebeat和logstash
[root@filebeat filebeat]# ./filebeat -c filebeat.yml[root@logstash logstash]# ./bin/logstash -f /usr/local/logstash/config/logstash_es.conf 3. 测试
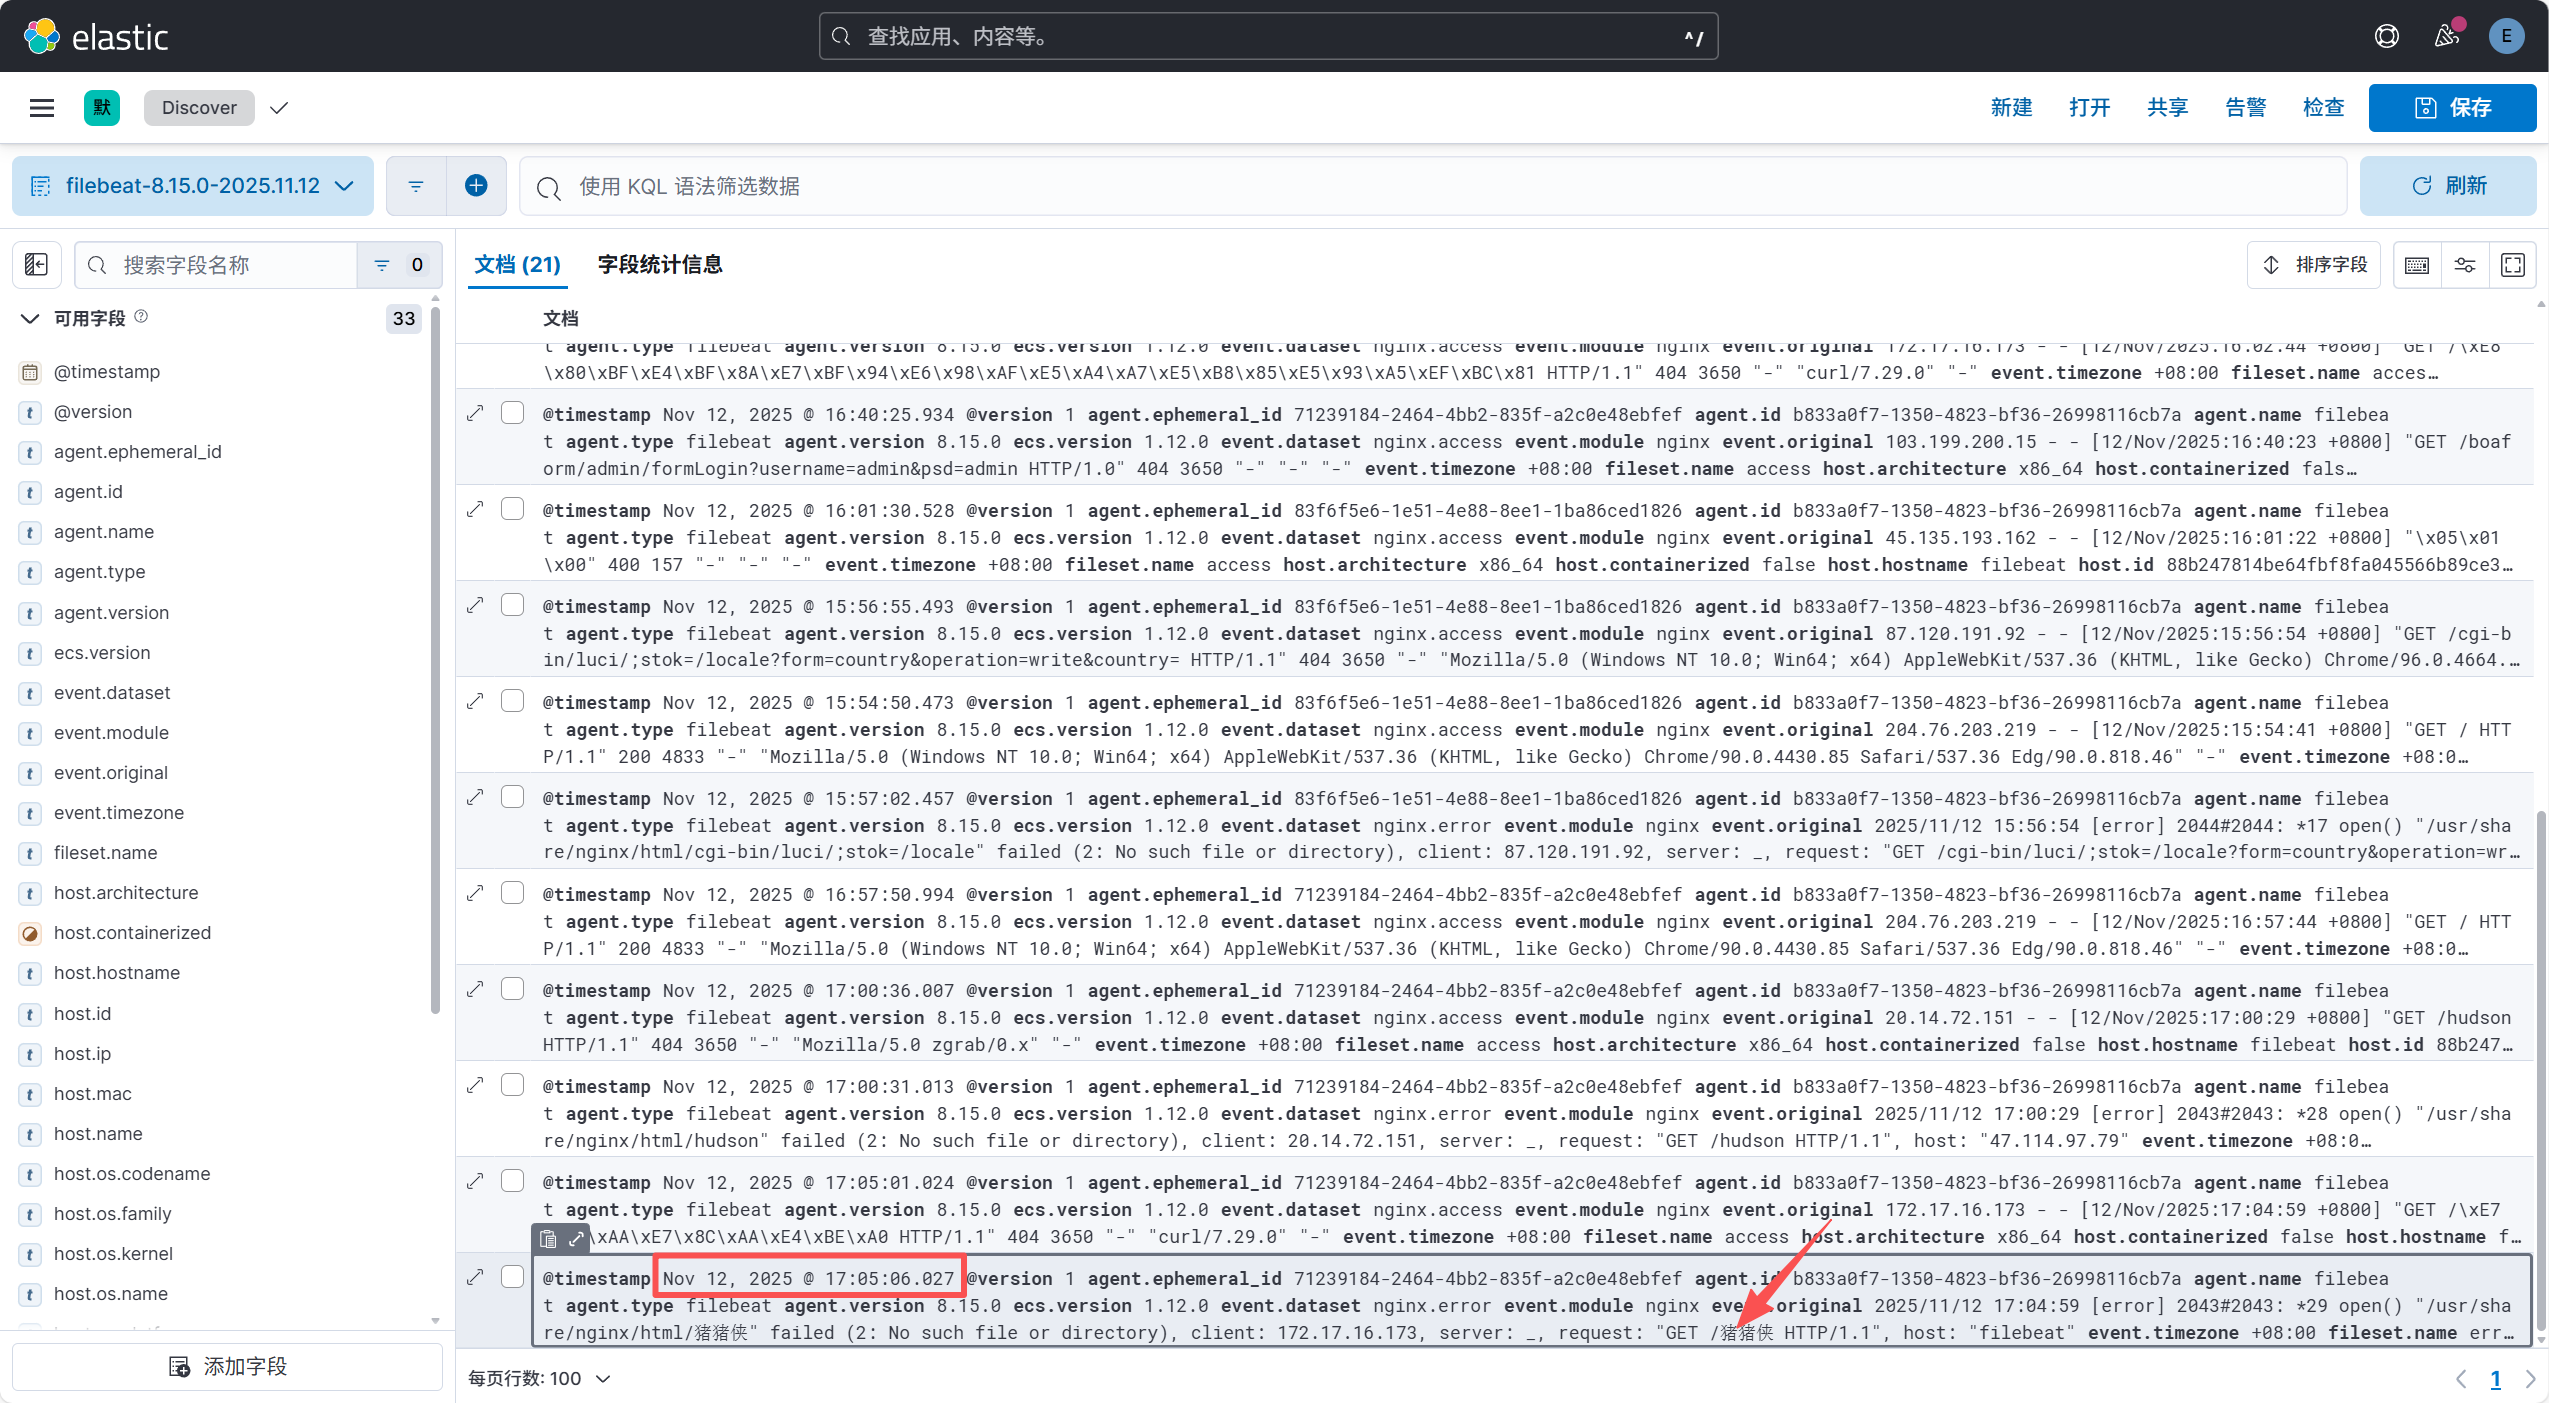
# 其他机器访问filebeat(已部署nginx)
[kibana@kibana ~]$ curl filebeat/猪猪侠# 查看所有索引
[root@es1 certs]# curl -k -u elastic:123456 -X GET "https://es1:9200/_cat/indices?v"
health status index                                                              uuid                   pri rep docs.count docs.deleted store.size pri.store.size dataset.size
green  open   .internal.alerts-observability.logs.alerts-default-000001          iuSBxgs9QYSvWWievi_NUA   1   1          0            0       498b           249b         249b
green  open   .internal.alerts-observability.apm.alerts-default-000001           CNxHx4QQTTeoFfLx6ycc_A   1   1          0            0       498b           249b         249b
green  open   .kibana-observability-ai-assistant-kb-000001                       dqJFmVcnSSqFnNE5Yi3ufg   1   1          0            0       498b           249b         249b
green  open   .internal.alerts-observability.slo.alerts-default-000001           wI57b-RiRkC64rteYJ8NIg   1   1          0            0       498b           249b         249b
green  open   .internal.alerts-transform.health.alerts-default-000001            vEXK1U0sSx2JJpBsZWnFqw   1   1          0            0       498b           249b         249b
green  open   .internal.alerts-observability.metrics.alerts-default-000001       XGw6Kh-7SCSduOCkVbbgEw   1   1          0            0       498b           249b         249b
green  open   .internal.alerts-stack.alerts-default-000001                       pwcgpEBRRPmg9n58q2NI8w   1   1          0            0       498b           249b         249b
green  open   .internal.alerts-observability.threshold.alerts-default-000001     3pUdaYydTA-_kSO1jssdCg   1   1          0            0       498b           249b         249b
green  open   .internal.alerts-ml.anomaly-detection.alerts-default-000001        mzQiaoXqTlqZsRUZSQUZng   1   1          0            0       498b           249b         249b
green  open   .internal.alerts-default.alerts-default-000001                     mzePAaw-T2ik7QIM1qi4MA   1   1          0            0       498b           249b         249b
green  open   .internal.alerts-security.alerts-default-000001                    BojyH-SsSW-tZ5XjXJO-jA   1   1          0            0       498b           249b         249b
green  open   .internal.alerts-ml.anomaly-detection-health.alerts-default-000001 h48oLRQcSIC-8_ATaoGcnA   1   1          0            0       498b           249b         249b
green  open   .kibana-observability-ai-assistant-conversations-000001            elC8FMnRQ7-KbvXIoiz0xw   1   1          0            0       498b           249b         249b
green  open   .internal.alerts-observability.uptime.alerts-default-000001        SPqoSs-rSnml9SWLSAYwvQ   1   1          0            0       498b           249b         249b
green  open   filebeat-8.15.0-2025.11.12                                         fnc-Xg-1T7yCi1z9W5zFlQ   1   1         16            0    407.2kb         86.9kb       86.9kb# 查看具体索引内容
[root@es1 certs]# curl -k -u elastic:123456 -X GET "https://es1:9200/filebeat-8.15.0-2025.11.12/_search?pretty"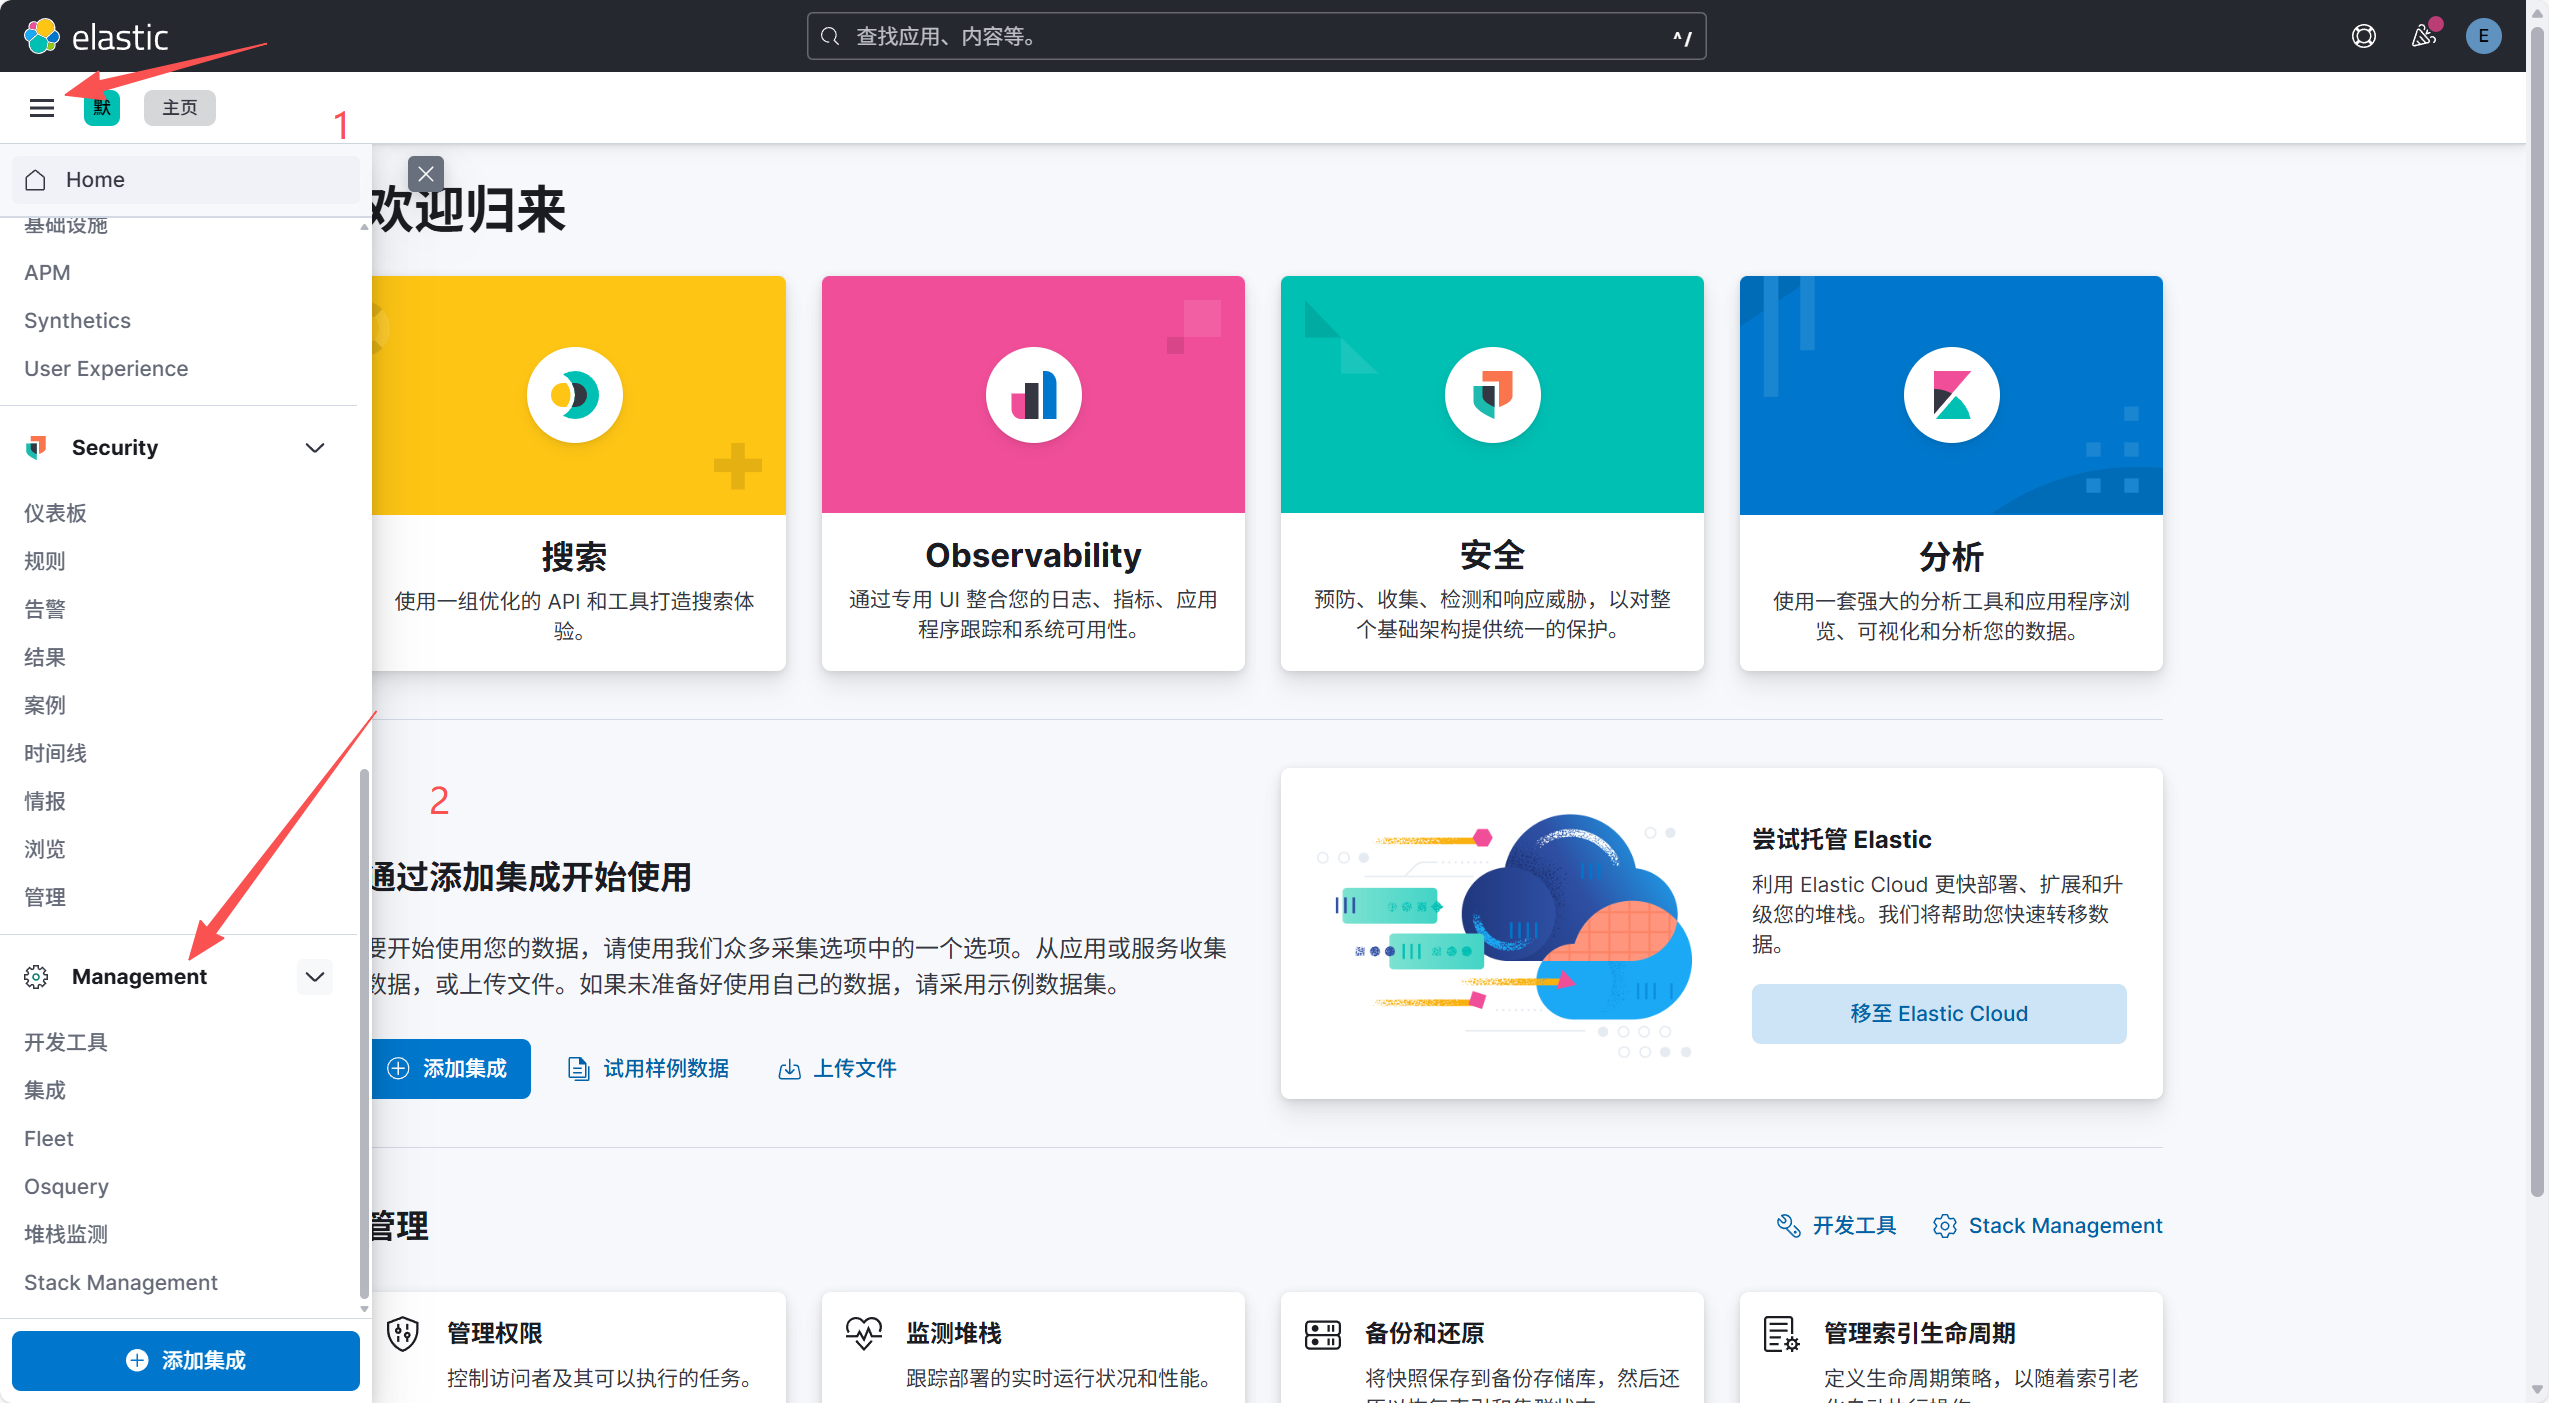
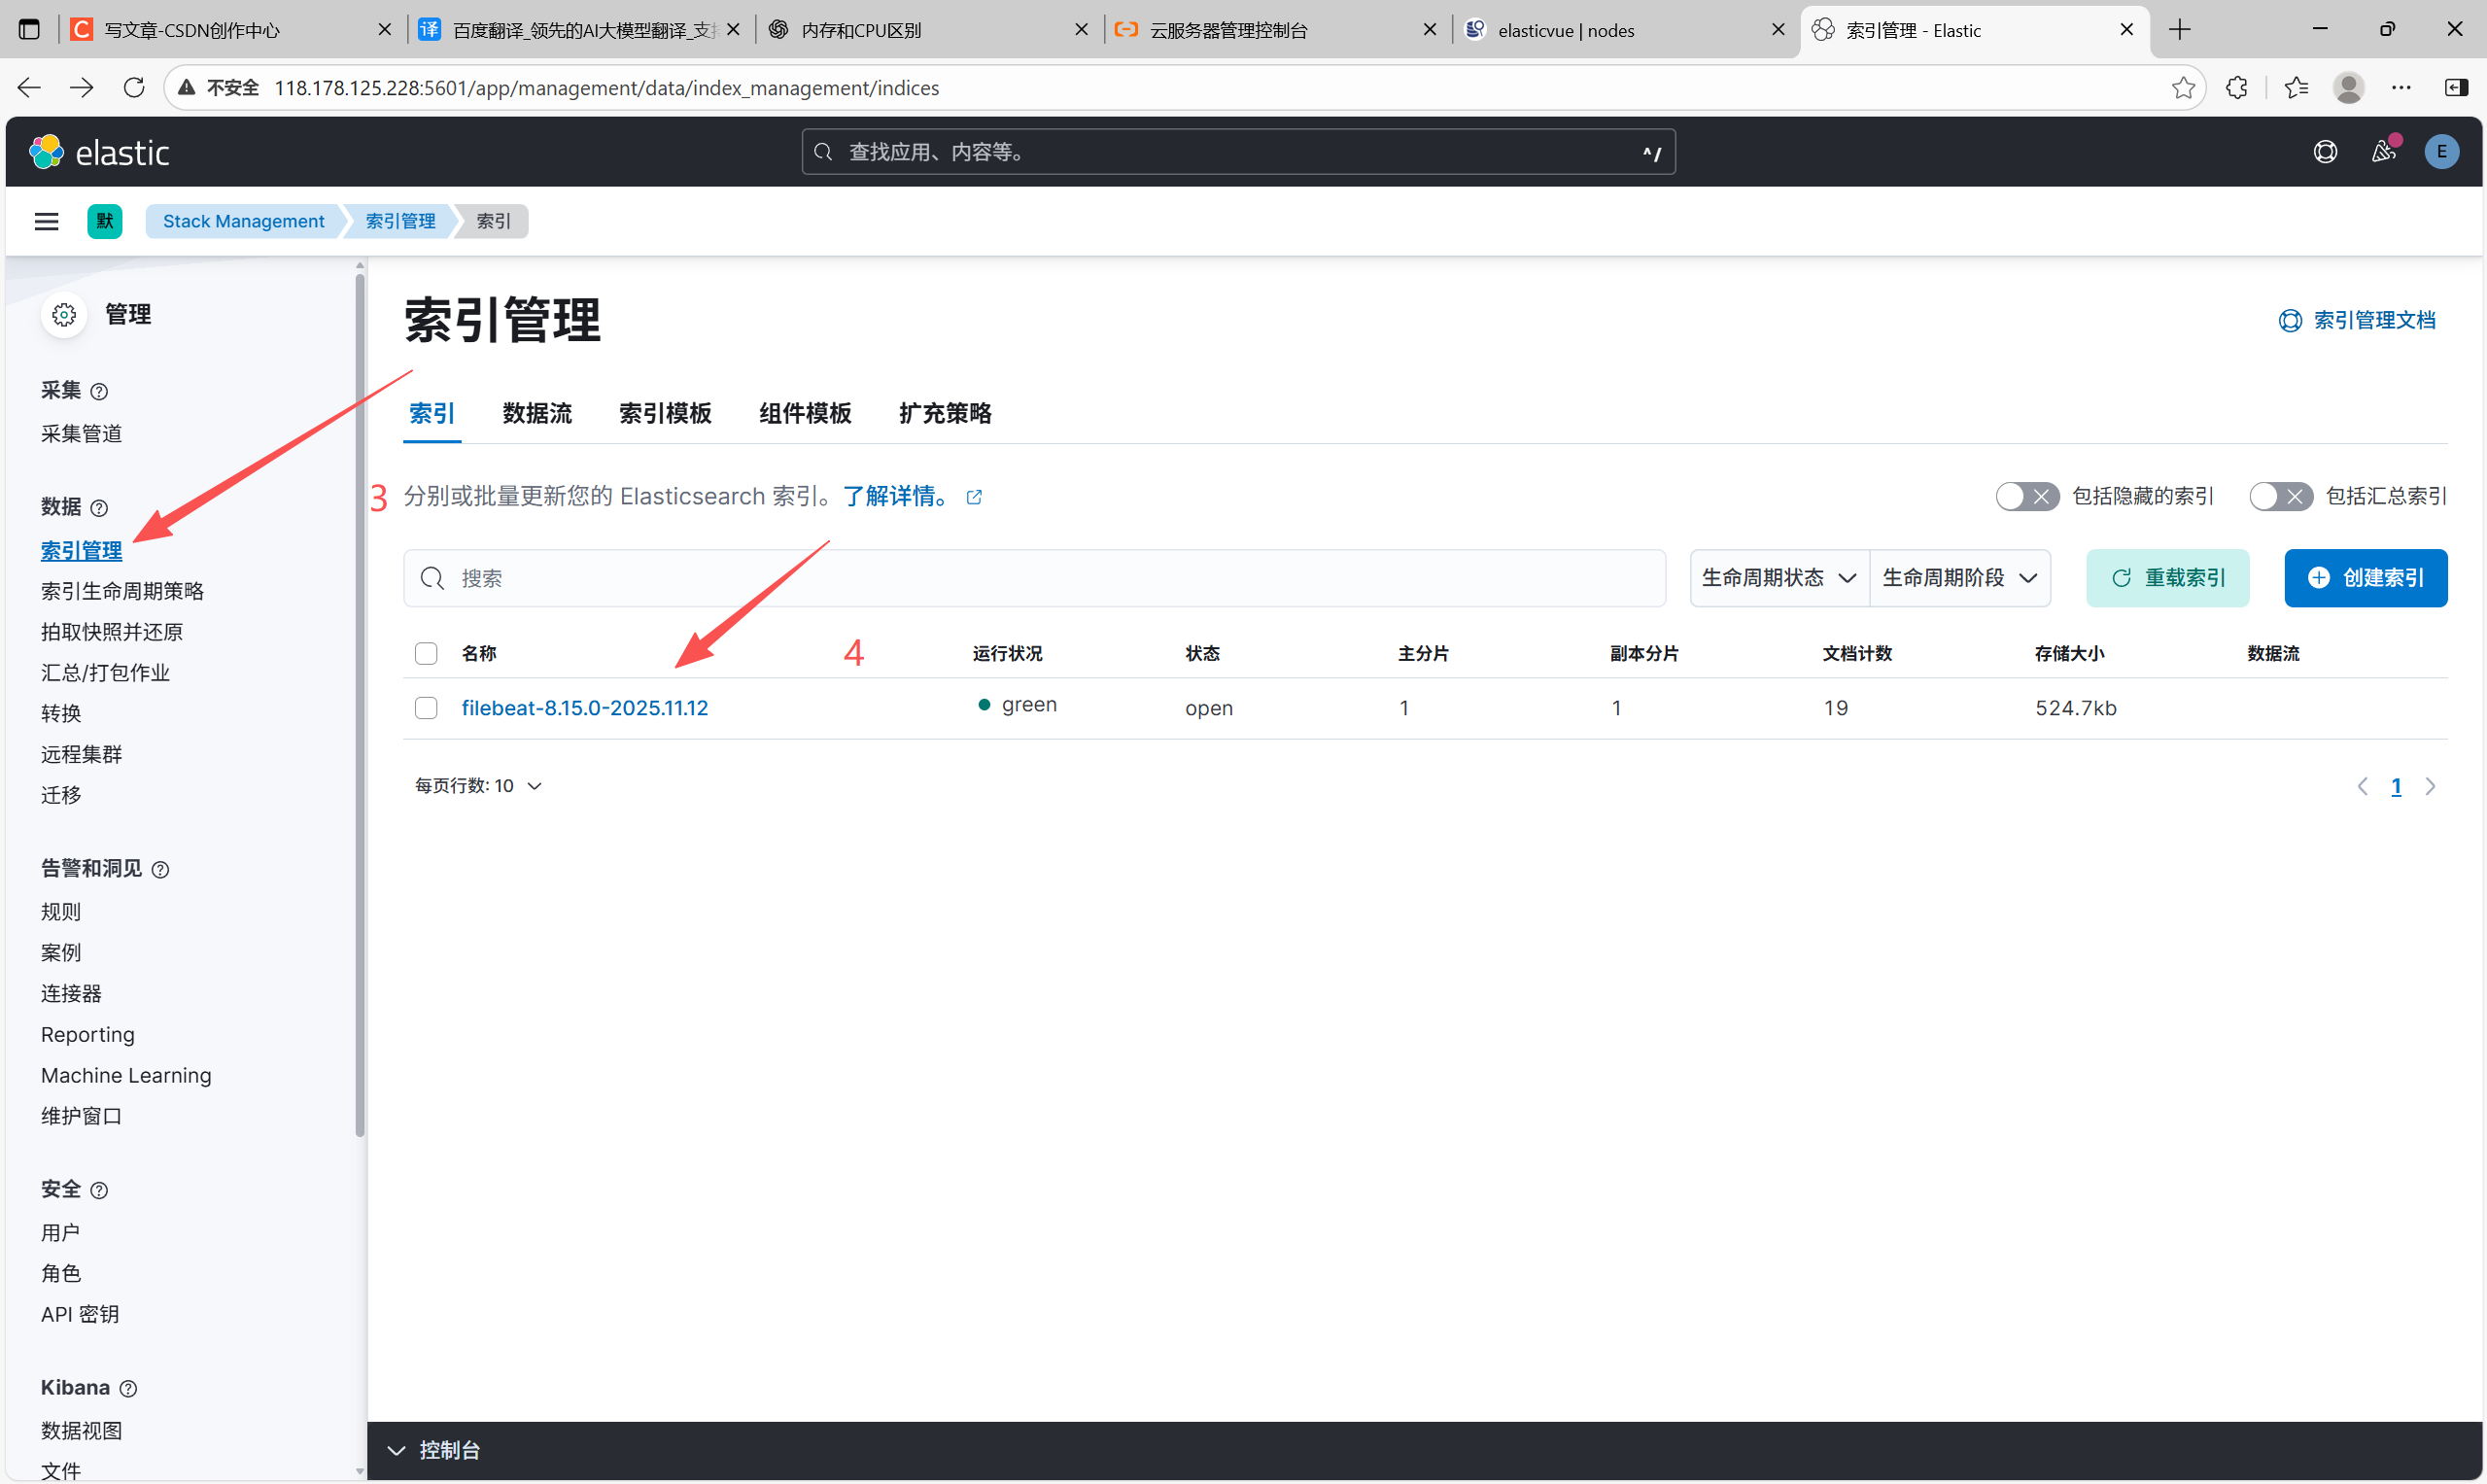
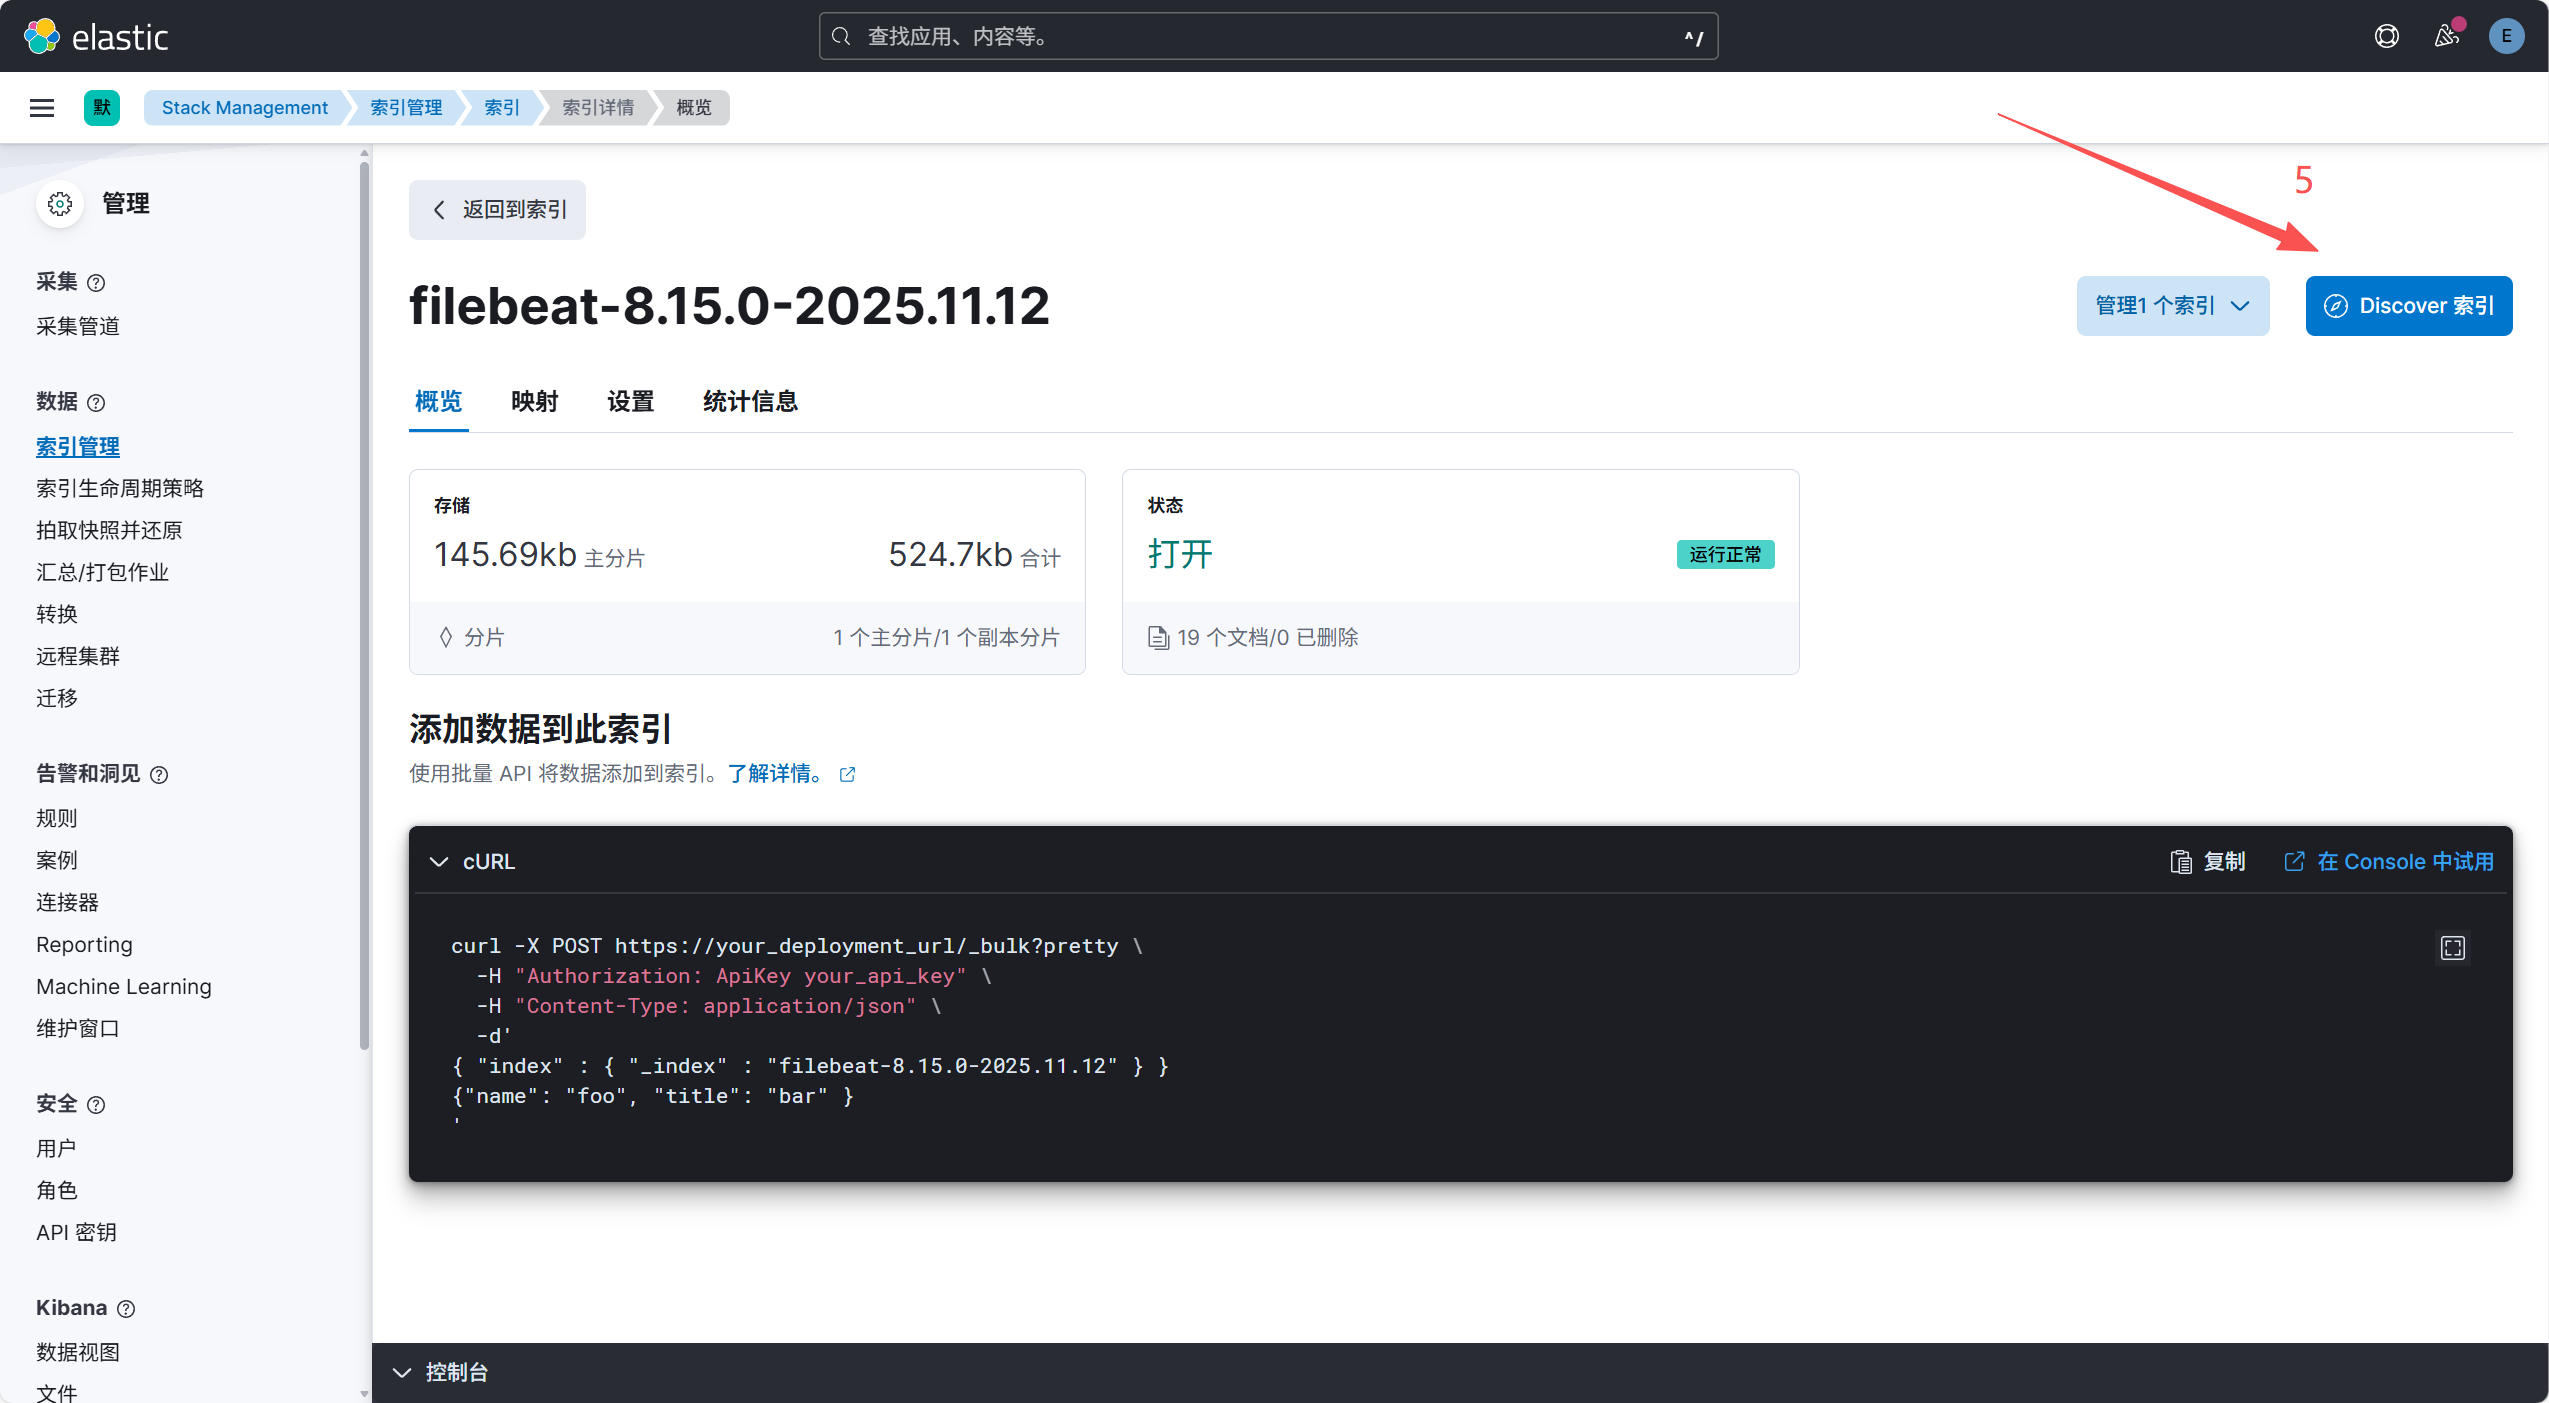
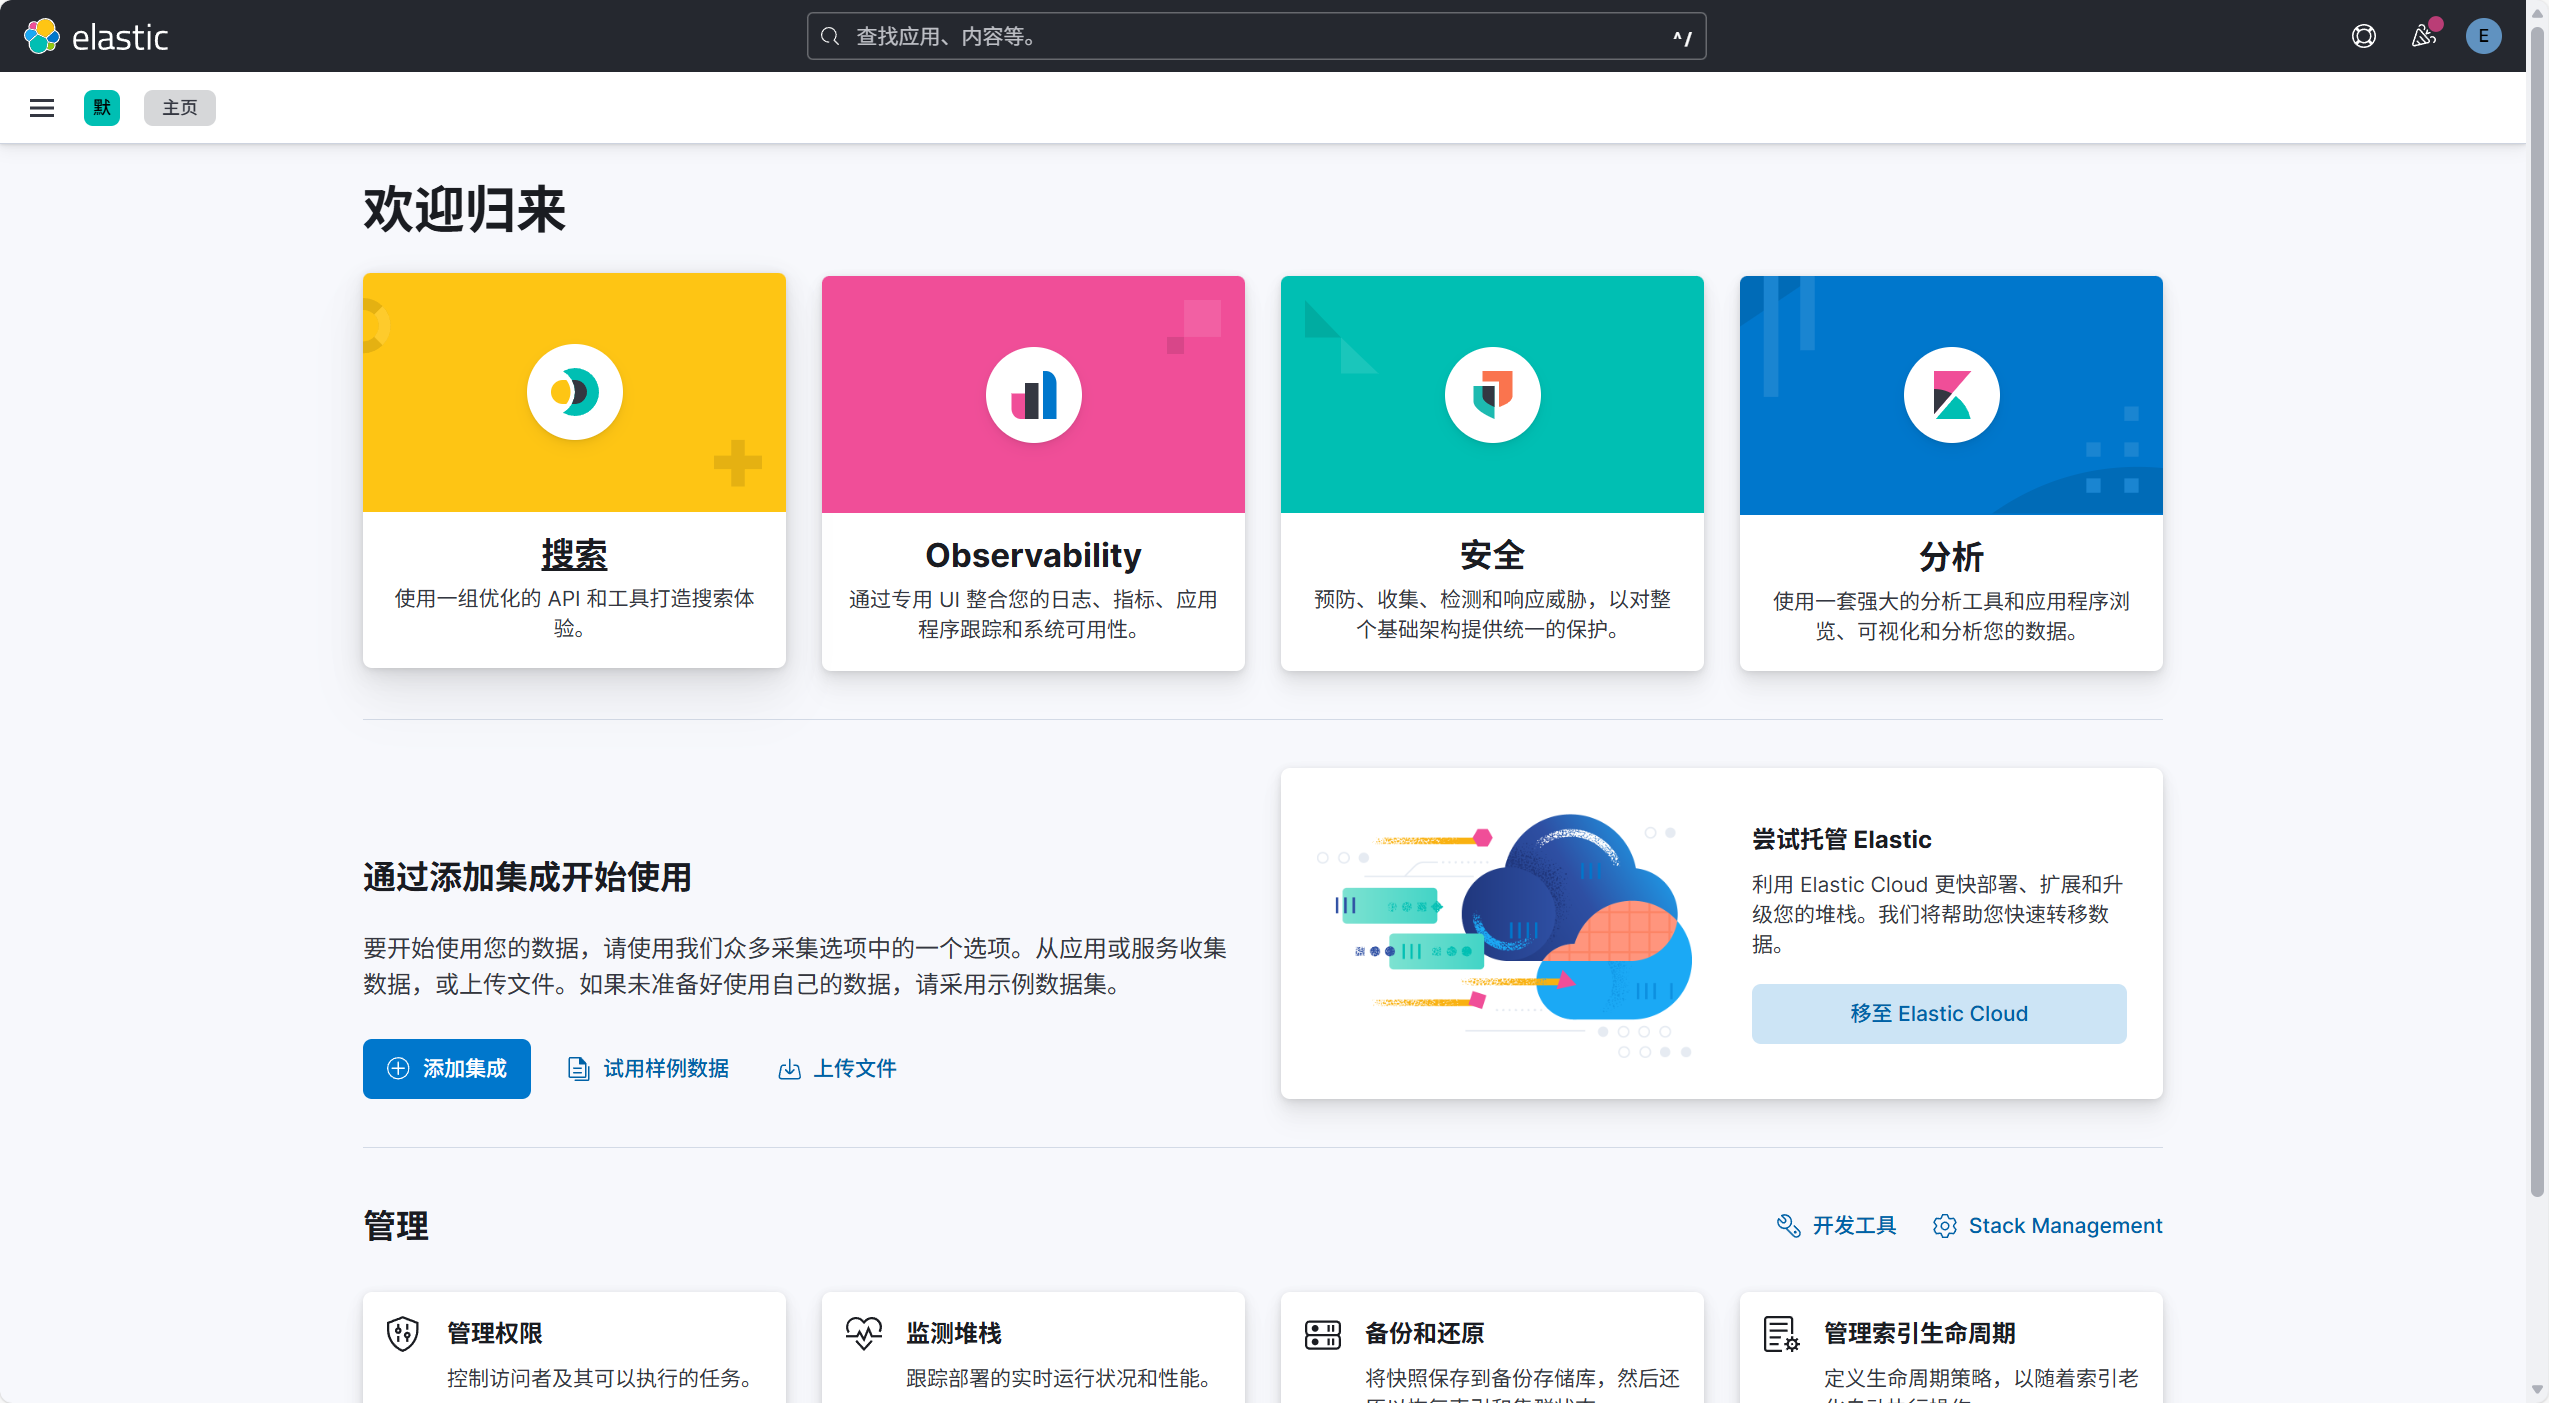
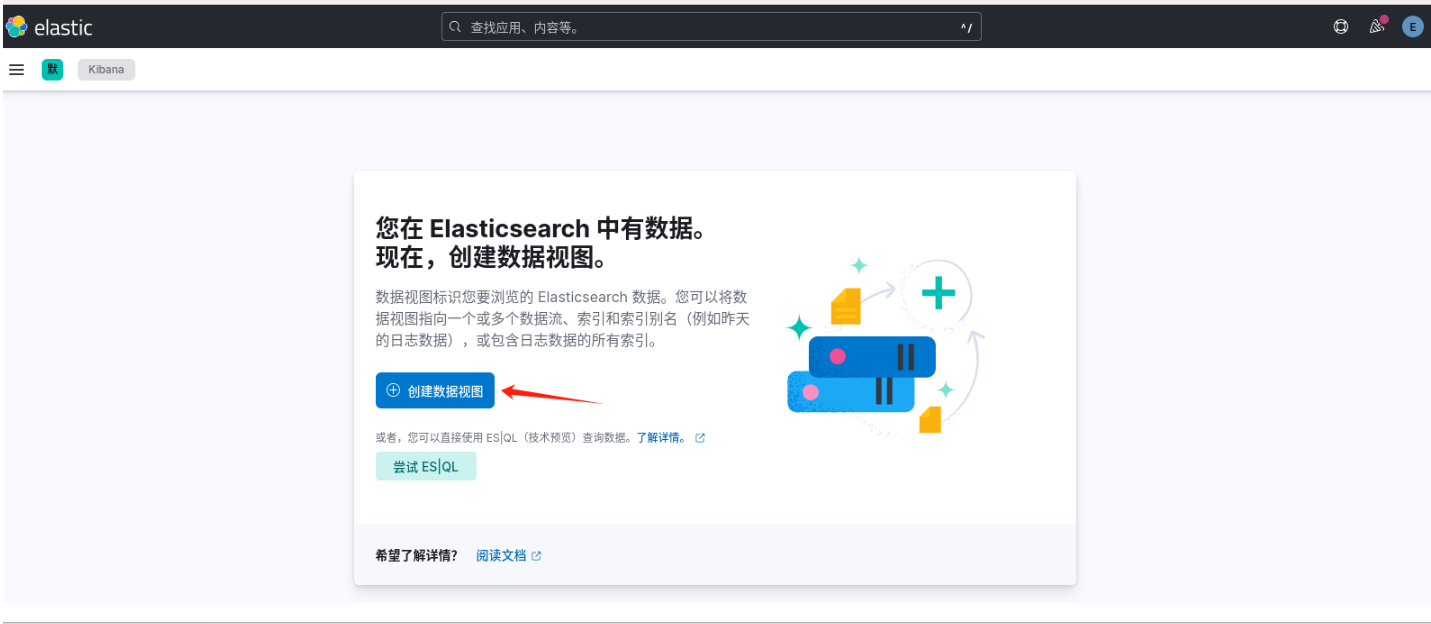
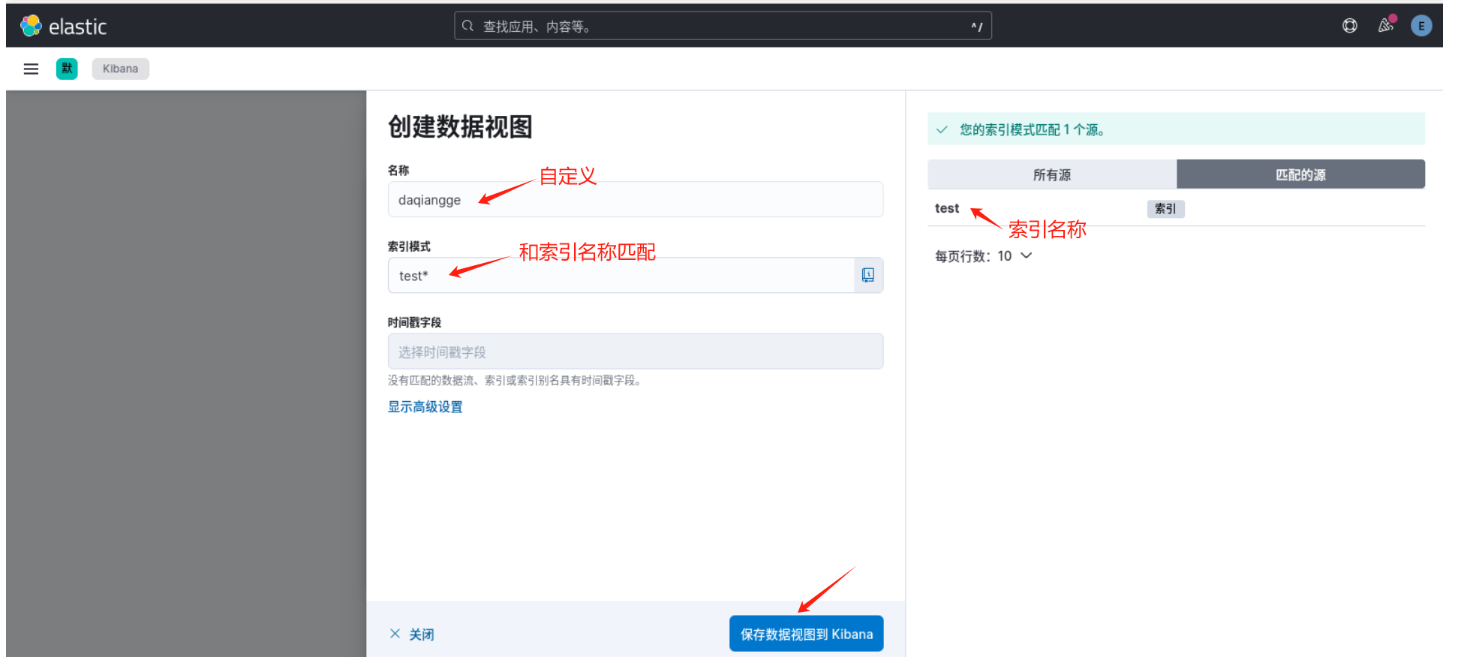
创建数据视图
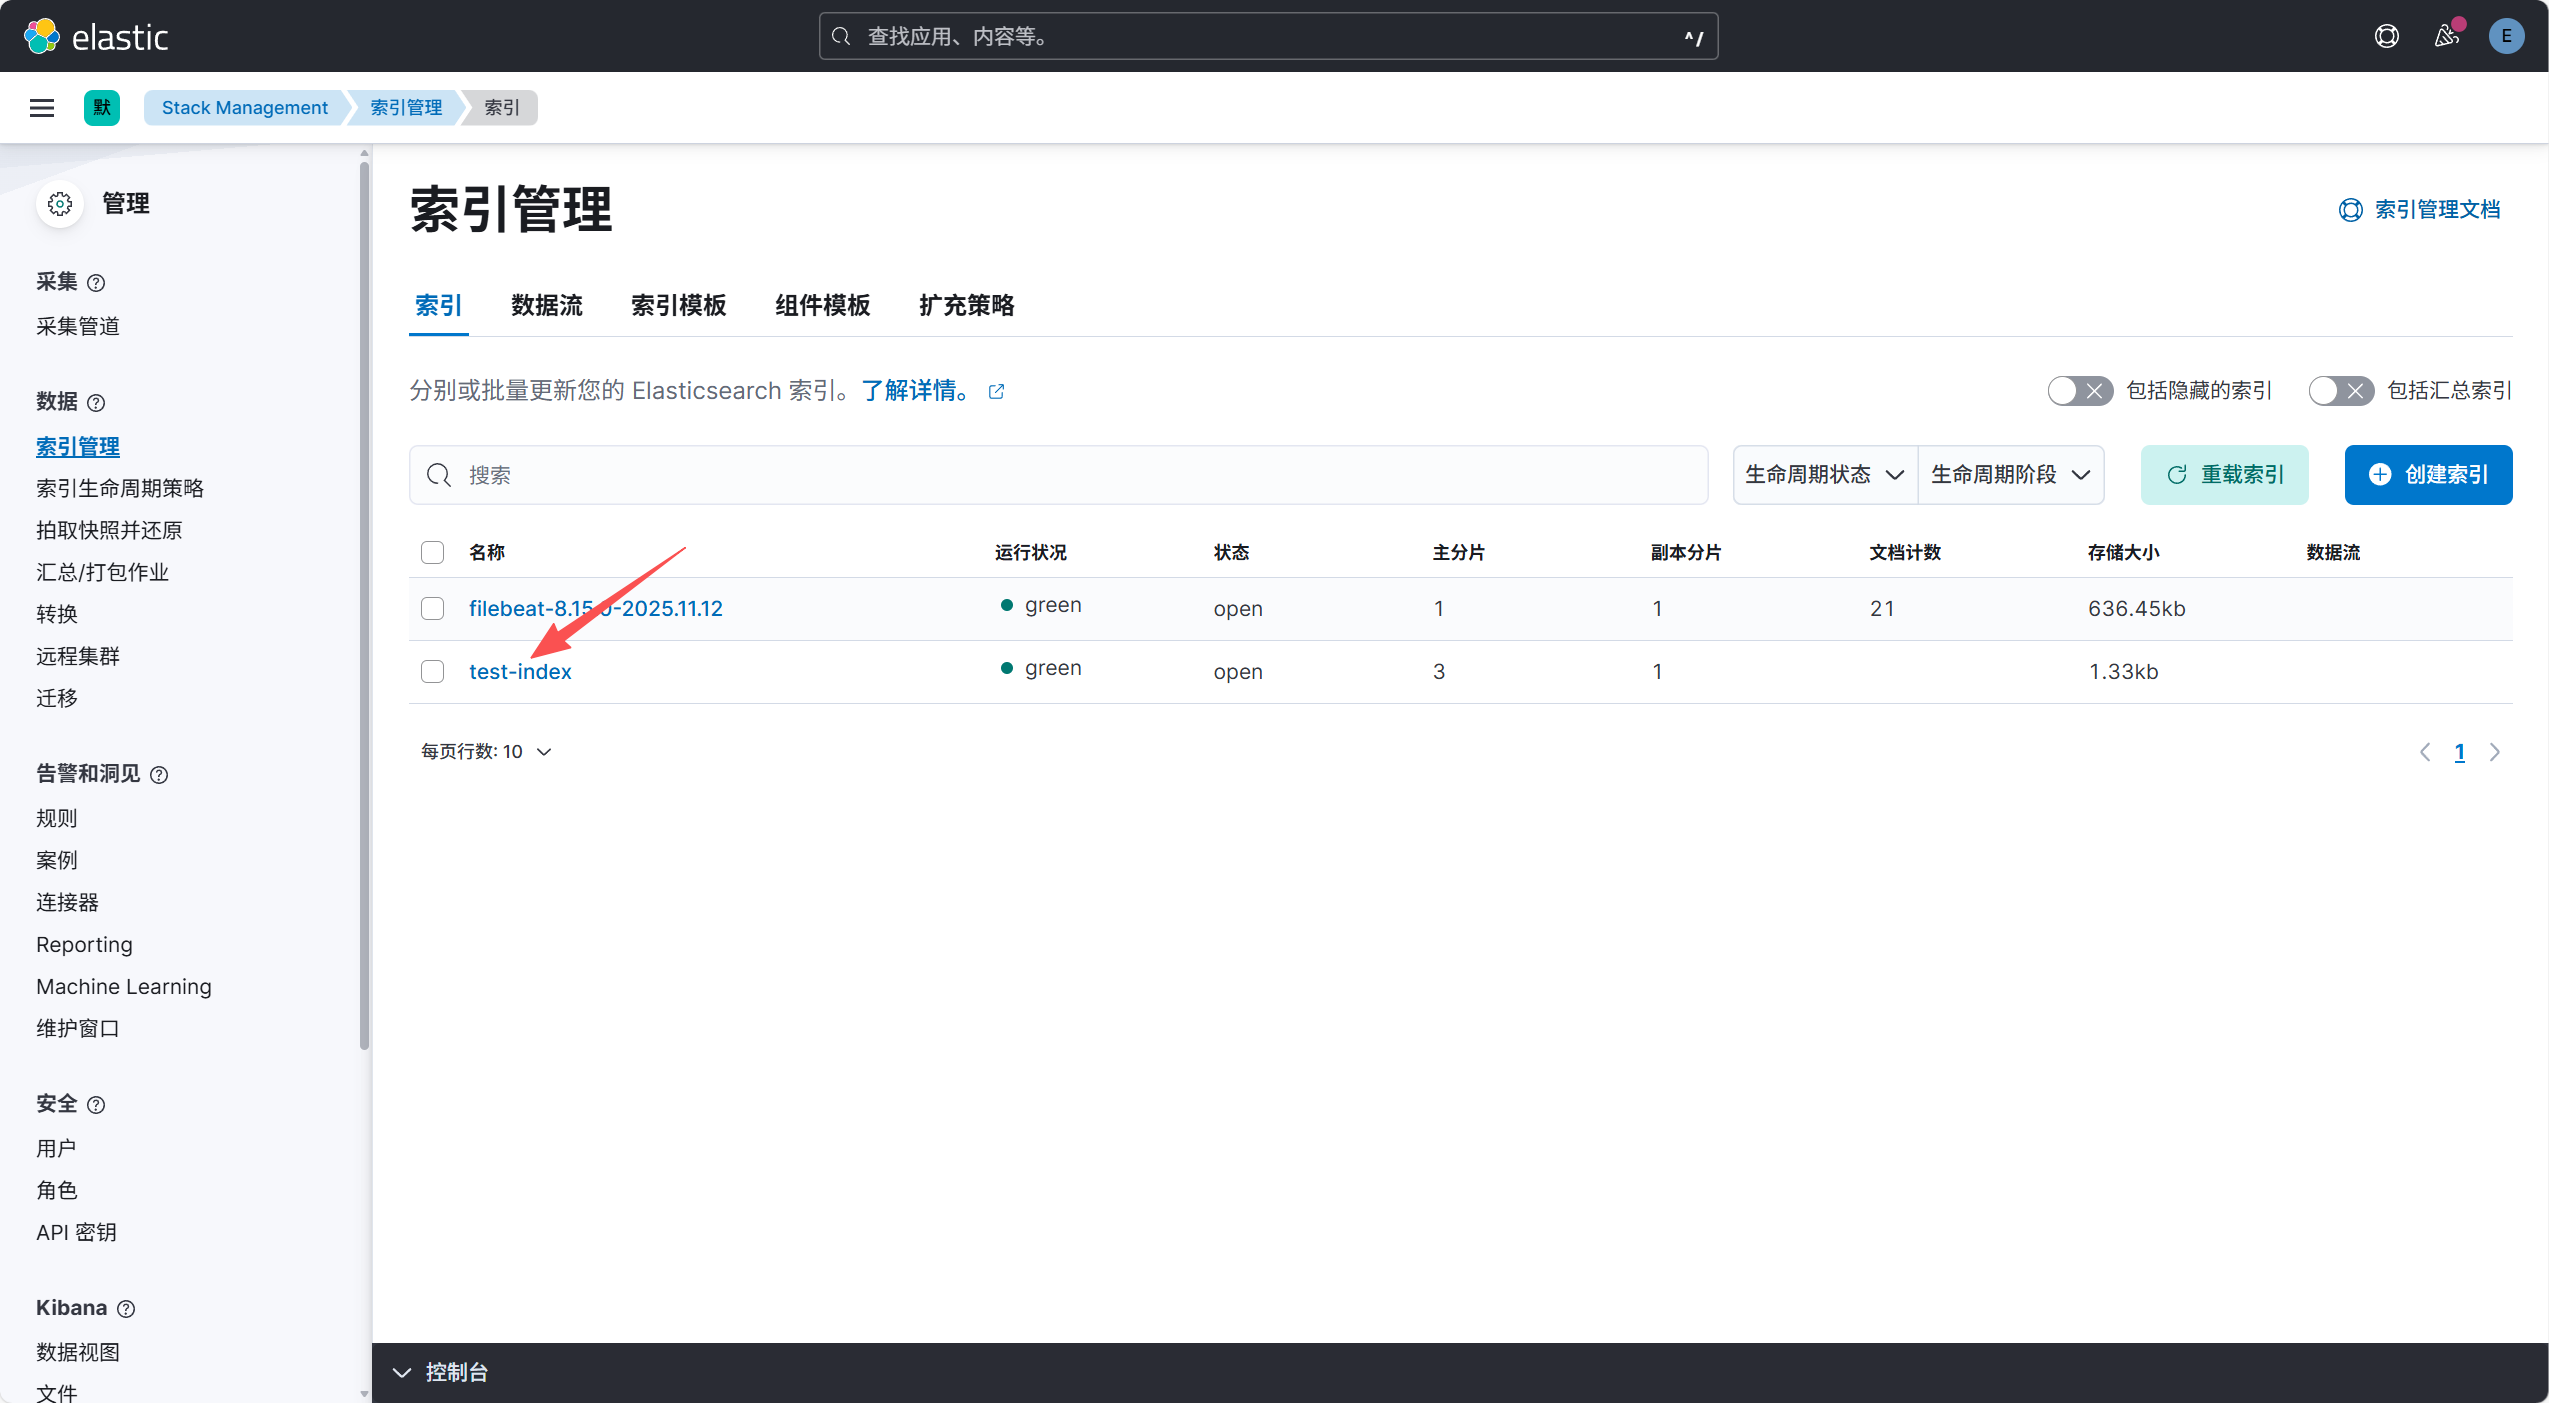
4. 创建索引
[root@es1 certs]# curl -k -u elastic:123456 -X PUT "https://es1:9200/test-index" \
> -H 'Content-Type: application/json' \
> -d '{
>   "settings": {
>     "number_of_shards": 3,
>     "number_of_replicas": 1
>   },
>   "mappings": {
>     "properties": {
>       "timestamp": { "type": "date" },
>       "message":   { "type": "text" },
>       "host":      { "type": "keyword" }
>     }
>   }
> }'
{"acknowledged":true,"shards_acknowledged":true,"index":"test-index"}[root@es1 certs]# # 查看所有索引
[root@es1 certs]# curl -k -u elastic:123456 -X GET "https://es1:9200/_cat/indices?v"
health status index                                                              uuid                   pri rep docs.count docs.deleted store.size pri.store.size dataset.size
green  open   .internal.alerts-ml.anomaly-detection-health.alerts-default-000001 h48oLRQcSIC-8_ATaoGcnA   1   1          0            0       498b           249b         249b
green  open   .kibana-observability-ai-assistant-kb-000001                       dqJFmVcnSSqFnNE5Yi3ufg   1   1          0            0       498b           249b         249b
green  open   .internal.alerts-observability.uptime.alerts-default-000001        SPqoSs-rSnml9SWLSAYwvQ   1   1          0            0       498b           249b         249b
green  open   filebeat-8.15.0-2025.11.12                                         fnc-Xg-1T7yCi1z9W5zFlQ   1   1         21            0    636.2kb        201.4kb      201.4kb
green  open   .kibana-observability-ai-assistant-conversations-000001            elC8FMnRQ7-KbvXIoiz0xw   1   1          0            0       498b           249b         249b
green  open   .internal.alerts-observability.metrics.alerts-default-000001       XGw6Kh-7SCSduOCkVbbgEw   1   1          0            0       498b           249b         249b
green  open   test-index                                                         1xWMps4XTsuIzyM9BD91Uw   3   1          0            0      1.3kb           681b         681b
green  open   .internal.alerts-ml.anomaly-detection.alerts-default-000001        mzQiaoXqTlqZsRUZSQUZng   1   1          0            0       498b           249b         249b
green  open   .internal.alerts-observability.apm.alerts-default-000001           CNxHx4QQTTeoFfLx6ycc_A   1   1          0            0       498b           249b         249b
green  open   .internal.alerts-observability.slo.alerts-default-000001           wI57b-RiRkC64rteYJ8NIg   1   1          0            0       498b           249b         249b
green  open   .internal.alerts-stack.alerts-default-000001                       pwcgpEBRRPmg9n58q2NI8w   1   1          0            0       498b           249b         249b
green  open   .internal.alerts-security.alerts-default-000001                    BojyH-SsSW-tZ5XjXJO-jA   1   1          0            0       498b           249b         249b
green  open   .internal.alerts-transform.health.alerts-default-000001            vEXK1U0sSx2JJpBsZWnFqw   1   1          0            0       498b           249b         249b
green  open   .internal.alerts-observability.logs.alerts-default-000001          iuSBxgs9QYSvWWievi_NUA   1   1          0            0       498b           249b         249b
green  open   .internal.alerts-default.alerts-default-000001                     mzePAaw-T2ik7QIM1qi4MA   1   1          0            0       498b           249b         249b
green  open   .internal.alerts-observability.threshold.alerts-default-000001     3pUdaYydTA-_kSO1jssdCg   1   1          0            0       498b           249b         249b