一种用于乳腺癌风险预测的新型时间衰减影像组学整合网络(TRINet)|文献速递-文献分享
Title
题目
A new time-decay radiomics integrated network (TRINet) for breast cancer risk prediction
一种用于乳腺癌风险预测的新型时间衰减影像组学整合网络(TRINet)
01
文献速递介绍
乳腺癌风险预测相关研究进展与TRINet模型介绍 为制定有效的乳腺癌筛查方案和个性化风险评估模型,相关需求已十分明确(Dadsetan 等,2022;Lee 等,2023;Yala 等,2021b;Yeoh 等,2023)。然而,当前的筛查方案具有通用性,基于固定流程和宽泛的风险类别(Ren 等,2022)。这可能导致过度筛查,对癌症低风险人群造成假阳性、不必要的焦虑及过度治疗等伤害(Bond 等,2013;Habib 等,2021;Salz 等,2010)。相反,这类固定筛查方案也可能导致高风险女性筛查不足,遗漏早期癌症迹象,致使癌症确诊过晚。 在美国,美国癌症协会(Smith 等,2019)、美国医师学会(Qaseem 等,2007)等机构针对女性乳腺钼靶筛查指南提出了多项建议,包括筛查起始时间和筛查频率。这些建议的共性在于,均推荐女性在人生的特定阶段按一定频率进行筛查(Qaseem 等,2007;Smith 等,2019)。目前已有多种风险模型用于评估普通人群的风险,如 Tyrer-Cuzick 模型(Cuzick,2004)、乳腺癌监测联盟模型(Tice 等,2008,2015)和 Gail 模型(Gail 等,1989)。这些模型在风险评估中纳入了人口统计学和临床风险因素,例如年龄、乳腺癌家族史、种族、遗传学特征以及乳腺钼靶密度。但这些临床常用模型在区分癌症风险方面表现仅处于中等水平,受试者工作特征曲线下面积(AUC)结果低于 70%(Cuzick,2004;Gail 等,1989;Tice 等,2008,2015)。 尽管近期人工智能(AI)研究表明,利用乳腺钼靶数据可显著提升模型性能(Arasu 等,2023),但基于图像的风险评估模型在当前临床实践中仍未得到充分应用。深度学习领域的最新进展使我们能够构建直接分析乳腺钼靶图像的风险评估模型,其性能较传统模型有显著提升(Dadsetan 等,2022;Lee 等,2023;Lotter 等,2021;McKinney 等,2020;Yala 等,2021b)。这类模型采用卷积神经网络(CNN)学习图像中的模式,性能优于使用人工提取特征的传统模型(Gastounioti 等,2016;Tan 等,2019,2016)。 尽管这些模型较以往传统方法有所改进,但当前模型的主要局限性之一在于,它们仅能分析单张静态乳腺钼靶图像,忽略了多次筛查中乳腺钼靶图像变化的时间演进过程(Donnelly 等,2024;Lotter 等,2021;McKinney 等,2020;Tan 等,2019;Yala 等,2021b)。由于癌症是一个动态过程,乳腺组织的结构变化会随时间逐渐发展,捕捉这些变化的序列乳腺钼靶图像中包含识别新发癌症风险的关键信息。若不纳入时间维度数据,当前模型可能会遗漏风险进展中细微却关键的迹象,进而限制其预测能力。文献中已有多项研究(Dadsetan 等,2022;Lee 等,2023;Yeoh 等,2023)在模型训练中纳入了既往乳腺钼靶筛查数据。 当前风险模型的另一项不足是,尽管实质纹理特征和深度学习特征均已被证实对风险评估有益,但仅有少数研究在模型中结合了影像组学特征与深度学习特征(Yeoh 等,2023)。结合这两类特征最简单的方法是在全连接(FC)层中将它们拼接(Yeoh 等,2023)。然而,仍需探索更先进、更优的方法(Bahdanau 等,2014;Ilse 等,2018)来融合这些特征,以最大限度发挥两类特征的优势,并合成新的特征组合,从而提升模型性能。此外,仅利用头尾位(CC)或内外侧斜位(MLO)单一视图(Arefan 等,2019;Carneiro 等,2015)生成最终风险预测分数的模型,性能不如结合两种视图的模型。对此,本文提出一种新模型,该模型结合两种视图的四张图像中基于序列影像组学和深度学习的图像特征,为每位患者生成最终的综合风险分数。 此外,尽管人们强烈建议采用个性化筛查方案,以避免女性过度筛查或筛查不足,但迄今为止,所有风险模型均未将此类信息纳入其中,无法在风险预测方案中更好地对女性进行风险分层。本文提出一种新的时间间隔嵌入方法,用于在特征空间中实现更优的风险分类,该方法可预测 6 个月至 5 年内的癌症发生风险。纳入这种新的时间嵌入方法,有助于将女性分为不同的个性化筛查方案:对于短期癌症风险较低的女性,可延长下次筛查间隔(如 3 年后再筛查),避免过度筛查;对于存在可疑迹象、短期癌症风险较高的女性,可缩短下次筛查间隔(如 6 个月后再筛查),避免筛查不足。 当前不仅风险预测方案存在问题,医疗领域的人工智能方案也普遍面临一个问题:现有方法的全部潜力可能因无法持续学习而受到限制(Liu 等,2024;Wang 等,2023)。当前的风险预测模型仅在单一人口统计学群体的单一数据集上训练,例如瑞典人群(Yeoh 等,2023)、美国人群(Yala 等,2021b)或亚洲人群(Tan 等,2019)。若获得新的数据集,而训练后的模型因灾难性遗忘无法通过持续学习方法扩充知识,将是极大的遗憾——尤其考虑到获取任何数据集的伦理许可等流程都极具挑战性。为解决这一问题,本文提出一种新方法,可使模型利用不同人群的新数据集持续学习、扩充知识,同时不会灾难性遗忘其在原始数据集上习得的知识。 另外,双侧不对称性(即左右乳房实质组织的差异)是已知的风险因素,因为随着时间推移,癌症通常仅在一侧乳房发生(Tan 等,2016;Zheng 等,2012)。但除少数模型外(Donnelly 等,2024;Tan 等,2016;Yeoh 等,2023),多数风险模型并未将这一指标纳入模型作为预测因子。本研究提出一种测量双侧不对称性的新方法,并将其与持续学习方法相结合,以提升模型性能。结果表明,采用该新方法后,模型可在新数据集上持续学习并提升性能,同时不会灾难性遗忘原始数据集的相关知识。 因此,为克服上述所有局限性,本文提出一种时间衰减影像组学整合网络(TRINet)。这是一种新型深度学习癌症风险模型,其创新贡献如下: 1. 为非局部(Non-Local)模块(Wang 等,2018)和快速转换器(Fastformer)模块(Wu 等,2021)提出一种新的时间衰减(TD)注意力机制。尽管时间衰减注意力机制可同时提升非局部模块和快速转换器模块的性能,但将其应用于快速转换器模块时,整体性能更优。 2. 提出一种新的基于影像组学和深度学习特征的多实例学习(RADMIL)方法,以有效整合和融合深度学习特征与影像组学特征。RADMIL 方法利用注意力机制,以可解释且高效的方式整合左右乳房头尾位(CC)和内外侧斜位(MLO)视图的特征。 3. 提出一种新的癌症预测网络,该网络纳入时间间隔嵌入,用于以 6 个月为间隔(即 6 个月至 5 年)进行风险预测。在这种新方法中,引入时间嵌入加性风险层用于风险预测。时间嵌入为风险模型提供背景信息,有助于更好地预测个性化筛查间隔。 4. 提出一种基于持续学习的新自训练方法,称为带持续学习的强化自训练(ReSTCL)。ReSTCL 方法可使模型在新数据集上持续学习新知识,同时不会灾难性遗忘原始数据集的知识。为从次级数据集中筛选出用于微调的有效样本,需计算双侧不对称性特征,并对模型进行迭代训练。结果表明,模型可在不同人群的次级数据集上获取新知识,同时不会灾难性遗忘原始数据集的既往知识。 要不要我帮你整理一份**TRINet模型核心创新点与传统模型对比表**,更清晰地呈现该模型的优势?
Aastract
摘要
To facilitate early detection of breast cancer, there is a need to develop risk prediction schemes that can prescribe personalized screening mammography regimens for women. In this study, we propose a new deep learning architecture called TRINet that implements time-decay attention to focus on recent mammographic screenings, as current models do not account for the relevance of newer images. We integrate radiomic features with an Attention-based Multiple Instance Learning (AMIL) framework to weigh and combine multiple views for better risk estimation. In addition, we introduce a continual learning approach with a new label assignment strategy based on bilateral asymmetry to make the model more adaptable to asymmetrical cancer indicators. Finally, we add a time-embedded additive hazard layer to perform dynamic, multi-year risk forecasting based on individualized screening intervals. We used two public datasets, namely 8528 patients from the American EMBED dataset and 8723 patients from the Swedish CSAW dataset in our experiments. Evaluation results on the EMBED test set show that our approach performs comparably with state-of-the-art models, achieving AUC scores of 0.851, 0.811, 0.796, 0.793, and 0.789 across 1-, 2-, to 5-year intervals, respectively. Our results underscore the importance of integrating temporal attention, radiomic features, time embeddings, bilateral asymmetry, and continual learning strategies, providing a more adaptive and precise tool for breast cancer risk prediction.
为促进乳腺癌的早期检测,有必要开发风险预测方案,为女性制定个性化的乳腺钼靶筛查方案。本研究提出一种名为TRINet的新型深度学习架构,该架构通过时间衰减注意力机制聚焦近期的乳腺钼靶筛查图像——现有模型尚未考虑新图像的相关性。 我们将影像组学特征与基于注意力的多实例学习(AMIL)框架相结合,对多视图图像进行权重分配与融合,以实现更优的风险评估。此外,我们引入持续学习方法,并设计基于双侧不对称性的新标签分配策略,使模型更能适应不对称的癌症指标。最后,我们添加时间嵌入加性风险层,基于个性化筛查间隔实现动态的多年期风险预测。 实验使用了两个公开数据集:美国EMBED数据集的8528名患者,以及瑞典CSAW数据集的8723名患者。在EMBED测试集上的评估结果显示,该方法性能与当前最先进模型相当,在1年、2年至5年的预测周期内,AUC值分别达到0.851、0.811、0.796、0.793和0.789。 研究结果强调了整合时间注意力、影像组学特征、时间嵌入、双侧不对称性及持续学习策略的重要性,为乳腺癌风险预测提供了一种更具适应性和精准性的工具。 要不要我帮你整理一份该研究核心信息的精简摘要表格,方便快速抓取关键内容?
Method
方法
3.1. Datasets
Two datasets were examined in this study, namely the Emory Breast Imaging Dataset (EMBED) and the Cohort of Screen-Aged Women (CSAW) datasets. All mammograms that were used in this study are twodimensional (2D) full-field digital mammography (FFDM) images and were not 2D synthetic mammograms from digital breast tomosynthesis (DBT). Both invasive cancers and ductal carcinoma in situ (DCIS) cancers are included as cases in both datasets (Dembrower et al., 2020; Jeong et al., 2023).For both datasets, the following timepoints were used for cases and controls: For cases, the “current” timepoint is defined as the screening exam that led to the cancer diagnosis. For the “prior” timepoints, we applied a sliding window approach across longitudinal screening exams to generate all valid prior–current pairs within the 1 to 5-year interval. For controls, the “current” time point is the earliest screening exam that did not have screen-detected cancer, whereas the “prior” time point is the closest screening exam 1 to 5 years before that. This consistent time point pairing enables the model to learn from temporal changes in breast tissue. For patients with multiple prior exams, all current-prior combinations were used. This allows us to fully utilize longitudinal data and supports more robust modeling of temporal changes.
3.1 数据集说明 本研究采用了两个数据集,分别是埃默里乳腺成像数据集(EMBED)和筛查年龄女性队列数据集(CSAW)。研究中使用的所有乳腺钼靶图像均为二维(2D)全视野数字乳腺钼靶(FFDM)图像,而非来自数字乳腺断层合成(DBT)的二维合成乳腺钼靶图像。两个数据集的病例均包含浸润性癌和导管原位癌(DCIS)(Dembrower 等,2020;Jeong 等,2023)。 对于两个数据集,病例组和对照组的时间点定义如下: - 病例组:“当前”时间点定义为最终确诊癌症的那一次筛查检查。“既往”时间点则采用滑动窗口法,在纵向筛查检查中筛选出与“当前”时间点间隔1-5年内的所有有效“既往-当前”时间点对。 - 对照组:“当前”时间点定义为最早一次未筛查出癌症的检查。“既往”时间点则定义为该“当前”时间点前1-5年内最近的一次筛查检查。 这种统一的时间点配对方式,能让模型从乳腺组织的时间变化中学习。对于有多次既往检查的患者,研究使用了所有“当前-既往”时间点组合,以充分利用纵向数据,为时间变化的稳健建模提供支持。 要不要我帮你整理一份EMBED与CSAW数据集核心信息对比表,更清晰呈现两者的共性与时间点定义逻辑?
Conclusion
结论
We developed a new risk prediction model that incorporates unique characteristics to address current limitations in existing risk predictionmodels. Current clinical risk prediction models based on statistical data, including Tyrer-Cuzick (Cuzick, 2004) and Gail (Gail et al., 1989), are population-based models with modest discriminatory performance at the individual level. In the last decade, new risk models that assess riskfrom screening mammograms have been developed that produce higher AUC results than these conventional models (Tan et al., 2016; Yala et al., 2021b).The new models that assess risk from screening mammograms can generally be divided into two groups: 1) Earlier models based on radiomic, texture, and mammographic density-based features (Gastounioti et al., 2016; Tan et al., 2016); 2) Later models trained on deep learning-based features (Dadsetan et al., 2022; Karaman et al., 2024; Yala et al., 2021b). The earlier texture and mammographic density models had better discriminatory power than the conventional statistical risk models with reported AUC results of around 70 % or higher (Gastounioti et al., 2016). The more recent deep learning models have produced models with even better discriminatory capacity with reported AUC results of around 80 % or higher (Karaman et al., 2024; Yala et al., 2021b). The performance improvements observed with deep learning models demonstrate their potential in this field. It would be highly beneficial if new, more accurate deep learning-based models could be developed that improve the discriminatory power of current models.More recently, deep learning models that predict short and long-term risk prediction have emerged (Karaman et al., 2024; Yala et al., 2021b). These models are very useful as they can be used effectively to predict the individualized risk of cancer occurring in a woman in 1 to 5 years’ time. In doing so, personalized screening regimens can be prescribed to individual women based on features extracted from their recent screening mammograms. Unlike previous statistical-based models that predict the lifetime risk of developing breast cancer, these models are based on mammographic features that can vary over time due to lifestyle changes, such as alcohol consumption, HRT, etc., and are thus more accurate in predicting short and long-term risks of developing cancer. These models are also very useful as individualized screening programs can prevent both over-screening and under-screening of women – If a woman undergoes screening more frequently than required, this will result in the accumulation of unnecessary radiation exposure in her body. Conversely, if she has a high short-term risk of developing cancer, she should go earlier for her mammogram so that the cancer can be detected and treated early.This study builds upon the previously mentioned studies and attempts to address the limitations of those works. First, although both groups of parenchymal texture and deep learning-based methods have demonstrated performance improvements individually, few methods have combined both feature groups to develop a comprehensive risk model (Yeoh et al., 2023). Furthermore, the previous work uses conventional methods of integrating both feature groups through concatenation at the FC layer only; what is required is more sophisticated and explainable methods of combining both feature groups. Our work highlights the potential of the new RADMIL method for integrating radiomic with deep learning-based features, proving essential for model prediction enhancement. Using RADMIL, the relative importance of each view can be weighed and aggregated appropriately. Conventionally, the CC view is more informative for computerized methods, whereas MLO is more useful for radiologists; thus, different views provide differing information (Arefan et al., 2019; Mohamed et al., 2017; Tan et al., 2015). RADMIL helps the network focus on relevant views to more accurately predict risk. Instead of focusing on one particular view, the model can decide on its own, through backpropagation training, useful views that provide relevant information for risk prediction.Second, several studies in the literature (Dadsetan et al., 2022; Lee et al., 2023; Yeoh et al., 2023) have incorporated prior mammograms in their risk models. However, as cancer develops over time, it is important to monitor its progression. We have presented new advanced attention mechanisms that focus on time-decay (TD) attention. The TD attention prioritizes information from more recent screenings when extracting features from sequential mammograms compared to previous screenings. Our findings highlight the critical role that incorporating time-sensitive information considerably enhances the effectiveness ofNL and SHIFT attention mechanisms. Models equipped with TD attention consistently outperform their vanilla counterparts, demonstrating that embedding temporal information strengthens the model’s ability to identify patterns relevant to cancer risk across various time intervals.Another limitation of current models is that although implementing a personalized screening regimen is highly recommended, to our knowledge, none of the risk models incorporate this information into their models to better stratify women in a risk prediction scheme. Although Yala et al. (2022) proposed the Tempo-Mirai reinforcement learning-based method to recommend personalized screening intervals, training neural network reinforcement learning methods is challenging (Ding and Dong, 2020), and might be unnecessary for a fixed time-interval screening paradigm. We introduced a novel modification: a time embedding layer within the additive hazard layer model. This time embedding layer adds a temporal sensitivity, which allows the model to account for the timing of previous screenings when predicting future risk. Our approach optimizes the risk scoring mechanism by embedding temporal information directly into the risk model enabling the additive hazard layer to adjust risk assessments in a nuanced manner based on screening intervals.As cancer usually develops in only one breast, methods that detect bilateral asymmetry over time have been investigated for short-term risk prediction (Tan et al., 2016; Zheng et al., 2012). However, not many recent models (Donnelly et al., 2024; Tan et al., 2016; Yeoh et al., 2023) incorporate this information even though it has proven useful for risk assessment. In this study, we incorporated lateral attention into RADMIL to direct the model to focus on which side of the breast would potentially develop cancer over time. While the uniform attention in AMIL allocates equal attention to each view based on their overall contribution to cancer risk, lateral attention, trained through supervised learning, is fine-tuned to detect and highlight signs of cancer development in one breast side versus the other.Fifth, current risk prediction models are only trained on a single demographic population, e.g., a Swedish (Yeoh et al., 2023), American (Yala et al., 2021), or Asian (Tan et al., 2019) population. We hereby present a new method, called ReSTCL that enables a model to continually learn on a new dataset of a different (Swedish) population without catastrophically forgetting its previous knowledge of the primary American dataset. In ReSTCL, we explored a label assignment strategy rooted in bilateral asymmetry detection, aiming to enhance the model’s continual learning process by harnessing asymmetrical features between left and right breast views. This method adaptively refines its predictive accuracy through label reassignment based on laterality—allowing it to better capture risk factors that manifest as asymmetrical differences between breast sides. ReSTCL can be generalized to other applications, and its usage is not just limited to risk prediction.In conclusion, we developed a new temporally sensitive model for cancer risk prediction that incorporates time-decay attention mechanisms and integrates radiomic features through a novel architecture that uses attention-based multiple instance learning called RADMIL. Furthermore, our model’s innovative use of a time-embedded additive hazard layer, and a new self-training method using asymmetry-based label assignment for continual learning contributes valuable frameworks for improving risk assessment based methods in the literature. A downside of our model is that we were only able to test it on two public datasets of American (EMBED) and Swedish (CSAW) populations, which may limit generalizability, highlighting the need for broader clinical testing and validation on more diverse patient datasets in the future. However, the results still demonstrate that our new model incorporating these innovative methods improves cancer risk assessment, is comparable with SOTA methods, and promotes new approaches for personalized medicine and screening regimens in individual women.
新型癌症风险预测模型的研发与优势解析 本文研发了一种具备独特特征的新型风险预测模型,旨在解决现有风险预测模型的局限性,其核心优势体现在特征融合、时间敏感性、个性化筛查适配等多个维度。 ## 现有风险预测模型的分类与局限 现有临床风险预测模型主要分为两类,且均存在明显不足: 1. 基于统计数据的传统模型:以Tyrer-Cuzick和Gail模型为代表,属于人群层面模型,在个体层面的鉴别性能有限。 2. 基于乳腺筛查影像的模型:可进一步分为两类。一是早期基于影像组学、纹理和乳腺密度特征的模型,虽鉴别能力优于传统统计模型(AUC约70%及以上),但性能仍有提升空间;二是近年基于深度学习特征的模型,鉴别能力更强(AUC约80%及以上),且能预测短期和长期风险,可依据影像特征制定个性化筛查方案,但仍存在多方面局限。 ## 新型模型的核心创新点 新型模型针对现有模型的不足,提出了五大关键创新,以提升预测准确性和实用性: ### 1. 基于RADMIL的多特征融合 - 现有问题:多数模型仅单独使用实质纹理特征或深度学习特征,少数融合方法也仅通过全连接层拼接,缺乏复杂且可解释的融合机制。 - 创新方案:提出RADMIL(基于影像组学与深度学习的多实例学习)方法,可对不同乳腺影像视图(如CC视图和MLO视图)的相对重要性进行加权和聚合。 - 核心优势:模型能通过反向传播自主判断对风险预测有用的视图,无需固定依赖某一视图,提升特征利用效率。 ### 2. 时间衰减(TD)注意力机制 - 现有问题:部分模型虽纳入既往乳腺影像,但未充分考虑时间因素对癌症发展的影响,无法优先利用近期影像中的关键信息。 - 创新方案:设计TD注意力机制,在提取序列影像特征时,优先关注近期筛查影像中的信息。 - 核心优势:显著增强非局部(NL)和SHIFT注意力机制的有效性,使模型在不同时间区间内识别癌症风险相关模式的能力更强,性能优于无TD注意力的基础模型。 ### 3. 含时间嵌入层的加性风险层 - 现有问题:现有模型未将个性化筛查方案信息纳入风险分层,部分推荐筛查间隔的方法(如Tempo-Mirai)依赖强化学习,训练难度大且对固定时间间隔筛查场景并非必需。 - 创新方案:在加性风险层中加入时间嵌入层,使模型在预测未来风险时能考虑既往筛查的时间节点。 - 核心优势:将时间信息直接嵌入风险模型,让加性风险层可根据筛查间隔精细调整风险评估,优化风险评分机制。 ### 4. 融入侧方注意力的不对称检测 - 现有问题:癌症常单侧发生,双侧不对称信息对短期风险预测有价值,但近年多数模型未纳入该信息。 - 创新方案:在RADMIL中融入侧方注意力,通过监督学习训练模型关注可能发生癌症的乳腺单侧。 - 核心优势:区别于AMIL中对各视图平均分配注意力的方式,侧方注意力能精准识别单侧乳腺的癌症发展迹象,提升单侧病变的检出能力。 ### 5. 基于ReSTCL的持续学习 - 现有问题:现有模型多仅在单一人群(如瑞典、美国或亚洲人群)数据集上训练,无法在新人群数据集上持续学习,易出现“灾难性遗忘”(即忘记原有数据集知识)。 - 创新方案:提出ReSTCL方法,以双侧不对称检测为基础设计标签分配策略,使模型能在瑞典人群(CSAW数据集)等新数据集上学习,同时保留美国人群(EMBED数据集)的原有知识。 - 核心优势:可推广至其他领域,不仅限于癌症风险预测,提升模型在不同人群中的适用性。 ## 模型局限性与未来方向 - 当前局限:仅在EMBED(美国人群)和CSAW(瑞典人群)两个公开数据集上测试,可能限制模型的泛化能力。 - 未来方向:需在更多样化的患者数据集上进行更广泛的临床测试与验证,进一步提升模型在不同人群中的适用性。 ## 模型整体价值 新型模型通过整合上述创新点,成为具备时间敏感性的癌症风险预测模型。其性能与现有最优(SOTA)方法相当,显著提升了癌症风险评估的准确性,为个性化医疗和女性个体筛查方案的制定提供了新的有效途径。 要不要我帮你整理一份新型模型创新点与对应解决问题的汇总表,清晰列出每个创新点、针对的现有问题及核心优势,方便快速梳理模型核心价值?
Results
结果
4.1. Time-decay attention
Table 3 presents the results of different attention mechanisms integrated into our CNN encoder and their time-decay counterparts. As shown in our previous work (Yeoh et al., 2023), the inclusion of attention mechanisms into the deep learning model can greatly improve risk prediction performance. The results in Table 3 demonstrate the benefits of including information in the time dimension in both Non-Local and SHIFT attention mechanisms. A time-sensitive self-attention mechanism in (Hu et al., 2023) called GLIM is also compared using Non-Local as the baseline method.Specifically, we observe that the introduction of time-decayattention between screenings contributes to improved model performance across almost all metrics for both Non-Local and SHIFT attention. We observe the highest performance improvement in 1- and 2-year AUCs, possibly attributed to more information present in recent screenings as opposed to previous screenings for recent years’ cancer prediction. Both time-decay versions of Non-Local and SHIFT attention mechanisms outperform GLIM. We attribute this to our approach of performing the Hadamard product directly on the query and key vectors with the time vector. This direct scaling of the query and key vectors by the time vector enhances the temporal sensitivity of the attention mechanism more effectively than applying the time matrix to the querykey product performed in GLIM.The results in Table 4 show that models trained with the two-step learning rate strategy consistently outperform those trained with a single learning rate of 1e− 5
. For instance, Non-Local trained with the twostep learning rate achieves a 1-year AUC of 0.821 compared to 0.813 with a single learning rate. Similarly, SHIFT achieves a 1-year AUC of 0.825 with the two-step strategy versus 0.816 with a single learning rate. These AUC improvements reinforce the necessity of the two-step strategy to handle the domain shift for the new time vector inputs, which imitates the training approach from (Hu et al., 2023). Namely, the training process for time-decay attention starts at a higher learning rate of 5e-4, for rapid adaption to the new inputs. A lower learning rate of 5e-5 is subsequently used to finetune our model in the two-step training method. Although (Hu et al., 2023) employ 6 different learning rates in their training procedure, our experimental results show that 2 different learning rates are sufficient to produce good results.To effectively apply time-decay attention, the model requires pretrained weights from a previously trained attention model as an initial starting point. For example, we first train a model with Non-Local attention, then we use this trained model to finetune a time-decay attention model. Table 5 highlights the impact of initializing timedecay attention mechanisms with weights from previously trained attention models. We observe that the performance of the time-decay models is better across all performance metrics with initialized weights for both Non-Local and SHIFT. Moreover, the performance of the time-decay models without pre-trained weights is even worse than the baseline Non-Local and SHIFT models in Table 3. For instance, thetime-decay Non-Local model without pre-trained weights achieves a 1- year AUC of 0.746, which is significantly lower than 0.805 achieved by the baseline Non-Local model. This degradation in performance can be attributed to the time vector obfuscating the training process, hindering the model’s ability to converge without a good initial set of attention weights.To find the optimal values for parameters A, B and threshold T in the time-decay attention (Eqs. (7) and 8), we performed a hyperparameter sweep of possible values, similar to (Hu et al., 2023). The results of the different hyperparameter values are tabulated in Tables 6, 7, and 8. From Tables 6 and 7, we observe that the best performance was achieved with A = 2.0 and B = 0.1, whereby the model maintained high AUC scores across all performance metrics, reflecting an effective balance in how past data influences predictions at these parameter values. Lower values of A and B led to insufficient attention decay, under-prioritizing recent data, while higher values caused excessive decay, leading to the underutilization of valuable historical information.Table 8 tabulates the effects of different threshold values, T, used in the time-decay attention. Time-decay attention performs best at T = 60 (i.e., 5 years). Performance deterioration occurs for other values of T, especially for higher values of T, namely T = 66 and 72, which confirms our initial hypothesis that T should not be too big as patients in this dataset tend to come annually for their screening mammogram.
4.1 时间衰减注意力机制 表3呈现了整合到卷积神经网络(CNN)编码器中的不同注意力机制及其对应的时间衰减变体的结果。正如我们以往研究(Yeoh 等,2023)所示,在深度学习模型中加入注意力机制可大幅提升风险预测性能。表3的结果表明,在非局部(Non-Local)和SHIFT两种注意力机制中纳入时间维度信息均能带来性能提升。本研究还以非局部网络为基准,对比了(Hu 等,2023)提出的一种时间敏感型自注意力机制——GLIM模型。 具体而言,我们观察到,在筛查图像间引入时间衰减注意力机制后,非局部和SHIFT两种注意力机制的模型在几乎所有评价指标上均有性能提升。其中,1年和2年预测周期的AUC值提升最为显著,这可能是因为在预测近期癌症风险时,近期筛查图像比早期筛查图像包含更多有效信息。非局部和SHIFT注意力机制的时间衰减变体,性能均优于GLIM模型。我们认为原因在于,我们的方法直接对查询向量、关键向量与时间向量进行哈达玛积运算;这种通过时间向量直接缩放查询向量和关键向量的方式,比GLIM模型中“将时间矩阵应用于查询-关键向量乘积”的方式,更能有效增强注意力机制的时间敏感性。 表4的结果显示,采用两步学习率策略训练的模型,性能始终优于采用单一学习率(1×10⁻⁵)训练的模型。例如,采用两步学习率训练的非局部网络,1年AUC值达到0.821,而采用单一学习率训练的同一模型AUC值仅为0.813;同样,采用两步学习率训练的SHIFT网络,1年AUC值为0.825,高于单一学习率训练的0.816。这些AUC值的提升证实,两步学习率策略对于处理新时间向量输入带来的域偏移至关重要,该策略借鉴了(Hu 等,2023)的训练思路:时间衰减注意力机制的训练首先采用较高的学习率(5×10⁻⁴),以快速适应新输入;随后切换为较低的学习率(5×10⁻⁵),对模型进行微调。尽管(Hu 等,2023)在训练过程中采用了6种不同的学习率,但我们的实验结果表明,仅需2种不同的学习率即可取得良好效果。 为有效应用时间衰减注意力机制,模型需要以“经预训练的注意力模型权重”作为初始起点。例如,我们首先训练一个含非局部注意力的模型,再利用该模型的权重微调时间衰减注意力模型。表5重点展示了“用已训练注意力模型的权重初始化时间衰减注意力机制”产生的影响。结果显示,无论是非局部还是SHIFT机制,经权重初始化的时间衰减模型在所有评价指标上性能均更优;此外,未使用预训练权重的时间衰减模型,性能甚至低于表3中的基准非局部和SHIFT模型。例如,未使用预训练权重的时间衰减非局部模型,1年AUC值仅为0.746,远低于基准非局部模型的0.805。性能下降的原因在于,若没有优质的初始注意力权重,时间向量会干扰训练过程,阻碍模型收敛。 为确定时间衰减注意力机制中参数A、B及阈值T的最优值(公式7和公式8),我们参考(Hu 等,2023)的方法,对可能的参数值进行了超参数扫描,不同超参数值的结果分别列于表6、表7和表8。从表6和表7可见,当A=2.0、B=0.1时,模型性能最佳——在所有评价指标上均保持较高AUC值,这表明在此参数组合下,历史数据对预测结果的影响达到了有效平衡。A和B值过小时,注意力衰减不足,会导致近期数据未得到充分重视;A和B值过大时,衰减过度,会造成有价值的历史信息未被充分利用。 表8列出了时间衰减注意力机制中不同阈值T的影响。当T=60(即5年)时,时间衰减注意力机制性能最佳;其他T值(尤其是较大的T值,如T=66和T=72)会导致性能下降。这一结果验证了我们最初的假设:T值不应过大,因为该数据集中的患者通常每年进行一次乳腺钼靶筛查。 要不要我帮你整理一份时间衰减注意力机制核心实验结论汇总表,将“性能对比、学习率策略、权重初始化、超参数选择”这四大关键实验的核心发现清晰罗列?
Figure
图
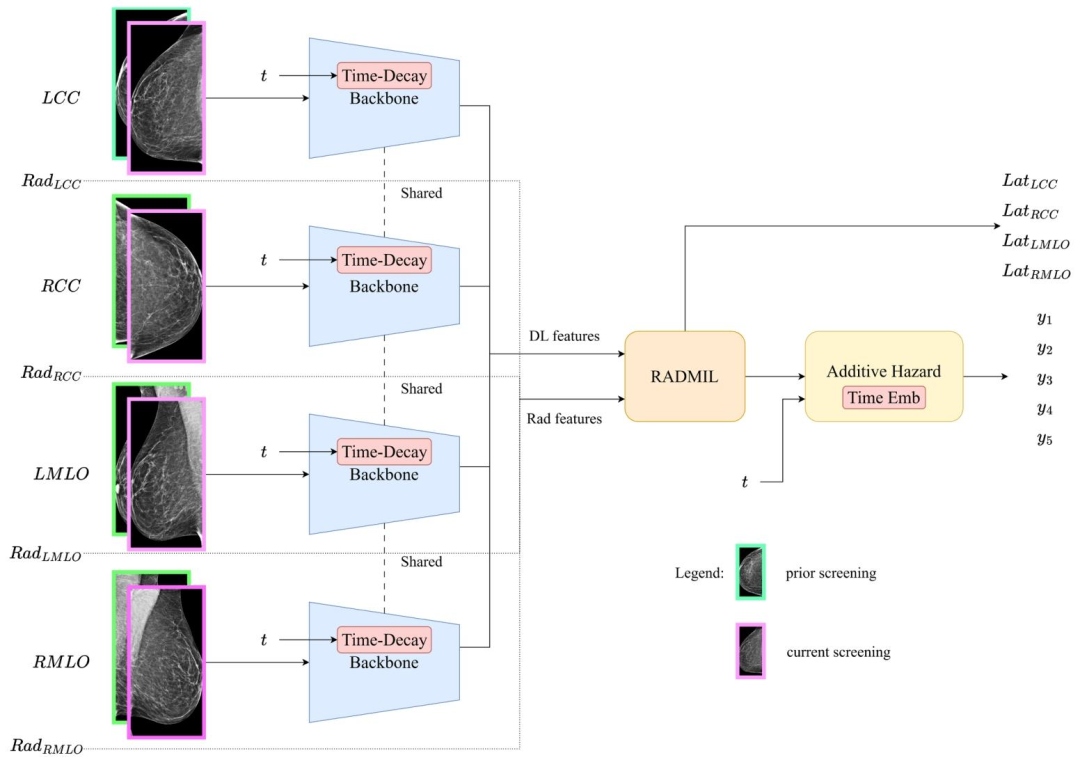
Fig. 1. The proposed TRINet model uses a shared backbone encoder across all four images. The encoder incorporates a new time-decay attention that can capture changes in breast tissue structure over time while focusing on more recent screenings. The handcrafted radiomic features are the same as in (Yeoh et al., 2023) and are included in the model through our new Radiomics and Deep learning-based Multiple Instance Learning (RADMIL) architecture.
图1说明:TRINet模型结构 所提出的TRINet模型对全部四张图像(注:指乳腺钼靶检查中左右乳房的头尾位CC视图、内外侧斜位MLO视图,共四张图像)采用共享骨干编码器。 该编码器整合了一种新型时间衰减注意力机制,既能捕捉乳腺组织结构随时间的变化,又能聚焦于近期的筛查图像。 人工提取的影像组学特征与(Yeoh 等,2023)中的特征一致,通过本文提出的新型“基于影像组学与深度学习的多实例学习(RADMIL)”架构融入模型。 要不要我帮你梳理一份TRINet模型核心组件(共享编码器、时间衰减注意力、RADMIL)功能说明表,更直观理解各部分作用?
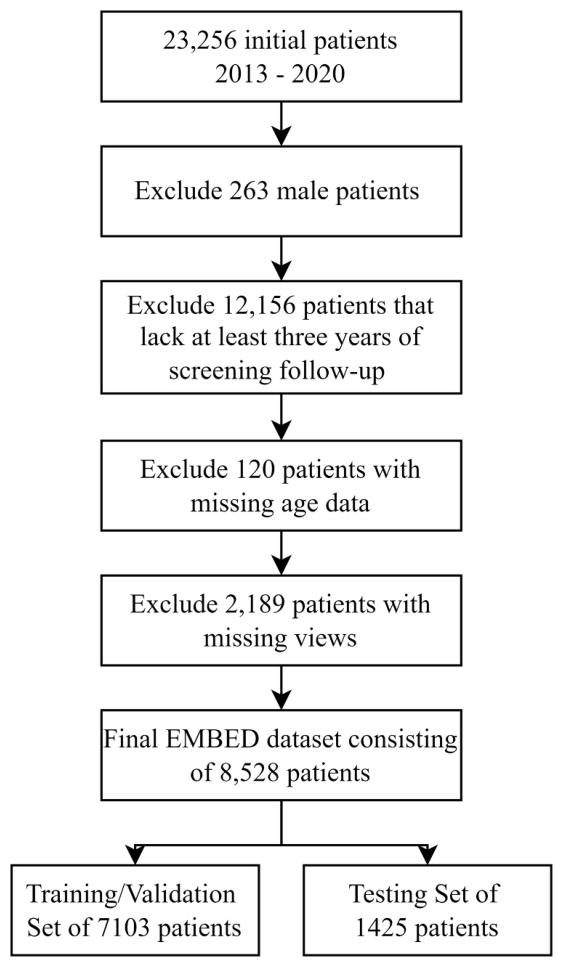
Fig. 2. Dataset construction flowchart for the EMBED dataset used in this study
图 2 说明:本研究中 EMBED 数据集的构建流程图
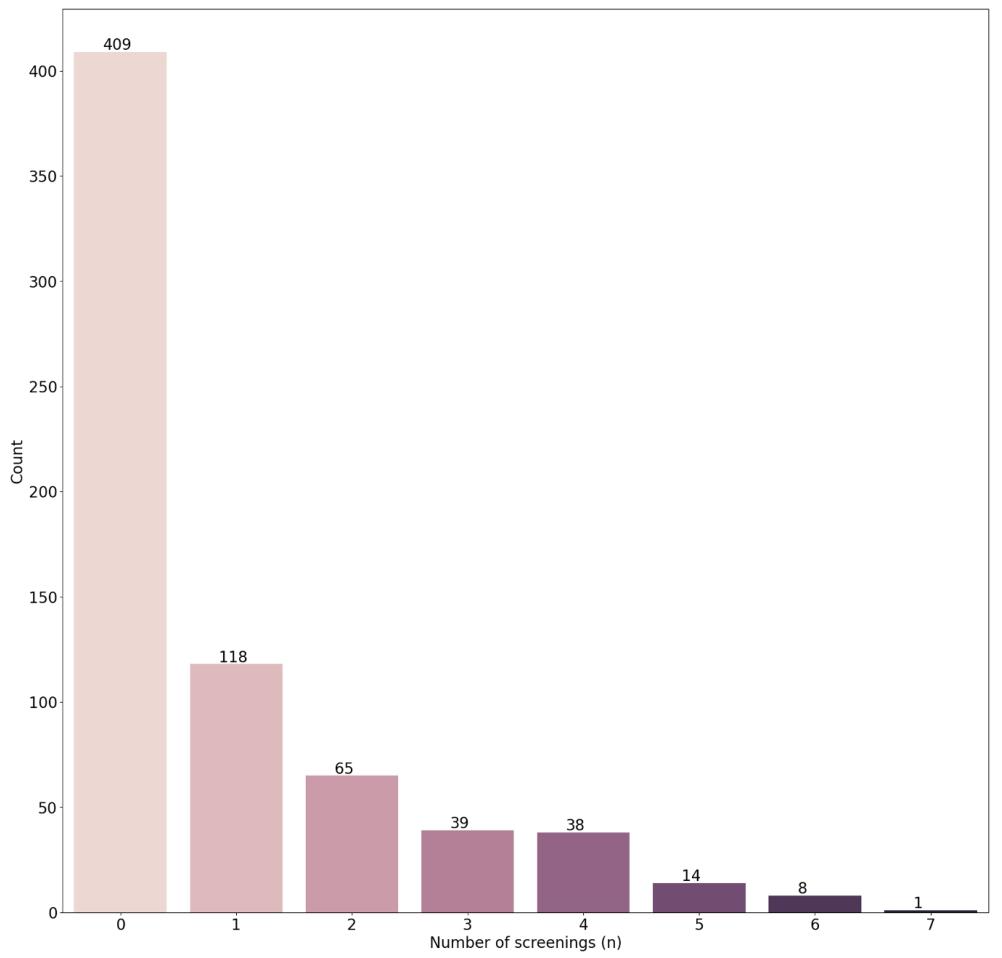
Fig. 3. Breakdown of the number of screenings for cancer patients in the publicly released 20 % EMBED dataset subset used in this study
图3说明:本研究使用的公开发布EMBED数据集20%子集内癌症患者的筛查次数细分
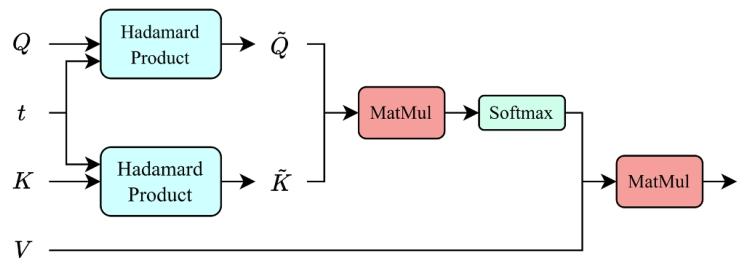
Fig. 4. Time-decay non-local (TD-NL) attention block.
图 4 说明:时间衰减非局部(TD-NL)注意力模块
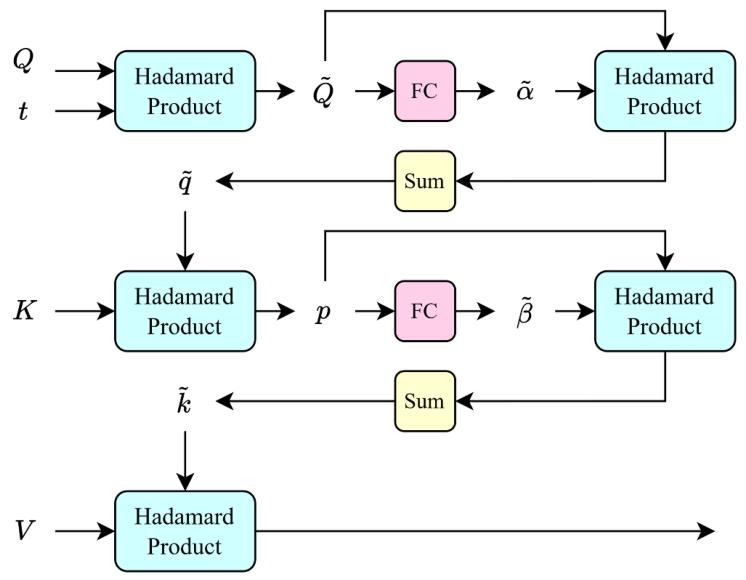
Fig. 5. Time-decay SHIFT (TD-SHIFT) attention block.
图5 时间衰减SHIFT(TD-SHIFT)注意力模块
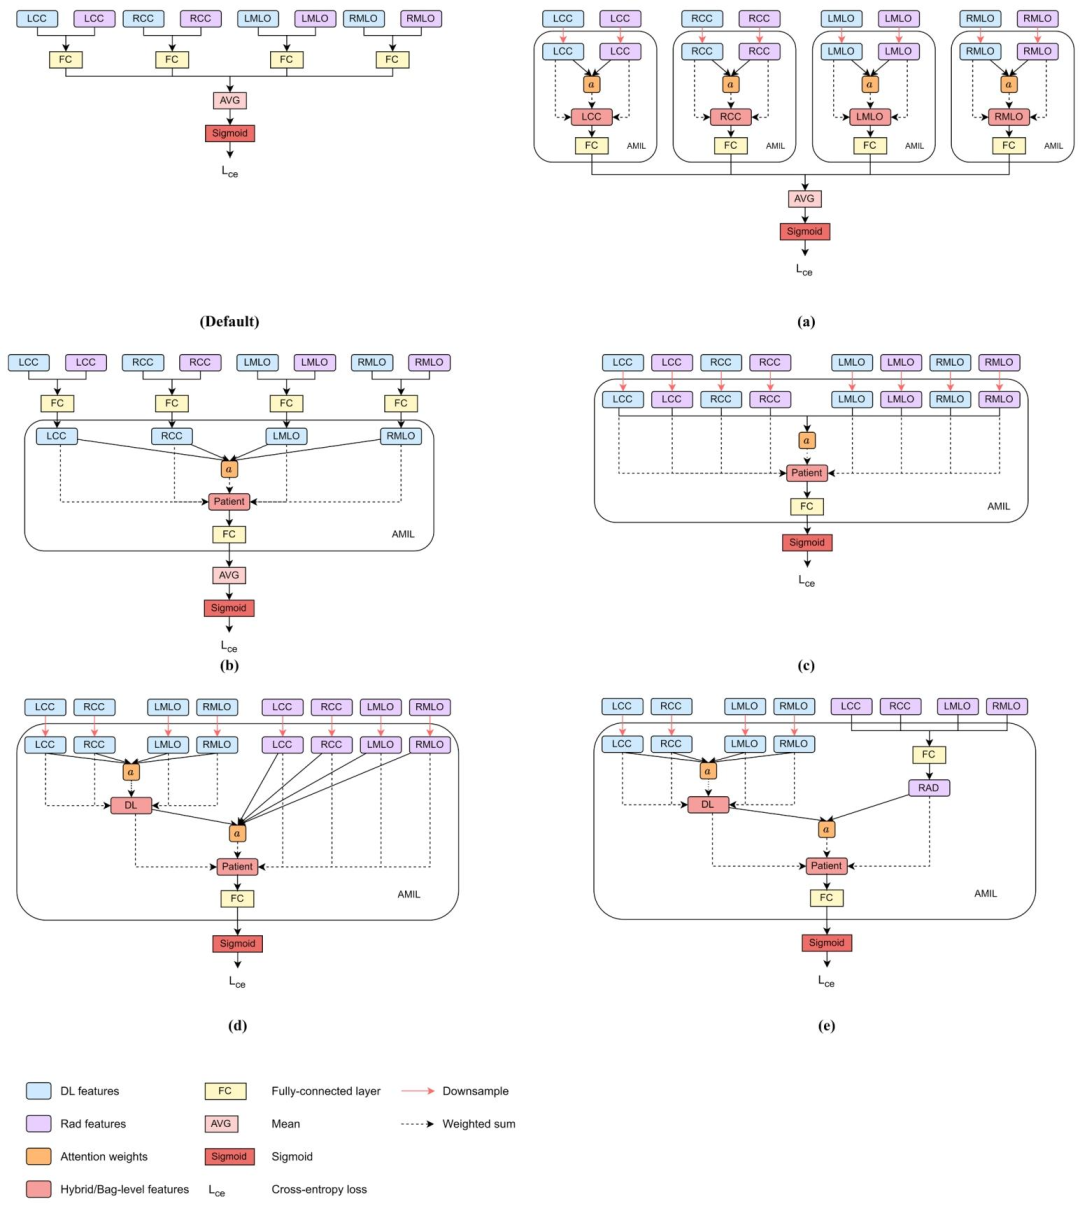
Fig. 6. Different configurations of AMIL implemented through the attention weights, *a* examined in our network architecture. The Default configuration depicts the conventional method to combine radiomic (Rad) and deep learning (DL) features that does not incorporate AMIL.
图6 本研究网络架构中通过注意力权重*a*实现的AMIL(基于注意力的多实例学习)不同配置 “默认配置”(Default configuration)展示了融合影像组学(Rad)特征与深度学习(DL)特征的传统方法,该方法未纳入AMIL。
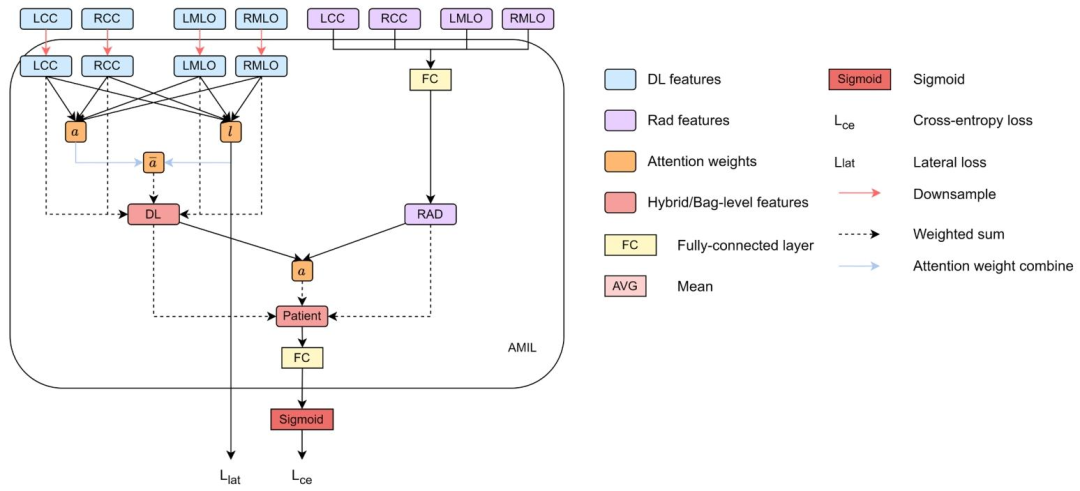
Fig. 7. Integration of lateral attention with Config E of Fig. 6.
图 7 侧方注意力与图 6 中配置 E(Config E)的整合
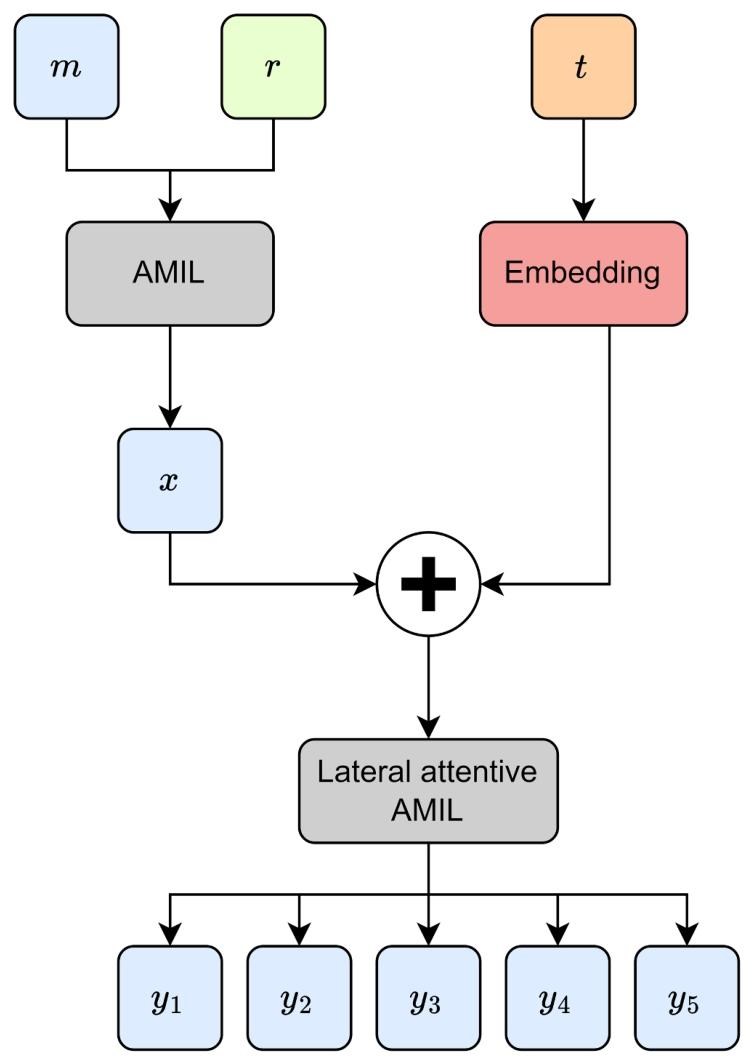
Fig. 8. Additive hazard layer with time-interval screening embeddings. The deep learning features m are combined with radiomic features r by our lateralattentive AMIL based method. Then, the resulting feature embedding x is added with the screening time-interval t embedding, to form an additive hazard for future cancer risk prediction.
图8 含筛查时间间隔嵌入的加性风险层 通过基于侧方注意力的AMIL方法,将深度学习特征m与影像组学特征r融合。随后,将融合得到的特征嵌入x与筛查时间间隔t嵌入相加,构建加性风险模型,用于未来癌症风险预测。
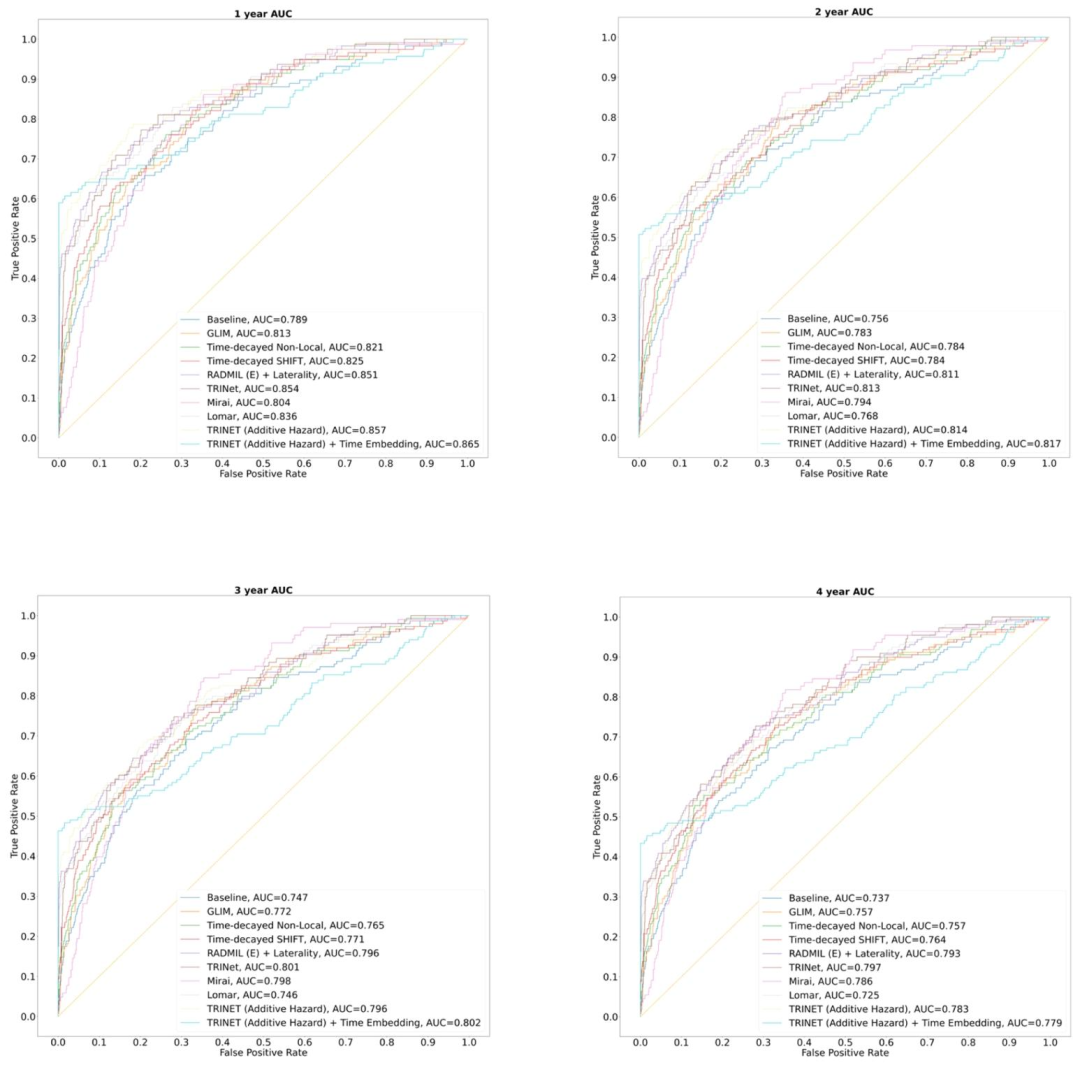
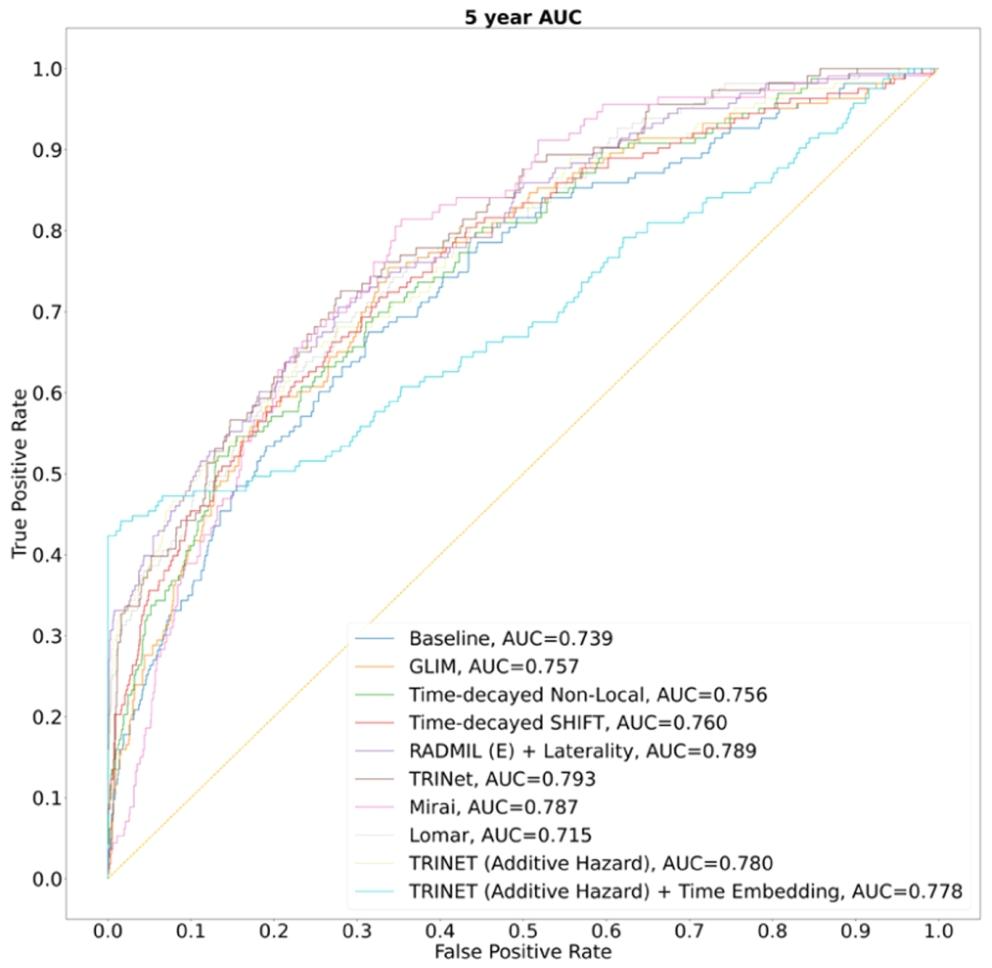
Fig. 9. ROC curves of ablation study results corresponding to 1 to 5-year AUC categories
图 9 对应 1 至 5 年 AUC 类别的消融实验结果 ROC 曲线
Table
表
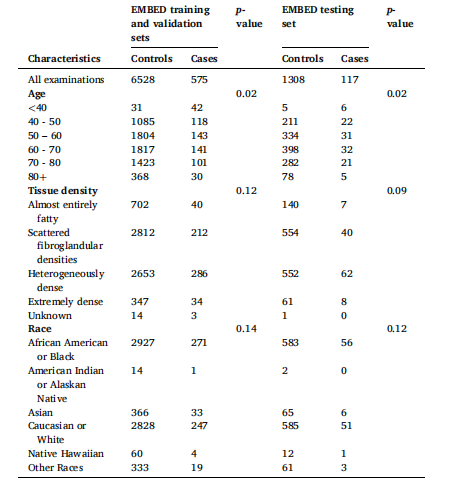
Table 1 Detailed demographics for the EMBED dataset. We employed a five-fold crossvalidation method, whereby the training and validation dataset was divided into five subsets, ensuring each subset was used for both training and validation at different iterations. The test set remained independent and was unseen during training
表1 埃默里乳腺成像数据集(EMBED)的详细人口统计学特征 本研究采用五折交叉验证法,将训练集和验证集划分为5个子集。在不同迭代过程中,每个子集均会分别用于训练和验证。测试集始终保持独立,且在训练过程中不会被模型接触到。
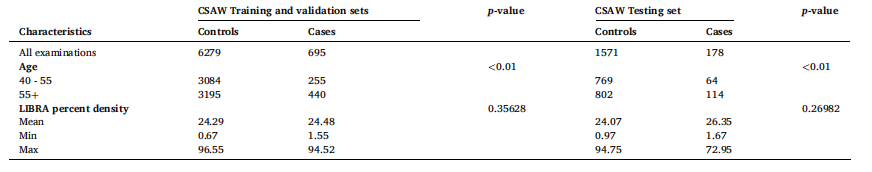
Tble 2 Demographic and LIBRA percent densities (Keller et al., 2012) for the CSAW dataset. We employed a five-fold cross-validation method, whereby the training and validation dataset was divided into five subsets, ensuring each subset was used for both training and validation at different iterations. The test set remained independent and was unseen during training. This dataset is heavily censored and only contains publicly released information on age and LIBRA percent density
表2 瑞典筛查年龄女性队列数据集(CSAW)的人口统计学特征与LIBRA密度百分比(Keller 等,2012) 本研究采用五折交叉验证法,将训练集与验证集划分为5个子集。在不同迭代过程中,每个子集均会分别用于训练和验证。测试集始终保持独立,且在训练过程中不会被模型接触到。该数据集存在大量数据截尾情况,仅包含公开发布的年龄信息与LIBRA密度百分比信息。
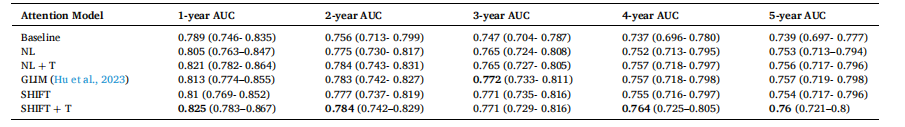
Table 3 Summary of AUC results with 95 % confidence intervals (CIs) for GLIM (Hu et al., 2023), Non-Local networks, SHIFT, and their respective time-decay variants. An attention block version of GLIM is used as a comparison. The “+ T” here denotes the time-decay variants.
表3 GLIM模型(Hu 等,2023)、非局部(Non-Local)网络、SHIFT网络及其各自时间衰减变体的AUC结果汇总(含95%置信区间) 本研究采用GLIM模型的注意力模块版本作为对比基准。表中“+ T”代表各模型的时间衰减变体。
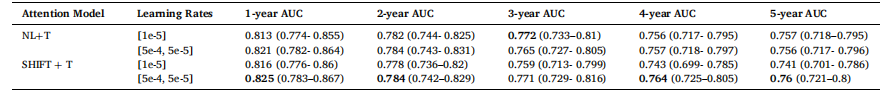
Table 4 AUC results with 95 % CIs of training different time-decay attention mechanisms using different finetuning learning rates
表 4 采用不同微调学习率训练各时间衰减注意力机制的 AUC 结果(含 95% 置信区间)
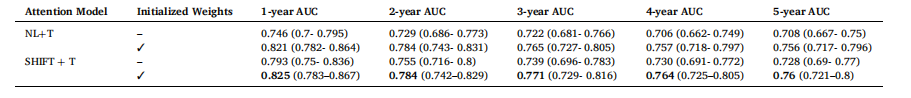
Table 5 AUC results with 95 % CIs of training different time-decay attention mechanisms using initialized weights from previously trained attention models
表 5 采用已训练注意力模型的初始化权重训练各时间衰减注意力机制的 AUC 结果(含 95% 置信区间)
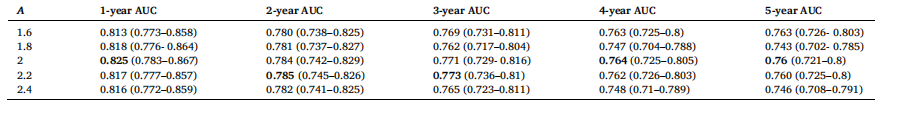
Table 6 AUC results with 95 % CIs for different values of A with a fixed value of B = 0.1 and threshold, T = 60 for SHIFT+T attention
表6 对于SHIFT+T注意力机制,在B=0.1、阈值T=60固定的情况下,不同A值对应的AUC结果(含95%置信区间)
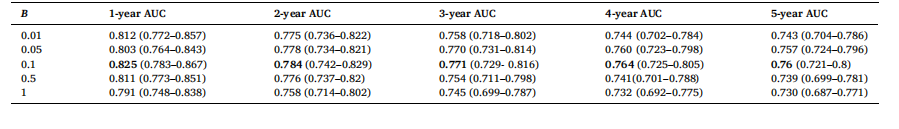
Table 7 AUC results with 95 % CIs for different values of B with a fixed value of A = 2.0 and threshold, T = 60 for SHIFT+T attention.
表7 对于SHIFT+T注意力机制,在A=2.0、阈值T=60固定的情况下,不同B值对应的AUC结果(含95%置信区间) 要不要我
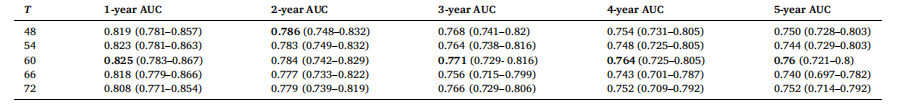
Table 8 AUC results with 95 % CIs for different values of threshold, T with a fixed value of A = 2.0 and B = 0.1 for SHIFT+T attention
表 8 对于 SHIFT+T 注意力机制,在 A=2.0、B=0.1 固定的情况下,不同阈值 T 值对应的 AUC 结果(含 95% 置信区间)
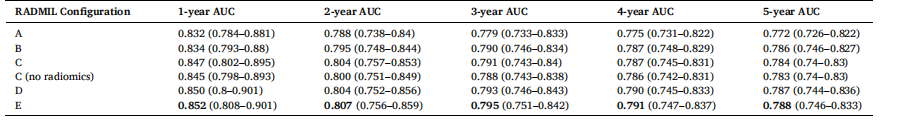
Table 9 AUC results with 95 % CIs for the integration of radiomic features with deep learning features using different configurations of RADMIL.
表 9 采用 RADMIL(基于影像组学与深度学习的多实例学习)不同配置融合影像组学特征与深度学习特征的 AUC 结果(含 95% 置信区间)

Table 10 AUC results with 95 % CIs for the integration of radiomic features using different combination methods. Configuration E of RADMIL is used here as it produces the highest results in Table 9.
表10 采用不同融合方法整合影像组学特征的AUC结果(含95%置信区间) 本研究选用RADMIL的配置E(Config E)进行实验,因其在表9中表现最优。
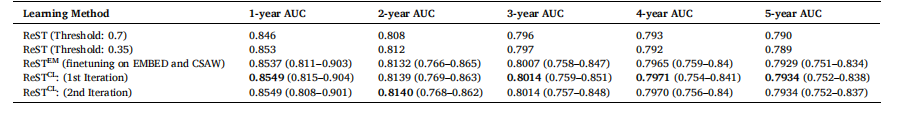
Table 11 AUC results with 95 % CIs for continual learning using the CSAW dataset as a secondary dataset for the original ReST method, ReSTCL and ReSTEM
表11 以CSAW数据集作为次要数据集,采用原始ReST方法、ReSTCL方法及ReSTEM方法进行持续学习的AUC结果(含95%置信区间)

Table 12 AUC results with 95 % CIs of risk prediction using an additive hazard layer and additive hazard layer combined with time embeddings.
表12 采用加性风险层与“加性风险层结合时间嵌入”进行风险预测的AUC结果(含95%置信区间)
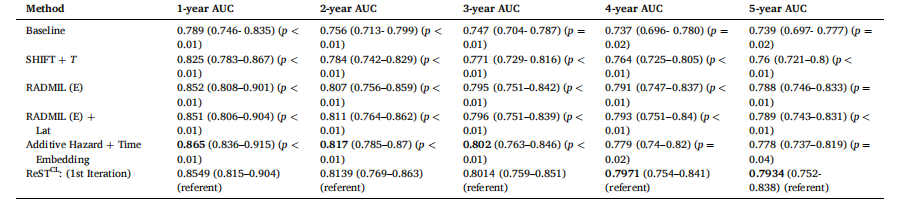
Table 13 Ablation study results compilation of incorporating new modifications/additions to our model. The p-values were computed using DeLong’s test as implemented in the pROC package in R, with the ReSTCL: (1st Iteration) model as the referent. Each row corresponds to the final version of an earlier introduced model configuration/ method.
表13 模型新增修改/补充模块的消融实验结果汇总 p值通过R语言pROC包实现的DeLong检验计算得出,以ReSTCL:(第1轮迭代)模型为参照基准。每一行对应前文提及的某一模型配置/方法的最终版本结果。
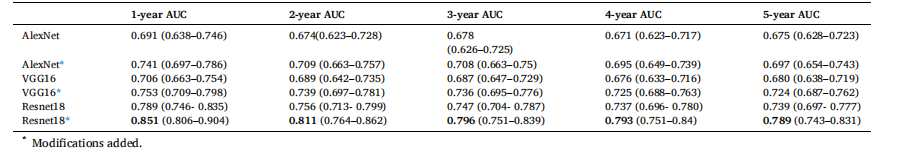
Table 14 AUC results with 95 % CIs of different baseline CNN encoders used in our risk model.
表14 风险模型中采用不同基准卷积神经网络(CNN)编码器的AUC结果(含95%置信区间)
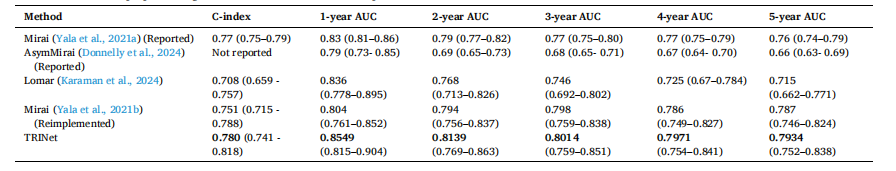
Table 15 Comparison of AUC results with 95 % CIs and C-indices of our proposed method and other SOTA methods. We reimplemented the SOTA Mirai and Lomar methods and evaluated them on the same EMBED dataset split as our method. We also report results of Mirai and its variation, AsymMirai, from their original studies. While our reimplementation ensures a fair or direct comparison, the reported results from the original studies are based on a different dataset or EMBED dataset split, which may involve variations in preprocessing, cohort selection, or test set composition.
表15 所提方法与其他现有最优(SOTA)方法的AUC结果(含95%置信区间)及C指数对比 本研究重新实现了现有最优方法Mirai和Lomar,并在与所提方法相同的EMBED数据集划分上对其进行评估。同时,本研究还报告了原始研究中Mirai及其变体AsymMirai的结果。需要说明的是,本研究的重新实现确保了对比的公平性和直接性,而原始研究报告的结果基于不同数据集或不同的EMBED数据集划分,这可能涉及预处理、队列选择或测试集构成方面的差异。 要不要我帮你整理一份表15关键对比维度清单,清晰列出“方法类型、评估数据集划分、核心指标(AUC/C指数)、对比公平性说明”这几个关键信息?