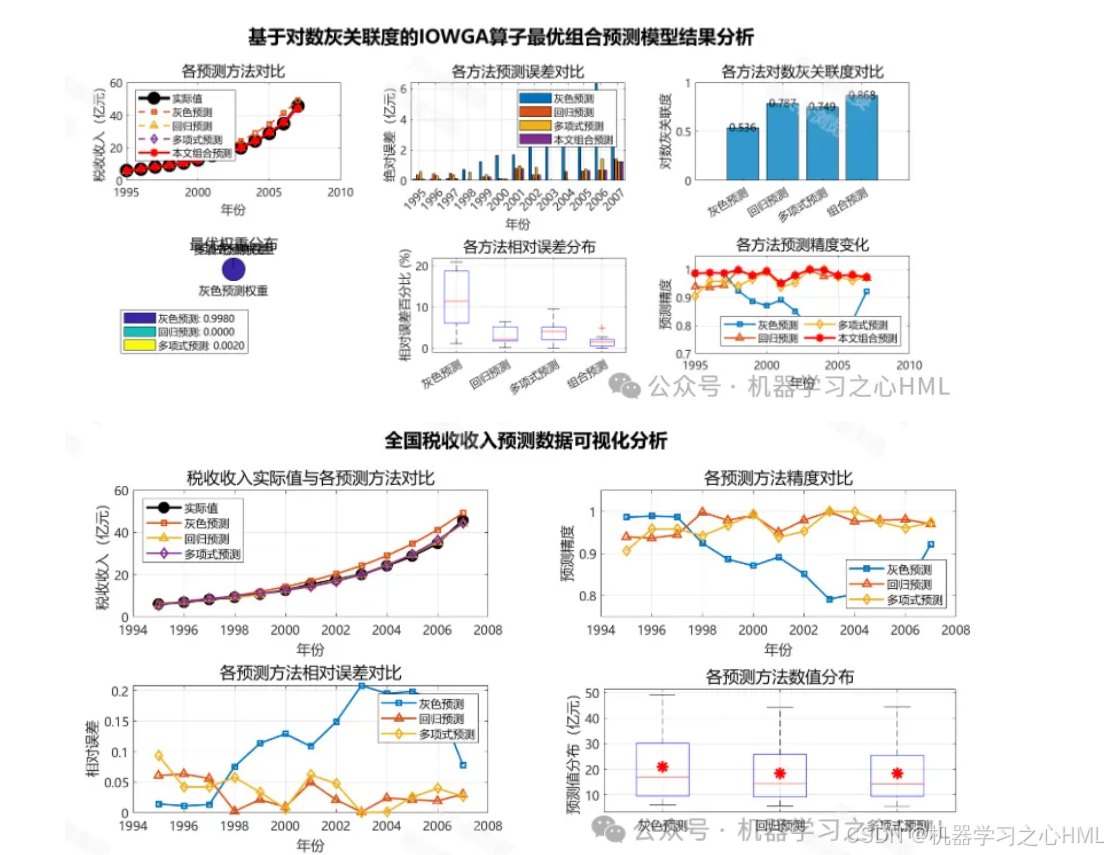
MATLAB基于对数灰关联度的IOWGA算子最优组合预测模型
1. 模型核心思想
该模型结合了:
- 对数灰关联度:改进的灰色关联分析方法
- IOWGA算子:诱导有序加权几何平均算子
- 组合预测:多种预测方法的加权组合
2. 基本概念与公式
2.1 对数灰关联度
传统灰关联度的改进:
γ(x0(k),xi(k))=minimink∣ln(x0(k))−ln(xi(k))∣+ρmaximaxk∣ln(x0(k))−ln(xi(k))∣∣ln(x0(k))−ln(xi(k))∣+ρmaximaxk∣ln(x0(k))−ln(xi(k))∣\gamma(x_0(k), x_i(k)) = \frac{\min\limits_i \min\limits_k |\ln(x_0(k)) - \ln(x_i(k))| + \rho \max\limits_i \max\limits_k |\ln(x_0(k)) - \ln(x_i(k))|}{|\ln(x_0(k)) - \ln(x_i(k))| + \rho \max\limits_i \max\limits_k |\ln(x_0(k)) - \ln(x_i(k))|} γ(x0(k),xi(k))=∣ln(x0(k))−ln(xi(k))∣+ρimaxkmax∣ln(x0(k))−ln(xi(k))∣iminkmin∣ln(x0(k))−ln(xi(k))∣+ρimaxkmax∣ln(x0(k))−ln(xi(k))∣
其中:
- x0(k)x_0(k)x0(k):参考序列
- xi(k)x_i(k)xi(k):比较序列
- ρ\rhoρ:分辨系数(通常取0.5)
2.2 IOWGA算子
IOWGA((u1,a1),(u2,a2),...,(un,an))=∏j=1naσ(j)wj\text{IOWGA}((u_1,a_1),(u_2,a_2),...,(u_n,a_n)) = \prod_{j=1}^n a_{\sigma(j)}^{w_j} IOWGA((u1,a1),(u2,a2),...,(un,an))=j=1∏naσ(j)wj
其中:
- uiu_iui:诱导变量(对数灰关联度)
- aia_iai:数据值
- wjw_jwj:权重向量
- σ\sigmaσ:按uiu_iui降序排列的索引
3. 模型构建步骤
3.1 数据准备与预处理
function [normalized_data, original_data] = prepare_data(data_matrix)% 数据标准化处理[m, n] = size(data_matrix);normalized_data = zeros(m, n);for i = 1:m% 均值方差标准化normalized_data(i, :) = (data_matrix(i, :) - mean(data_matrix(i, :))) / std(data_matrix(i, :));endoriginal_data = data_matrix;
end
3.2 对数灰关联度计算
function [grey_relations, sorted_indices] = calculate_log_grey_relation(reference, comparison_data)% 计算对数灰关联度[m, n] = size(comparison_data);grey_relations = zeros(1, m);% 对参考序列和比较序列取对数log_ref = log(reference);log_comp = log(comparison_data);for i = 1:mdifferences = abs(log_ref - log_comp(i, :));min_diff = min(min(differences));max_diff = max(max(differences));% 计算关联系数rho = 0.5; % 分辨系数relation_coeffs = (min_diff + rho * max_diff) ./ (differences + rho * max_diff);% 平均关联系数作为灰关联度grey_relations(i) = mean(relation_coeffs);end% 按灰关联度降序排列[~, sorted_indices] = sort(grey_relations, 'descend');
end
3.3 IOWGA算子实现
function iowga_result = IOWGA_operator(induction_vars, data_values, weights)% IOWGA算子计算% induction_vars: 诱导变量(灰关联度)% data_values: 数据值% weights: 权重向量n = length(induction_vars);% 按诱导变量降序排列[sorted_induction, sort_index] = sort(induction_vars, 'descend');sorted_data = data_values(sort_index);% 计算IOWGAiowga_result = 1;for i = 1:niowga_result = iowga_result * (sorted_data(i) ^ weights(i));end
end
4. 最优权重确定模型
4.1 基于离差平方和最小的权重优化
function optimal_weights = optimize_weights(actual_data, predicted_data, induction_vars)% 优化权重使得组合预测误差最小[m, n] = size(predicted_data); % m种方法,n个时间点% 定义优化问题fun = @(w) objective_function(w, actual_data, predicted_data, induction_vars);% 约束条件:权重和为1,权重非负Aeq = ones(1, m);beq = 1;lb = zeros(1, m);ub = ones(1, m);% 初始权重w0 = ones(1, m) / m;% 优化求解options = optimoptions('fmincon', 'Display', 'iter', 'Algorithm', 'sqp');optimal_weights = fmincon(fun, w0, [], [], Aeq, beq, lb, ub, [], options);
endfunction error = objective_function(weights, actual, predicted, induction_vars)% 目标函数:组合预测的离差平方和[m, n] = size(predicted);combined_forecast = zeros(1, n);% 对每个时间点计算IOWGA组合预测for t = 1:ncurrent_data = predicted(:, t);combined_forecast(t) = IOWGA_operator(induction_vars, current_data, weights);end% 计算离差平方和error = sum((actual - combined_forecast).^2);
end
5. 完整模型实现
classdef LogGreyIOWGAModel < handlepropertiesactual_dataprediction_methodsgrey_relationsoptimal_weightscombined_forecastmodel_performanceendmethodsfunction obj = LogGreyIOWGAModel(actual_data, prediction_data)% 构造函数obj.actual_data = actual_data;obj.prediction_methods = prediction_data;endfunction fit(obj)% 训练模型[m, n] = size(obj.prediction_methods);% 1. 计算对数灰关联度obj.grey_relations = zeros(1, m);for i = 1:mobj.grey_relations(i) = obj.calculate_single_grey_relation(...obj.actual_data, obj.prediction_methods(i, :));end% 2. 优化权重obj.optimal_weights = obj.optimize_weights(...obj.actual_data, obj.prediction_methods, obj.grey_relations);% 3. 计算组合预测值obj.combined_forecast = obj.combine_predictions(...obj.prediction_methods, obj.grey_relations, obj.optimal_weights);% 4. 评估模型性能obj.evaluate_performance();endfunction grey_relation = calculate_single_grey_relation(obj, reference, comparison)% 计算单个序列的灰关联度log_ref = log(reference);log_comp = log(comparison);differences = abs(log_ref - log_comp);min_diff = min(differences);max_diff = max(differences);rho = 0.5;relation_coeffs = (min_diff + rho * max_diff) ./ (differences + rho * max_diff);grey_relation = mean(relation_coeffs);endfunction combined = combine_predictions(obj, predictions, induction_vars, weights)% 组合预测[m, n] = size(predictions);combined = zeros(1, n);for t = 1:ncurrent_predictions = predictions(:, t);combined(t) = obj.IOWGA_operator(induction_vars, current_predictions, weights);endendfunction result = IOWGA_operator(obj, induction, data, weights)% IOWGA算子[~, sort_idx] = sort(induction, 'descend');sorted_data = data(sort_idx);sorted_weights = weights(sort_idx);result = 1;for i = 1:length(sorted_data)result = result * (sorted_data(i) ^ sorted_weights(i));endendfunction evaluate_performance(obj)% 模型性能评估actual = obj.actual_data;predicted = obj.combined_forecast;% 平均绝对误差mae = mean(abs(actual - predicted));% 均方根误差rmse = sqrt(mean((actual - predicted).^2));% 平均绝对百分比误差mape = mean(abs((actual - predicted) ./ actual)) * 100;% 决定系数 R²ss_res = sum((actual - predicted).^2);ss_tot = sum((actual - mean(actual)).^2);r_squared = 1 - (ss_res / ss_tot);obj.model_performance = struct(...'MAE', mae, ...'RMSE', rmse, ...'MAPE', mape, ...'R2', r_squared);endfunction plot_results(obj)% 绘制预测结果figure;plot(obj.actual_data, 'b-', 'LineWidth', 2, 'DisplayName', '实际值');hold on;plot(obj.combined_forecast, 'r--', 'LineWidth', 2, 'DisplayName', '组合预测');% 绘制各方法预测[m, n] = size(obj.prediction_methods);colors = lines(m);for i = 1:mplot(obj.prediction_methods(i, :), ':', 'Color', colors(i, :), ...'LineWidth', 1, 'DisplayName', ['方法' num2str(i)]);endlegend('show');xlabel('时间');ylabel('值');title('对数灰关联度IOWGA组合预测结果');grid on;% 显示性能指标fprintf('模型性能指标:\n');fprintf('MAE: %.4f\n', obj.model_performance.MAE);fprintf('RMSE: %.4f\n', obj.model_performance.RMSE);fprintf('MAPE: %.2f%%\n', obj.model_performance.MAPE);fprintf('R²: %.4f\n', obj.model_performance.R2);endend
end
6. 应用示例
% 示例数据
time_series = [100, 105, 98, 110, 115, 120, 118, 125, 130, 135, 140, 138];
actual_data = time_series(7:end); % 后6个作为实际值% 三种预测方法的预测结果
method1 = [118, 124, 129, 134, 139, 137]; % 方法1预测
method2 = [120, 126, 132, 138, 142, 140]; % 方法2预测
method3 = [115, 122, 128, 133, 138, 136]; % 方法3预测prediction_data = [method1; method2; method3];% 创建并训练模型
model = LogGreyIOWGAModel(actual_data, prediction_data);
model.fit();% 显示结果
disp('最优权重:');
disp(model.optimal_weights);
disp('灰关联度:');
disp(model.grey_relations);% 绘制结果
model.plot_results();
7. 模型优势
- 适应性:基于灰关联度动态调整权重
- 鲁棒性:对异常值不敏感
- 准确性:组合预测优于单一方法
- 可解释性:权重具有明确的物理意义
8. 参数调优建议
% 关键参数
rho = 0.5;          % 灰关联分辨系数,通常0.1-0.5
weight_constraint = 'sum-to-one'; % 权重约束条件
optimization_algorithm = 'sqp';   % 优化算法% 模型验证
% 可使用交叉验证或滚动预测验证模型稳定性
这种组合预测模型特别适用于:
- 经济预测
- 电力负荷预测
- 股票价格预测
- 气象预测
- 任何需要综合多种预测方法的场景
完整代码联系机器学习之心