多分组火山图绘制-Rscript_version1.0
将下面的R代码保存为脚本,然后将需要画图的数据和脚本放在一起,然后运行脚本,脚本会自动进行识别文件和分析绘图、输出结果等,R代码:
# ======================================================
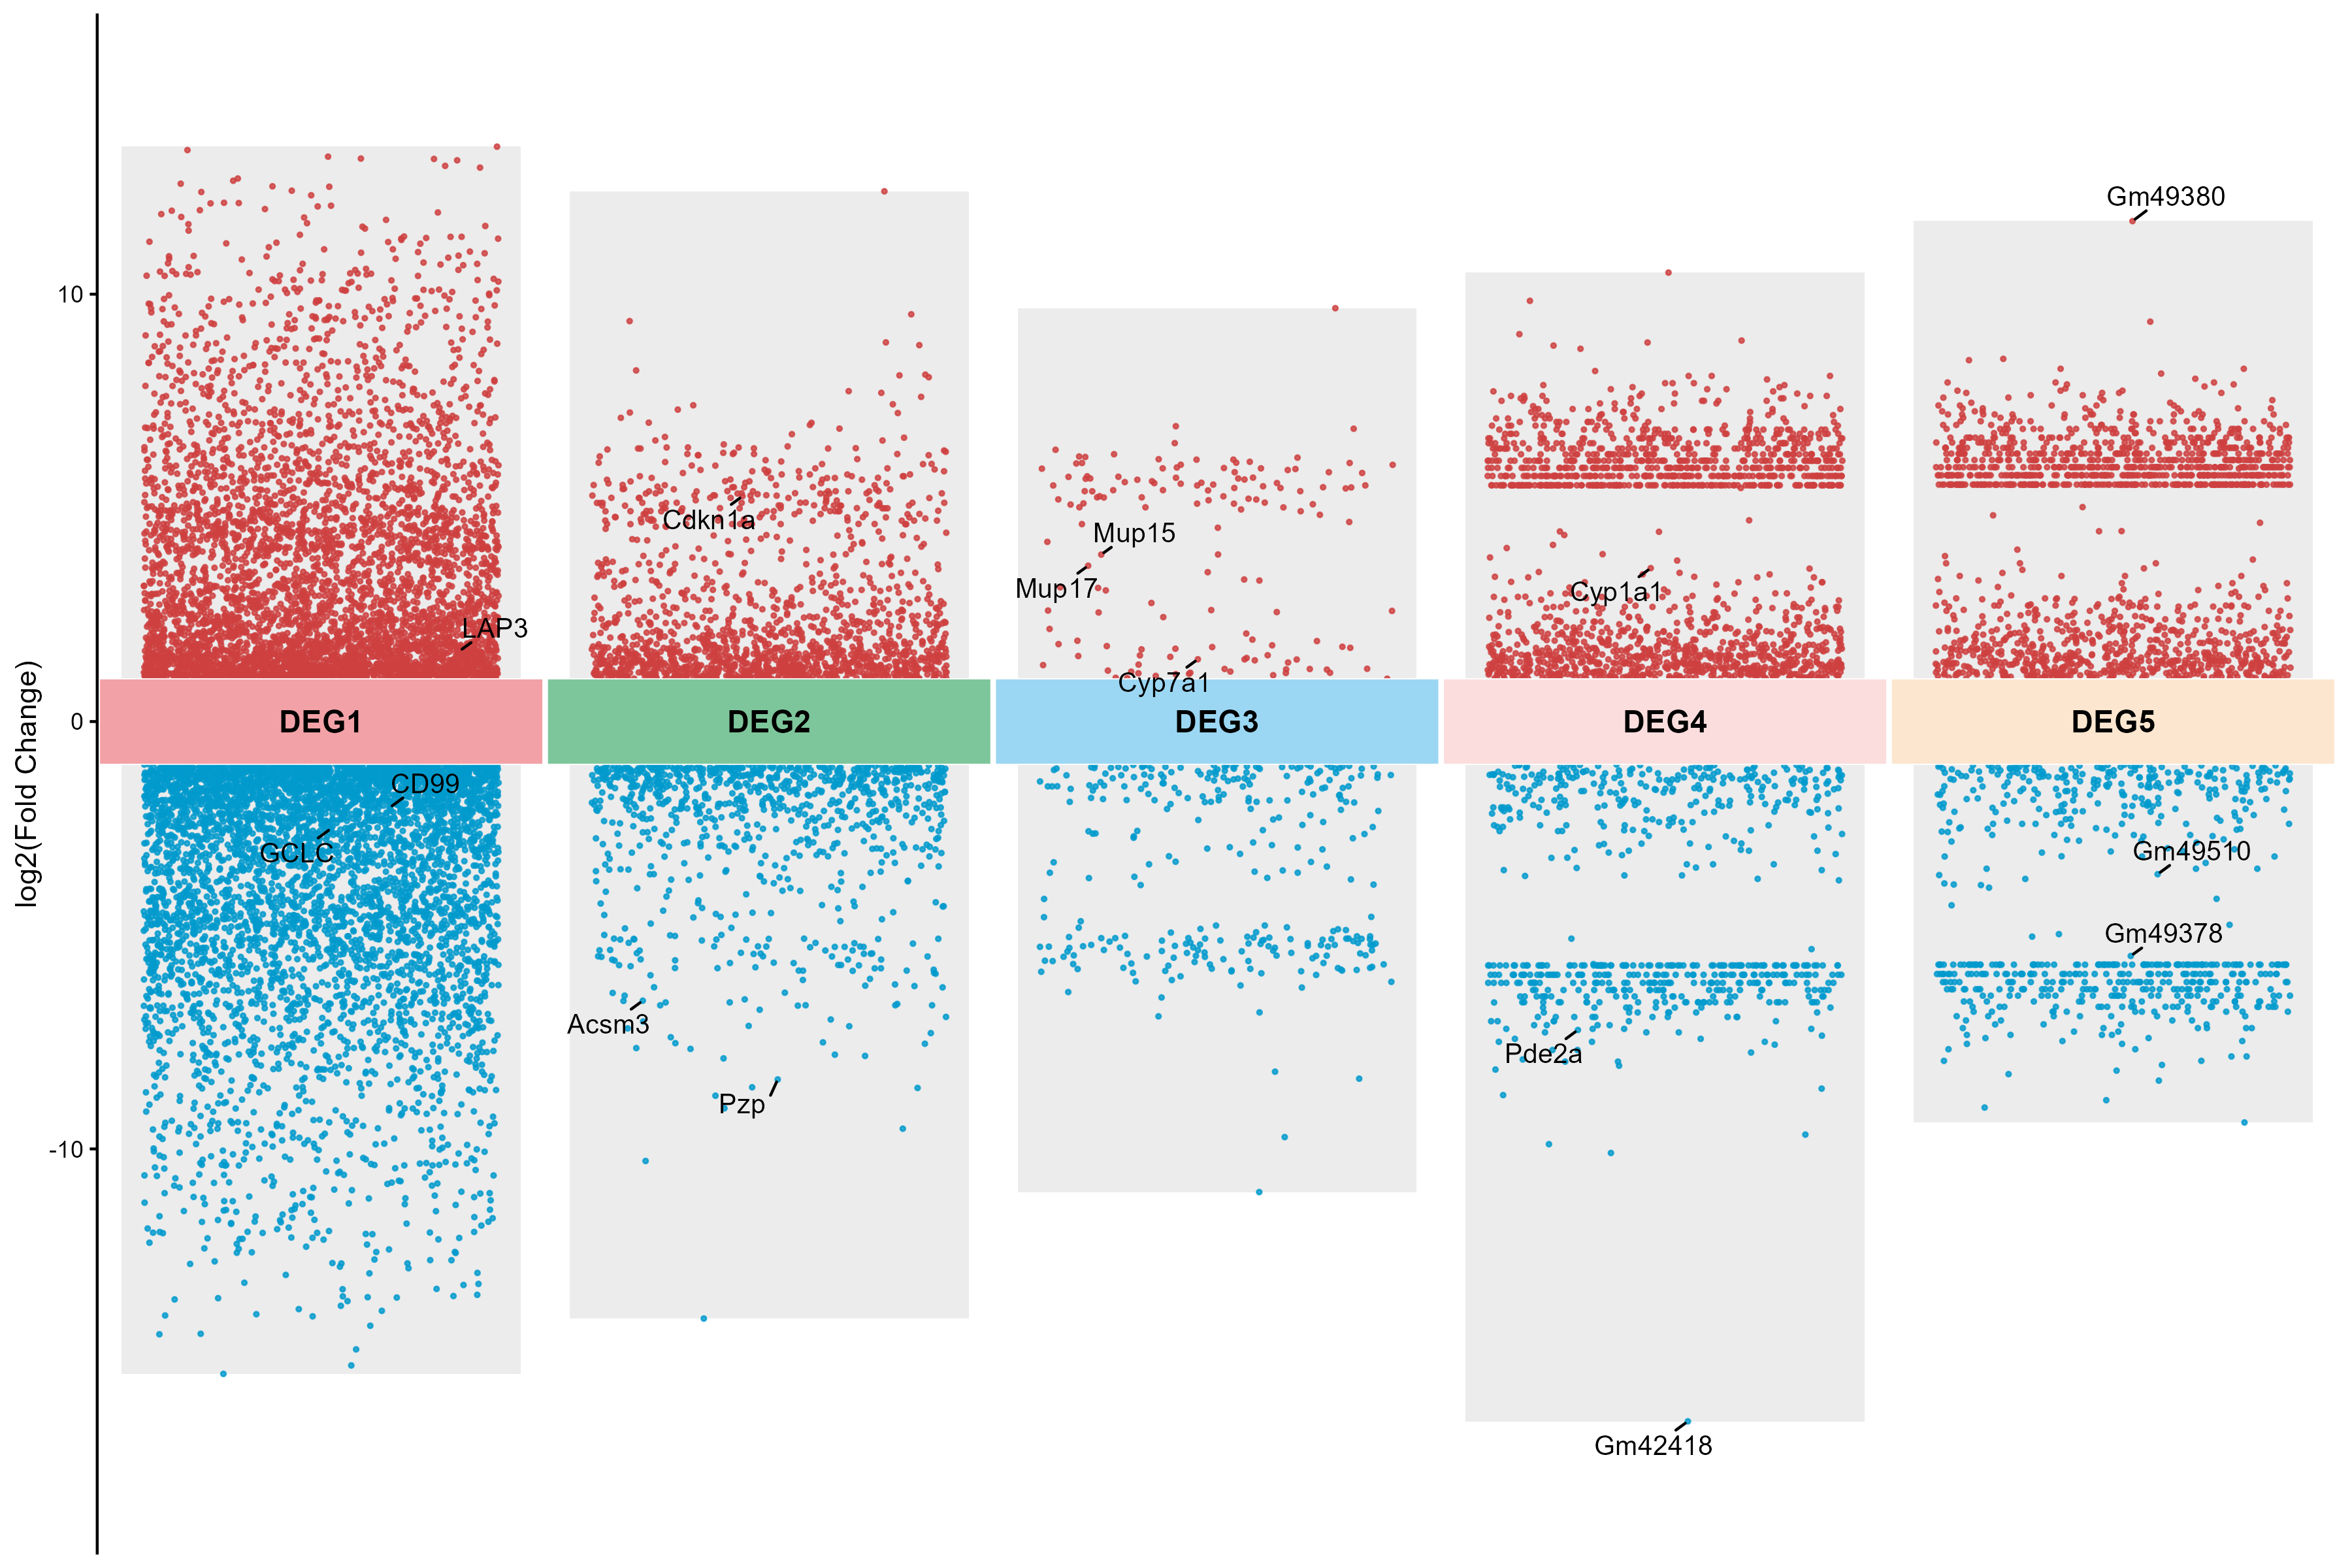
# 火山图绘制工具:多分组差异表达基因可视化
# 功能:从多个Excel文件读取数据,绘制带有Cluster分组的火山图
# 参数可定制化:包括抖动程度、色块间距、数据点范围等
# ======================================================#setwd("F:\\vocano_plot\\多分组火山图")# 加载必要的R包
library(readxl) # 读取Excel文件
library(dplyr) # 数据处理
library(stringr) # 字符串处理
library(tidyverse) # 数据科学工具集
library(ggrepel) # 避免文本标签重叠
library(openxlsx) # 写入Excel文件
library(ggplot2) # 绘图
library(gridExtra) # 图形排列# ------------------------------------------------------
# 火山图绘制函数
# ------------------------------------------------------
mutiVolcano <- function(df, P = 0.05, # P值阈值,用于筛选显著差异基因FC = 2, # 倍数变化阈值(FC),转换为log2后使用GroupName = c("Up", "Down", "Not Significant"), # 基因分组名称pointColor = c("#ce4040", "#019acd", "#AAAAAA"), # 点的颜色(上调/下调/非显著)pointSize = 1.5, # 点的大小labeltype = "1", # 基因标签类型:"1"=按P值排序标记,"2"=按指定基因名称标记labelNum = 5, # 每个Cluster标记的基因数量(当labeltype=1时)labelName = NULL, # 指定要标记的基因名称列表(当labeltype=2时)tileLabel = "Num", # 色块标签类型(未使用,保留参数)legendTitle = "Regulation",# 图例标题tile_width = 0.99, # 底部色块宽度(控制Cluster间距,范围0-1,值越大间距越小)point_range_ratio = 0.8, # 数据点分布范围相对于色块宽度的比例(0-1)add_bg_bars = TRUE, # 是否添加背景柱bg_bar_alpha = 0.3, # 背景柱透明度bg_bar_color = "gray", # 背景柱颜色bg_bar_width_ratio = 0.9) { # 背景柱宽度系数,介于point_range_ratio和1之间# 数据预处理:计算基因分组并筛选有效数据dfSig <- df %>% mutate(Group = case_when(PValue < P & log2FoldChange > log2(FC) ~ GroupName[1], # 上调基因PValue < P & log2FoldChange < -log2(FC) ~ GroupName[2], # 下调基因TRUE ~ GroupName[3] # 非显著差异基因)) %>%mutate(Group = factor(Group, levels = GroupName), # 固定分组顺序Cluster = factor(Cluster, levels = unique(Cluster)) # 固定Cluster顺序) %>%filter(!is.na(Group)) # 过滤无效分组# 计算抖动宽度:控制数据点在Cluster内的分布范围# 数据点分布范围 = tile_width * point_range_ratiojitter_width <- tile_width * point_range_ratio / 2 # 除以2是因为jitter的宽度是双向的# 为数据添加Cluster整数位置dfJitter <- dfSig %>%mutate(cluster_idx = as.integer(Cluster) # 将Cluster转换为整数位置(1,2,3...))# 设置随机种子,确保抖动结果可重复set.seed(123)# 为每个数据点计算固定的抖动位置dfJitter <- dfJitter %>%group_by(cluster_idx) %>%mutate(jitter_x = cluster_idx + runif(n(), -jitter_width, jitter_width)) %>%ungroup()# 筛选显著差异的基因(只保留上调和下调基因用于绘图)dfJitter_sig <- dfJitter %>%filter(Group %in% c(GroupName[1], GroupName[2]))# 确定要标记的基因dfLabel <- switch(labeltype,"1" = dfJitter_sig %>% group_by(Cluster) %>% slice_min(PValue, n = labelNum, with_ties = F) %>% ungroup(),"2" = dfJitter_sig %>% filter(Symbol %in% labelName),dfJitter_sig %>% slice(0) # 不标记任何基因)# 计算底部色块高度(基于FC阈值)fc_threshold <- log2(FC)tile_height <- fc_threshold * 2# 计算每个Cluster的log2FC区间if(add_bg_bars) {cluster_ranges <- dfJitter %>%group_by(Cluster, cluster_idx) %>%summarise(min_fc = min(log2FoldChange),max_fc = max(log2FoldChange),.groups = "drop")}# 计算背景柱宽度# 确保背景柱宽度介于point_range_ratio和1之间bg_bar_width_ratio <- max(point_range_ratio, min(bg_bar_width_ratio, 1))bg_bar_width <- tile_width * bg_bar_width_ratio# 构建火山图p <- ggplot(dfJitter_sig, aes(x = jitter_x, y = log2FoldChange)) +# 添加背景柱{if(add_bg_bars) geom_rect(data = cluster_ranges,aes(xmin = cluster_idx - bg_bar_width/2, xmax = cluster_idx + bg_bar_width/2,ymin = min_fc,ymax = max_fc),fill = bg_bar_color,alpha = bg_bar_alpha,inherit.aes = FALSE)} +# 使用预先计算的抖动位置geom_point(aes(color = Group), size = pointSize, alpha = 0.8, # 设置透明度以便观察重叠点show.legend = TRUE) +# 绘制底部色块:显示各个Cluster的位置geom_tile(data = unique(dfJitter %>% select(cluster_idx, Cluster)), # 每个Cluster只绘制一个色块aes(x = cluster_idx, y = 0, width = tile_width, height = tile_height, fill = Cluster),color = "white", # 色块边框颜色show.legend = FALSE) +# 在色块上添加Cluster名称geom_text(data = unique(dfJitter %>% select(cluster_idx, Cluster)),aes(x = cluster_idx, y = 0, label = Cluster),size = 4,color = "black",fontface = "bold") +# 添加基因标签:使用ggrepel避免标签重叠,并使用预先计算的抖动位置ggrepel::geom_text_repel(data = dfLabel,aes(x = jitter_x, label = Symbol), # 使用预先计算的抖动位置size = 3.5,min.segment.length = 0, # 显示所有连接线force = 3, # 调整标签排斥力show.legend = FALSE) +# 设置X轴:使用Cluster整数位置作为刻度,显示Cluster名称scale_x_continuous(breaks = unique(dfJitter$cluster_idx), # 刻度位置labels = unique(dfJitter$Cluster), # 刻度标签expand = expansion(mult = c(0.001, 0.001)) # 控制坐标轴两端的扩展比例) +# 设置Y轴:显示log2(FC)值及阈值scale_y_continuous(expand = c(0.1, 0.1),name = paste0("log2(Fold Change)")) +# 设置颜色映射:只显示上调和下调的颜色scale_color_manual(values = pointColor[1:2],name = legendTitle,breaks = GroupName[1:2],labels = c("Upregulated", "Downregulated")) +# 为Cluster分配SCI风格配色方案scale_fill_manual(values = c("#F2A1A7","#7DC69B","#9BD7F3","#FBDDDD", "#FCE6CF","#D5EAD9","#D8EEFB","#DCD7EB")) +# 设置主题:简洁风格,隐藏X轴标题和刻度theme_classic() +theme(axis.title.x = element_blank(), # 隐藏X轴标题axis.text.x = element_blank(), # 隐藏X轴刻度标签axis.ticks.x = element_blank(), # 隐藏X轴刻度线axis.line.x = element_blank(), # 隐藏X轴线legend.position = "none", # 不显示图例plot.title = element_text(hjust = 0.5, size = 14, face = "bold") # 标题居中)return(p)
}# ------------------------------------------------------
# 数据处理与绘图主程序
# ------------------------------------------------------
cat("开始数据处理...\n")# 创建Results文件夹
results_dir <- "Results"
if (!dir.exists(results_dir)) {dir.create(results_dir)cat(sprintf("已创建结果文件夹: %s\n", results_dir))
}# 查找所有Excel文件(排除已合并的文件)
xlsx_files <- list.files(pattern = "\\.xlsx$") %>%.[!grepl("combined|merged", ., ignore.case = TRUE)]cat(sprintf("找到 %d 个xlsx文件:\n", length(xlsx_files)), paste(xlsx_files, collapse = ", "), "\n")# 初始化合并后的数据框
combined_data <- data.frame()# 逐个读取并合并文件
for (file in xlsx_files) {tryCatch({# 读取Excel文件data <- read_excel(file)# 从文件名提取Cluster名称(去除.xlsx后缀)cluster_name <- str_remove(file, "\\.xlsx$") %>% str_trim()# 清洗Cluster名称:替换非法字符为下划线cluster_name <- str_replace_all(cluster_name, "[^a-zA-Z0-9_.-]", "_") %>%ifelse(is.na(.) | . == "", paste0("Cluster_", seq_along(xlsx_files)[file == xlsx_files]), .)# 提取关键数据列并添加Cluster信息data <- data %>%mutate(Cluster = cluster_name) %>%select(Name = GeneID, log2FoldChange, PValue = pvalue, padj, Symbol = geneSymbol, Cluster) %>%filter(complete.cases(.)) # 过滤含有缺失值的行# 合并数据if (nrow(data) > 0) {combined_data <- bind_rows(combined_data, data)cat(sprintf("成功处理文件: %s | Cluster: %s | 行数: %d\n", file, cluster_name, nrow(data)))} else {warning(sprintf("文件 %s 数据为空,已跳过", file))}}, error = function(e) {cat(sprintf("处理文件 %s 时出错: %s\n", file, conditionMessage(e)))})
}# ------------------------------------------------------
# 绘制火山图并保存结果
# ------------------------------------------------------
if (nrow(combined_data) > 0) {# 保存合并后的数据到Results文件夹write.xlsx(combined_data, file.path(results_dir, "combined_DEG_data.xlsx"), overwrite = TRUE)cat(sprintf("\n数据合并完成,总样本量: %d\n", nrow(combined_data)))# 绘制火山图tryCatch({plot_data <- combined_data %>% filter(!is.na(Cluster)) # 确保Cluster非空# 调用火山图函数,设置关键参数volcano_plot <- mutiVolcano(df = plot_data,P = 0.05, # P值阈值FC = 2, # FC阈值pointSize = 0.5, # 点大小labeltype = "1", # 按P值标记基因labelNum = 3, # 每个Cluster标记3个基因tile_width = 0.99, # 色块宽度(控制Cluster间距)point_range_ratio = 0.8, # 数据点范围是色块宽度的95%add_bg_bars = TRUE, # 添加背景柱bg_bar_alpha = 0.3, # 背景柱透明度bg_bar_color = "gray", # 背景柱颜色bg_bar_width_ratio = 0.9 # 背景柱宽度系数)# 显示火山图print(volcano_plot)# 图片保存参数plot_width <- 12plot_height <- 8plot_dpi <- 300# 保存为PNG格式到Results文件夹png_file <- file.path(results_dir, "volcano_plot_with_clusters.png")ggsave(png_file, plot = volcano_plot, width = plot_width, height = plot_height, dpi = plot_dpi, bg = "white")cat(sprintf("火山图已保存为 %s\n", png_file))# 保存为PDF格式到Results文件夹pdf_file <- file.path(results_dir, "volcano_plot_with_clusters.pdf")pdf(pdf_file, width = plot_width, height = plot_height)print(volcano_plot)dev.off()cat(sprintf("火山图已保存为 %s\n", pdf_file))}, error = function(e) {cat(sprintf("绘图失败: %s\n", conditionMessage(e)))print(e)})
} else {cat("没有有效数据,请检查输入文件格式\n")
}