Prometheus:从概述到部署
Prometheus:从概述到部署
- 前言
- 一、Prometheus 概述
- 1.1. Prometheus 的核心特性
- 1.2. Prometheus 的架构与组件
- 1.3. Prometheus 的工作流程
- 1.4. Prometheus 的部署
- 1.4.1. 部署 Prometheus Server
- 1.4.2. 部署 Exporters
- 1.4.3. 部署 Grafana
- 1.4.4. 部署服务发现
- 二、Prometheus 的局限性与解决方案
- 结语
前言
在当今的云计算和微服务架构时代,监控系统的角色变得愈发重要。为了确保系统的稳定性和高效性,实时监控和告警机制是不可或缺的。Prometheus 作为一个开源的服务监控系统和时序数据库,凭借其强大的功能和灵活的配置,成为了众多企业和开发者首选的监控解决方案。本文将详细介绍 Prometheus 的核心概念、架构、组件、工作原理及其部署方法,帮助读者全面了解并掌握这一强大的监控工具。
一、Prometheus 概述
Prometheus 是一个开源的系统监控和警报工具包,最初由 SoundCloud 开发,后来成为 Cloud Native Computing Foundation(CNCF)的一部分。它提供了一个通用的数据模型和快捷的数据采集、存储和查询接口。Prometheus 的核心组件 Prometheus server 会定期从静态配置的监控目标或者基于服务发现自动配置的目标中进行拉取数据,并将新拉取到的数据持久化到存储设备中。
1.1. Prometheus 的核心特性
- 多维数据模型:Prometheus 使用时间序列数据,通过度量名称和键值对标识。
- 内置时间序列数据库(TSDB):Prometheus 自带高效的时序数据库,适合存储大规模的监控数据。
- 强大的查询语言(PromQL):PromQL 允许用户对时序数据进行复杂的查询和聚合。
- 灵活的数据采集:支持基于 HTTP 的 pull 方式采集数据,同时支持 Pushgateway 组件收集数据。
- 服务发现:支持通过静态配置或服务发现机制动态管理监控目标。
- 可视化与告警:支持通过 Grafana 进行数据可视化,并通过 Alertmanager 进行告警管理。
1.2. Prometheus 的架构与组件
Prometheus 的生态系统由多个组件组成,每个组件都有其特定的功能:
- Prometheus Server:核心组件,负责数据采集、存储和告警生成。
- Exporters:负责收集不同服务和应用程序的指标数据,并将其转换为 Prometheus 可以理解的格式。
- Client Libraries:为应用程序提供原生的指标收集支持。
- Pushgateway:用于接收短期任务的指标数据,并将其暴露给 Prometheus Server。
- Service Discovery:动态发现监控目标,支持多种服务发现机制。
- Alertmanager:处理由 Prometheus Server 生成的告警,并进行去重、分组和路由。
- Grafana:用于数据可视化,提供丰富的仪表盘和图表。
1.3. Prometheus 的工作流程
Prometheus 的工作流程主要包括以下几个步骤:
- 数据采集:Prometheus Server 通过 pull 方式从各个监控目标拉取数据,或者通过 Pushgateway 接收推送的数据。
- 数据存储:采集到的数据存储在 Prometheus 的时序数据库中,支持本地存储和远程存储。
- 告警生成:根据配置的告警规则,Prometheus Server 生成告警通知,并发送到 Alertmanager。
- 告警处理:Alertmanager 接收到告警通知后,进行去重、分组,并路由到相应的接收方。
- 数据可视化:通过 Prometheus 自带的 Web UI 或 Grafana,用户可以查询和可视化监控数据。
1.4. Prometheus 的部署
1.4.1. 部署 Prometheus Server
- 安装与配置:下载并解压 Prometheus 的压缩包,配置
prometheus.yml文件,设置全局参数、告警规则、数据采集任务等。
systemctl stop firewalld
setenforce 0
cd /opt/
tar xf prometheus-2.35.0.linux-amd64.tar.gz
mv prometheus-2.35.0.linux-amd64 /usr/local/prometheus
cat /usr/local/prometheus/prometheus.yml | grep -v "^#"
global:					#用于prometheus的全局配置,比如采集间隔,抓取超时时间等scrape_interval: 15s			#采集目标主机监控数据的时间间隔,默认为1mevaluation_interval: 15s 		#触发告警生成alert的时间间隔,默认是1m# scrape_timeout is set to the global default (10s).scrape_timeout: 10s			#数据采集超时时间,默认10s
alerting:				#用于alertmanager实例的配置,支持静态配置和动态服务发现的机制alertmanagers:- static_configs:- targets:# - alertmanager:9093
rule_files:				#用于加载告警规则相关的文件路径的配置,可以使用文件名通配机制# - "first_rules.yml"# - "second_rules.yml"
scrape_configs:			#用于采集时序数据源的配置# The job name is added as a label `job=<job_name>` to any timeseries scraped from this config.- job_name: "prometheus"		#每个被监控实例的集合用job_name命名,支持静态配置(static_configs)和动态服务发现的机制(*_sd_configs)# metrics_path defaults to '/metrics'metrics_path: '/metrics'    #指标数据采集路径,默认为 /metrics# scheme defaults to 'http'.static_configs:				#静态目标配置,固定从某个target拉取数据- targets: ["localhost:9090"]
- 启动服务:通过 systemd 管理 Prometheus 服务,确保其开机自启并正常运行。
#配置系统启动文件,启动 Prometheust
cat > /usr/lib/systemd/system/prometheus.service <<'EOF'
[Unit]
Description=Prometheus Server
Documentation=https://prometheus.io
After=network.target
[Service]
Type=simple
ExecStart=/usr/local/prometheus/prometheus \
--config.file=/usr/local/prometheus/prometheus.yml \
--storage.tsdb.path=/usr/local/prometheus/data/ \
--storage.tsdb.retention=15d \
--web.enable-lifecycle
ExecReload=/bin/kill -HUP $MAINPID
Restart=on-failure
[Install]
WantedBy=multi-user.target
EOF
#启动
systemctl start prometheus
systemctl enable prometheus
netstat -natp | grep :9090
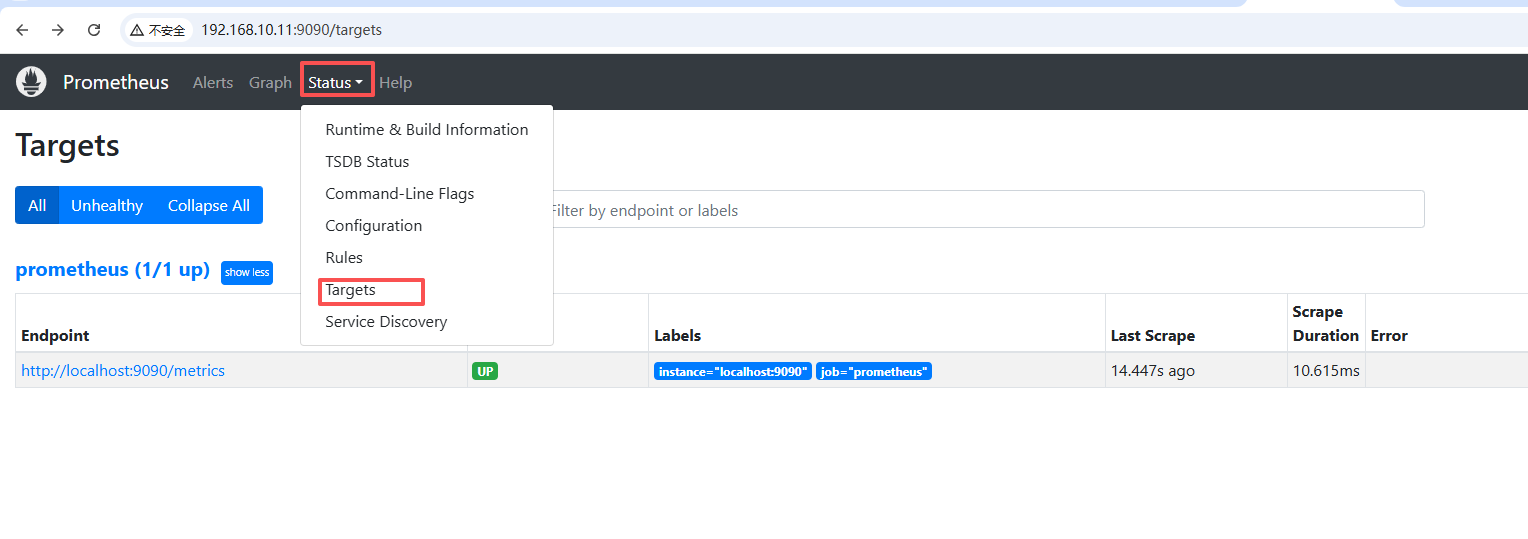
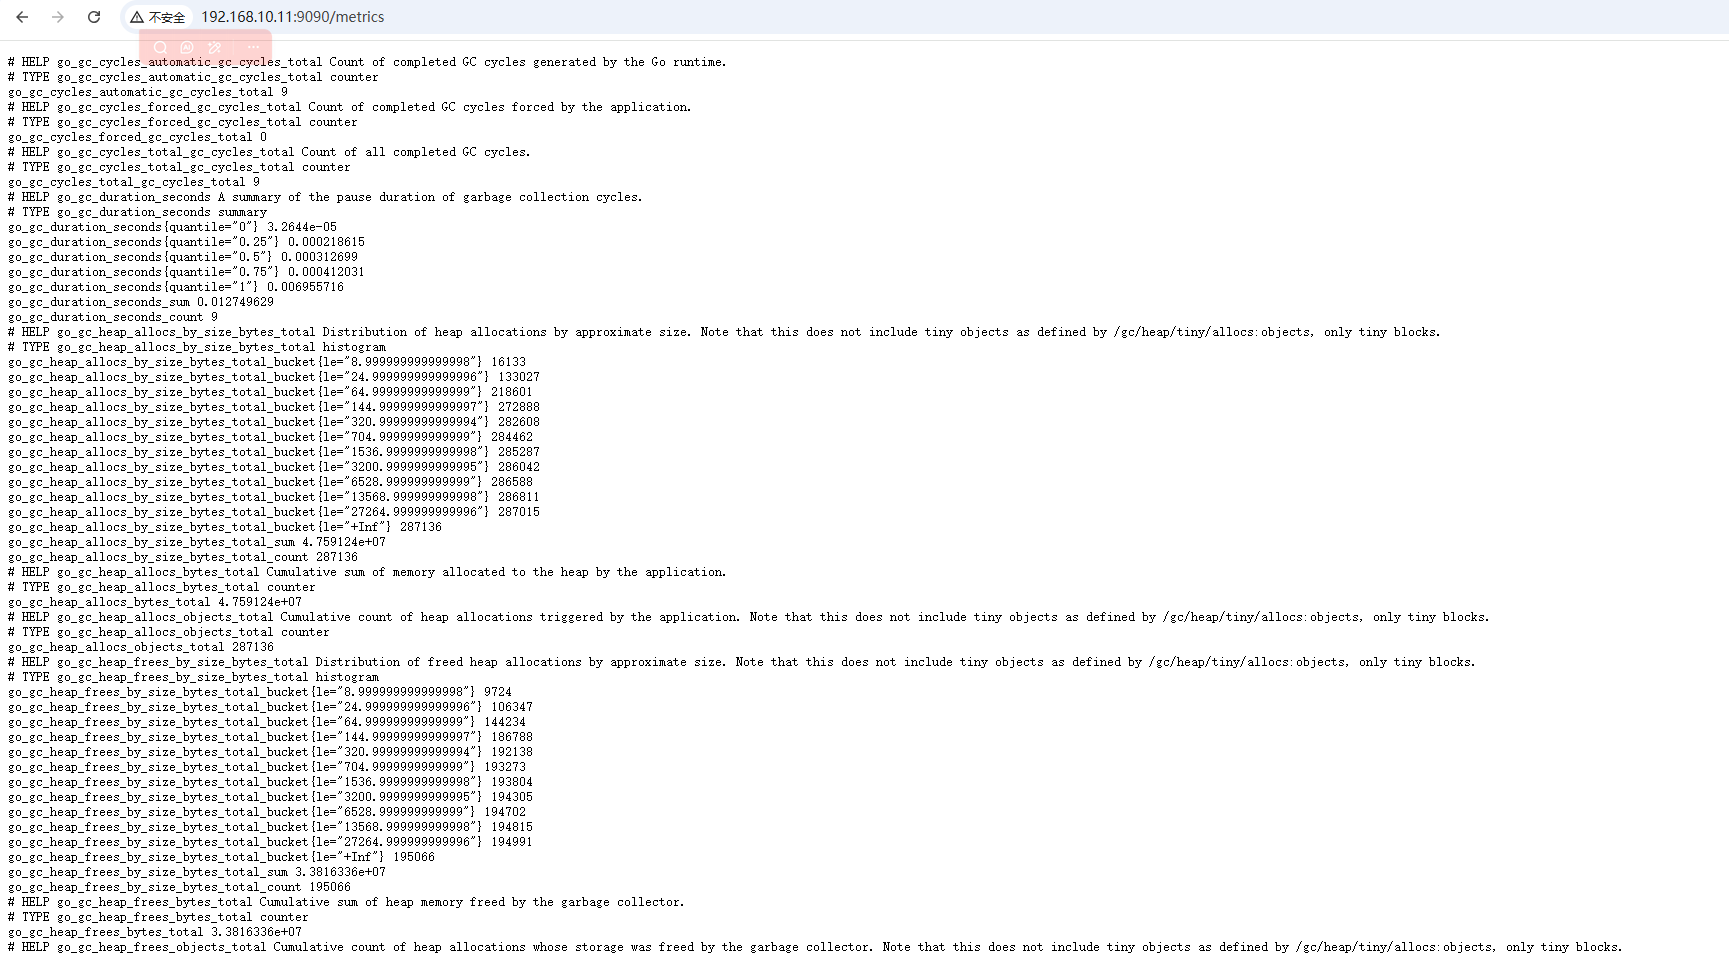
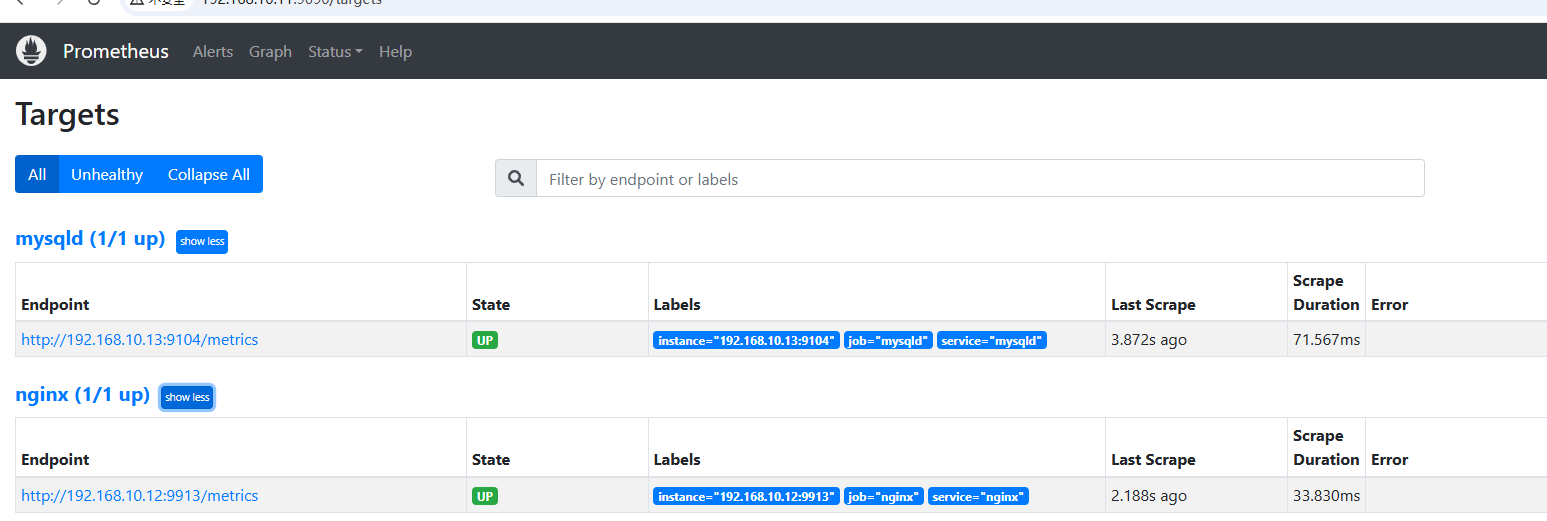
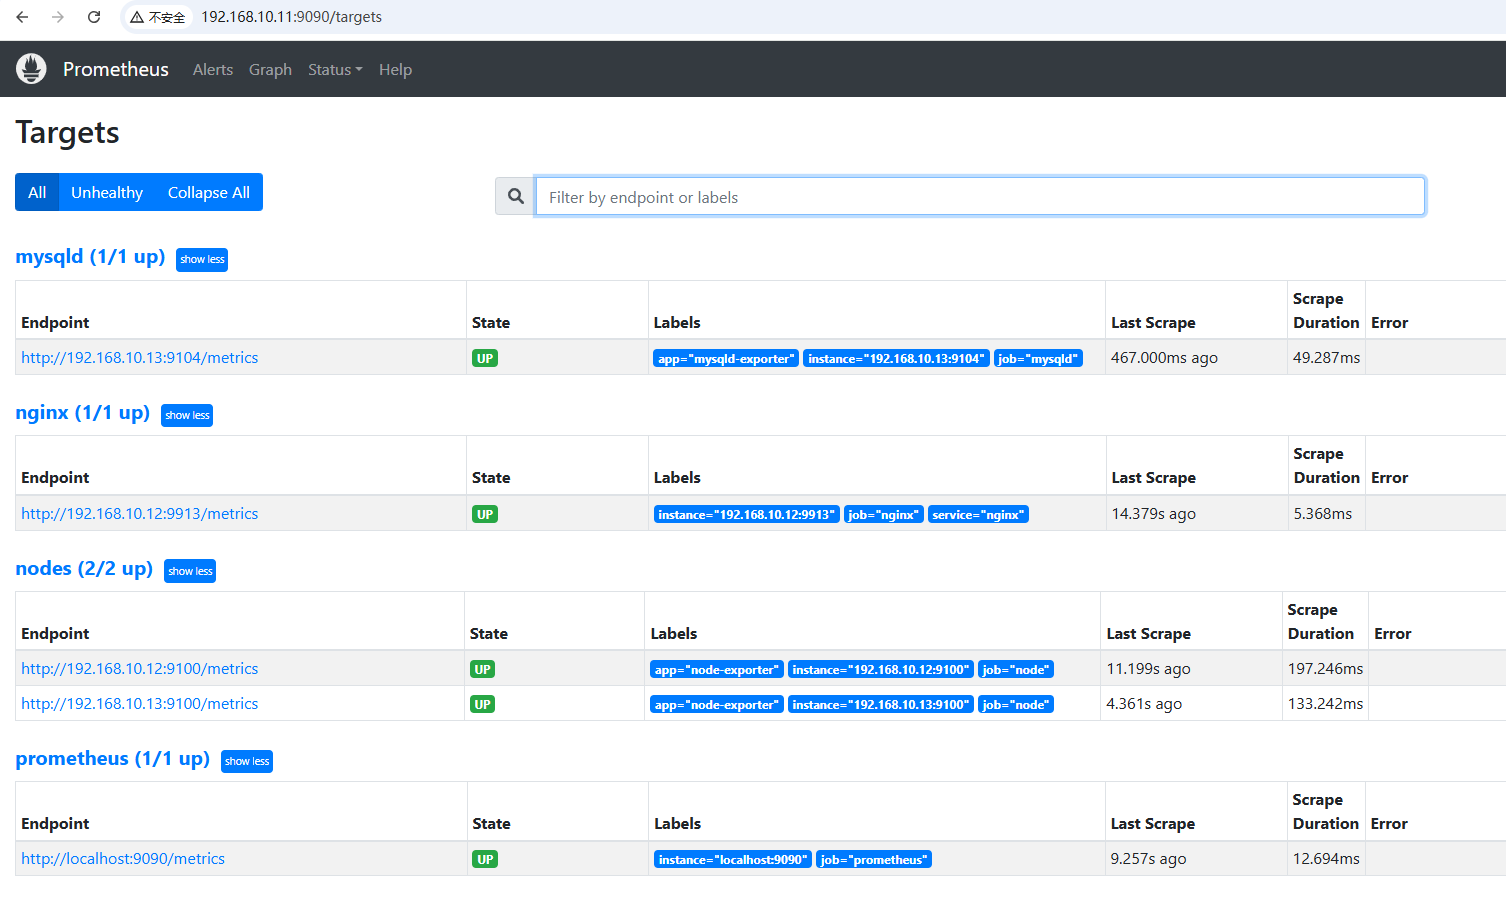
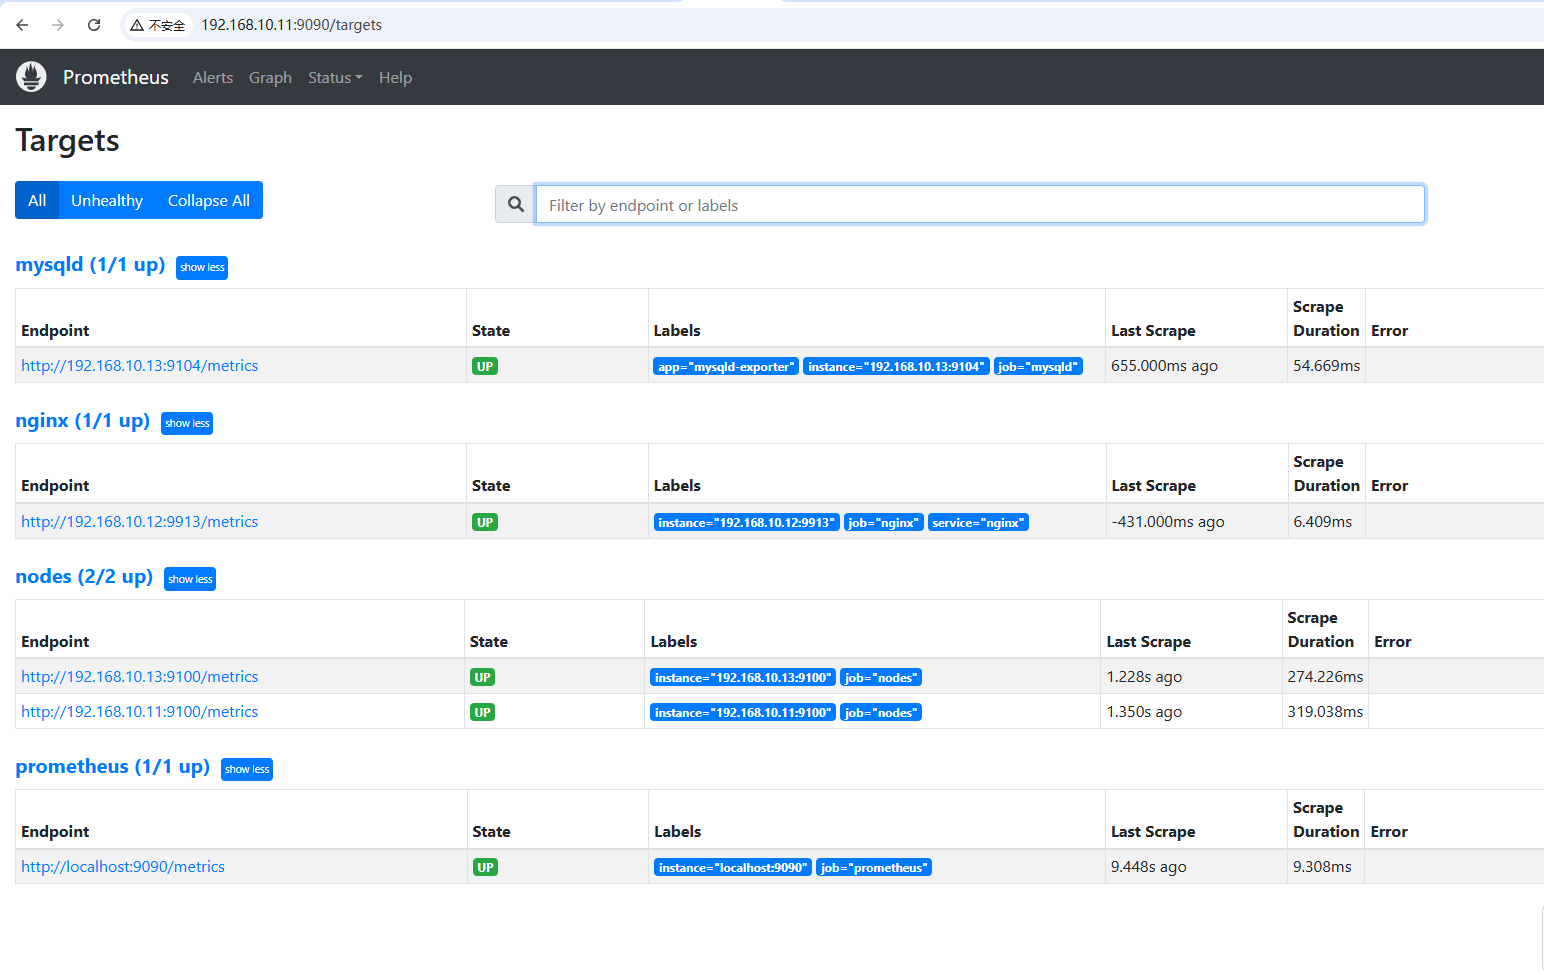
- 验证安装:通过访问 Prometheus 的 Web UI,检查监控目标的状态和采集到的指标数据。
/usr/local/prometheus/prometheus \
>   --config.file=/usr/local/prometheus/prometheus.yml \
>   --storage.tsdb.path=/usr/local/prometheus/data/ \
>   --storage.tsdb.retention=15d \
>   --web.enable-lifecyclehttp://192.168.10.11:9090
1.4.2. 部署 Exporters
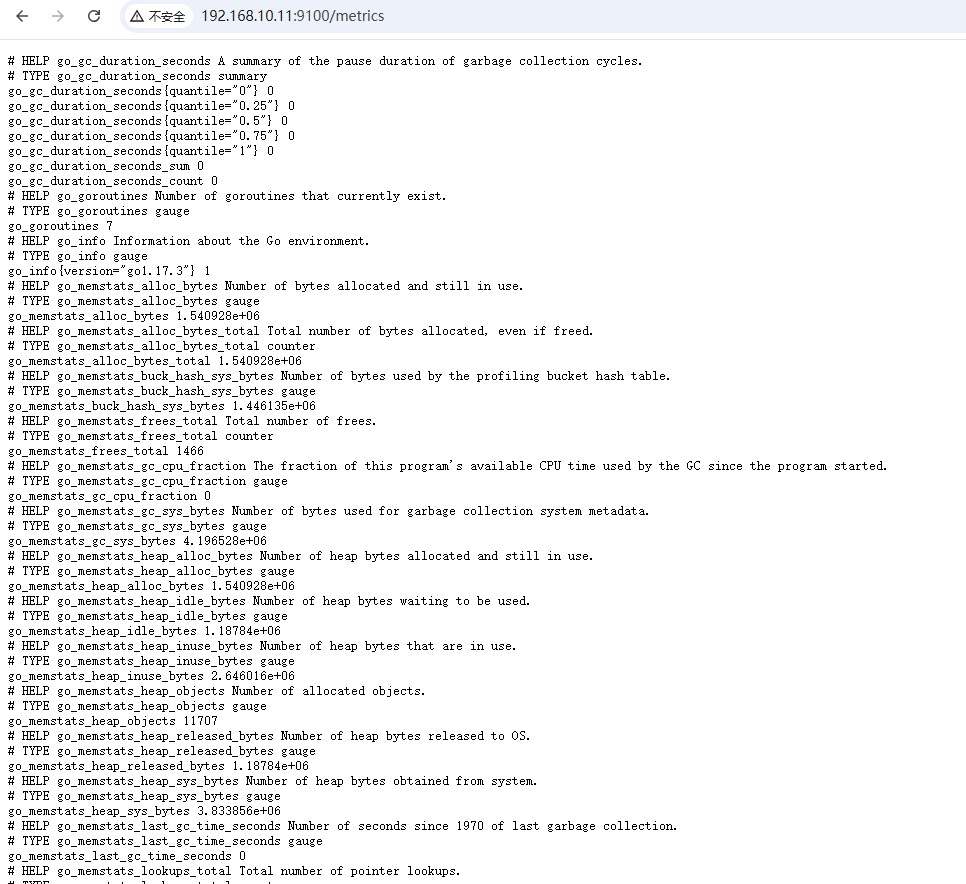
- Node Exporter:用于收集服务器节点的物理指标,如 CPU、内存、磁盘和网络等。
tar xf node_exporter-1.3.1.linux-amd64.tar.gz
mv node_exporter-1.3.1.linux-amd64/node_exporter /usr/local/bin
cat > /usr/lib/systemd/system/node_exporter.service <<'EOF'
[Unit]
Description=node_exporter
Documentation=https://prometheus.io/
After=network.target[Service]
Type=simple
ExecStart=/usr/local/bin/node_exporter \
--collector.ntp \
--collector.mountstats \
--collector.systemd \
--collector.tcpstatExecReload=/bin/kill -HUP $MAINPID
Restart=on-failure[Install]
WantedBy=multi-user.target
EOF
systemctl start node_exporter
systemctl enable node_exporter
netstat -natp | grep :9100
http://192.168.10.12:9100/metrics
-----------------------------------------------------------------------------------
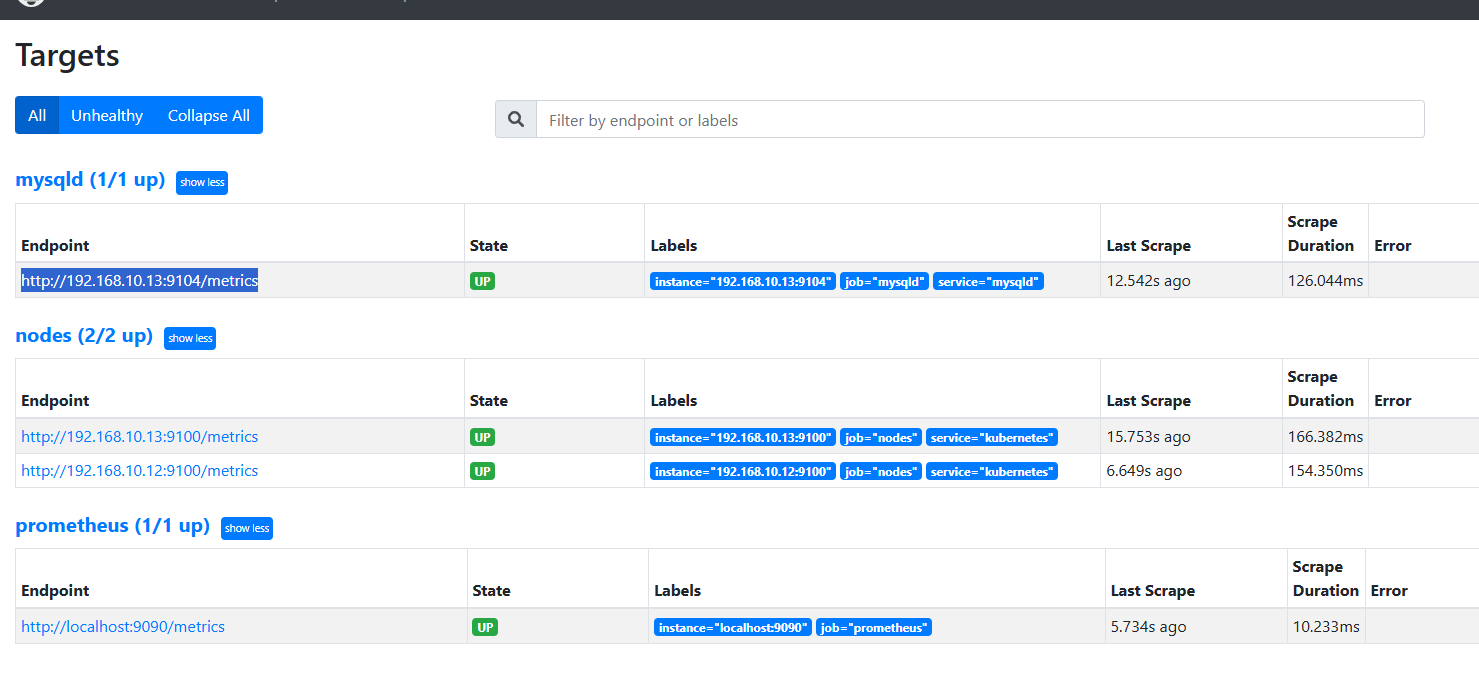
vim /usr/local/prometheus/prometheus.yml
#在尾部增加如下内容- job_name: nodesmetrics_path: "/metrics"static_configs:- targets:- 192.168.10.11:9100- 192.168.10.13:9100- 192.168.10.12:9100labels:service: kubernetes
curl -X POST http://192.168.10.11:9090/-/reload
或
systemctl reload prometheus
- MySQL Exporter:监控 MySQL 数据库的性能指标。
yum -y install mariadb-server
cat > /usr/lib/systemd/system/mysqld_exporter.service <<'EOF'
[Unit]
Description=mysqld_exporter
Documentation=https://prometheus.io/
After=network.target
[Service]
Type=simple
ExecStart=/usr/local/bin/mysqld_exporter --config.my-cnf=/etc/my.cnf
ExecReload=/bin/kill -HUP $MAINPID
Restart=on-failure
[Install]
WantedBy=multi-user.target
EOF
vim /etc/my.cnf
[client]
host=localhost
user=exporter
password=abc123
mysql -uroot -p
GRANT PROCESS, REPLICATION CLIENT, SELECT ON *.* TO 'exporter'@'localhost' IDENTIFIED BY 'abc123';
(5)重启服务
systemctl restart mariadb
systemctl start mysqld_exporter
systemctl enable mysqld_exporter
netstat -natp | grep :9104
vim /usr/local/prometheus/prometheus.yml
#在尾部增加如下内容- job_name: mysqldmetrics_path: "/metrics"static_configs:- targets:- 192.168.10.14:9104labels:service: mysqld
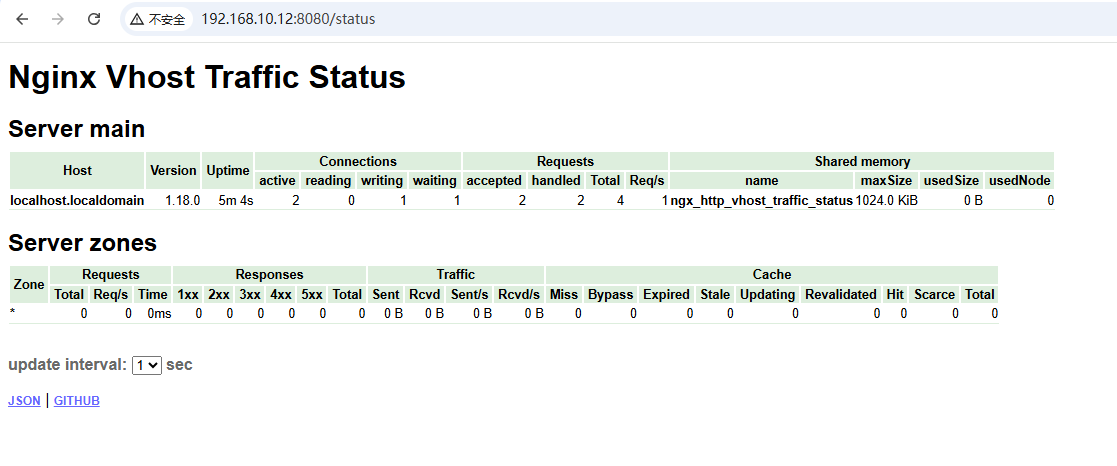
- Nginx Exporter:监控 Nginx 服务器的流量和性能指标。
cd /opt
tar xf nginx-module-vts-0.1.18.tar.gz
mv nginx-module-vts-0.1.18 /usr/local/nginx-module-vtsyum -y install pcre-devel zlib-devel openssl-devel gcc gcc-c++ make
useradd -M -s /sbin/nologin nginx
cd /opt
tar xf nginx-1.18.0.tar.gz
cd nginx-1.18.0/
./configure --prefix=/usr/local/nginx \
--user=nginx \
--group=nginx \
--with-http_stub_status_module \
--with-http_ssl_module \
--add-module=/usr/local/nginx-module-vts
make & make install
vim /usr/local/nginx/conf/nginx.conf
http {vhost_traffic_status_zone;					#添加vhost_traffic_status_filter_by_host on;		#添加,开启此功能,在 Nginx 配置有多个 server_name 的情况下,会根据不同的 server_name 进行流量的统计,否则默认会把流量全部计算到第一个 server_name 上......server {......}server {vhost_traffic_status off;		#在不想统计流量的 server 区域,可禁用 vhost_traffic_statuslisten 8080;allow 127.0.0.1;allow 192.168.10.80;			#设置为 prometheus 的 ip 地址location /nginx-status {stub_status on;access_log off;}location /status {vhost_traffic_status_display;vhost_traffic_status_display_format html;}}
}
ln -s /usr/local/nginx/sbin/nginx /usr/local/sbin/
nginx -t
cat > /lib/systemd/system/nginx.service <<'EOF'
[Unit]
Description=nginx
After=network.target
[Service]
Type=forking
PIDFile=/usr/local/nginx/logs/nginx.pid
ExecStart=/usr/local/nginx/sbin/nginx
ExecReload=/bin/kill -s HUP $MAINPID
ExecStop=/bin/kill -s QUIT $MAINPID
PrivateTmp=true
[Install]
WantedBy=multi-user.target
EOF
systemctl start nginx
systemctl enable nginx
cd /opt/
tar -zxvf nginx-vts-exporter-0.10.3.linux-amd64.tar.gz
mv nginx-vts-exporter-0.10.3.linux-amd64/nginx-vts-exporter /usr/local/bin/cat > /usr/lib/systemd/system/nginx-exporter.service <<'EOF'
[Unit]
Description=nginx-exporter
Documentation=https://prometheus.io/
After=network.target[Service]
Type=simple
ExecStart=/usr/local/bin/nginx-vts-exporter -nginx.scrape_uri=http://localhost:8080/status/format/jsonExecReload=/bin/kill -HUP $MAINPID
Restart=on-failure[Install]
WantedBy=multi-user.target
EOFsystemctl start nginx-exporter
systemctl enable nginx-exporternetstat -natp | grep :9913
1.4.3. 部署 Grafana
- 安装与配置:下载并安装 Grafana,配置 Prometheus 作为数据源。
https://mirrors.bfsu.edu.cn/grafana/yum/rpm/
yum install -y grafana-7.4.0-1.x86_64.rpm
systemctl start grafana-server
systemctl enable grafana-server
http://192.168.10.11:3000
默认账号和密码为 admin/admin
#数据源
Configuration -> Data Sources -> Add data source -> 选择 Prometheus
HTTP -> URL 输入 http://192.168.10.80:9090
点击 Save & Test
点击 上方菜单 Dashboards,Import
| Dashboard 名称 | Dashboard ID | 说明 |
|---|---|---|
| Prometheus 2.0 Overview | 3662 | 官方或社区推荐的 Prometheus 2.0 监控概览面板,包含 Jobs、Targets、性能等 |
| Prometheus 2.0 Stats | 7362 | 显示 Prometheus 自身的统计信息,比如抓取次数、内存、编译时间等 |
| Prometheus | 8563 | 另一个较通用的 Prometheus 监控面板 |
| Node Exporter Full | 1860 | 如果你也监控了 Node Exporter(服务器资源),这个面板非常有用 |
| Kubernetes + Prometheus 相关 | 各种 ID,如 3119, 305 等 | 如果你监控了 K8s 集群 |
Dashboards -> Manage
- 数据可视化:通过导入预定义的仪表盘或自定义仪表盘,实现监控数据的可视化展示。
浏览器访问:https://grafana.com/grafana/dashboards ,在页面中搜索 Node Exporter ,选择适合的面板,点击 Copy ID 或者 Download JSON
在 grafana 页面中,+ Create -> Import ,输入面板 ID 号或者上传 JSON 文件,点击 Load,即可导入监控面板
1.4.4. 部署服务发现
- 基于文件的服务发现:通过配置文件动态管理监控目标。
cd /usr/local/prometheus
mkdir targetsvim targets/node-exporter.yaml
- targets:- 192.168.10.80:9100- 192.168.10.14:9100labels:app: node-exporterjob: nodevim targets/mysqld-exporter.yaml
- targets:- 192.168.10.14:9104- 192.168.10.15:9104labels:app: mysqld-exporterjob: mysqld
vim /usr/local/prometheus/prometheus.yml
scrape_configs:- job_name: nodesfile_sd_configs:                  #指定使用文件服务发现- files:                          #指定要加载的文件列表- targets/node*.yaml            #文件加载支持通配符refresh_interval: 2m            #每隔 2 分钟重新加载一次文件中定义的 Targets,默认为 5m- job_name: mysqldfile_sd_configs:- files:- targets/mysqld*.yamlrefresh_interval: 2m
systemctl reload prometheus
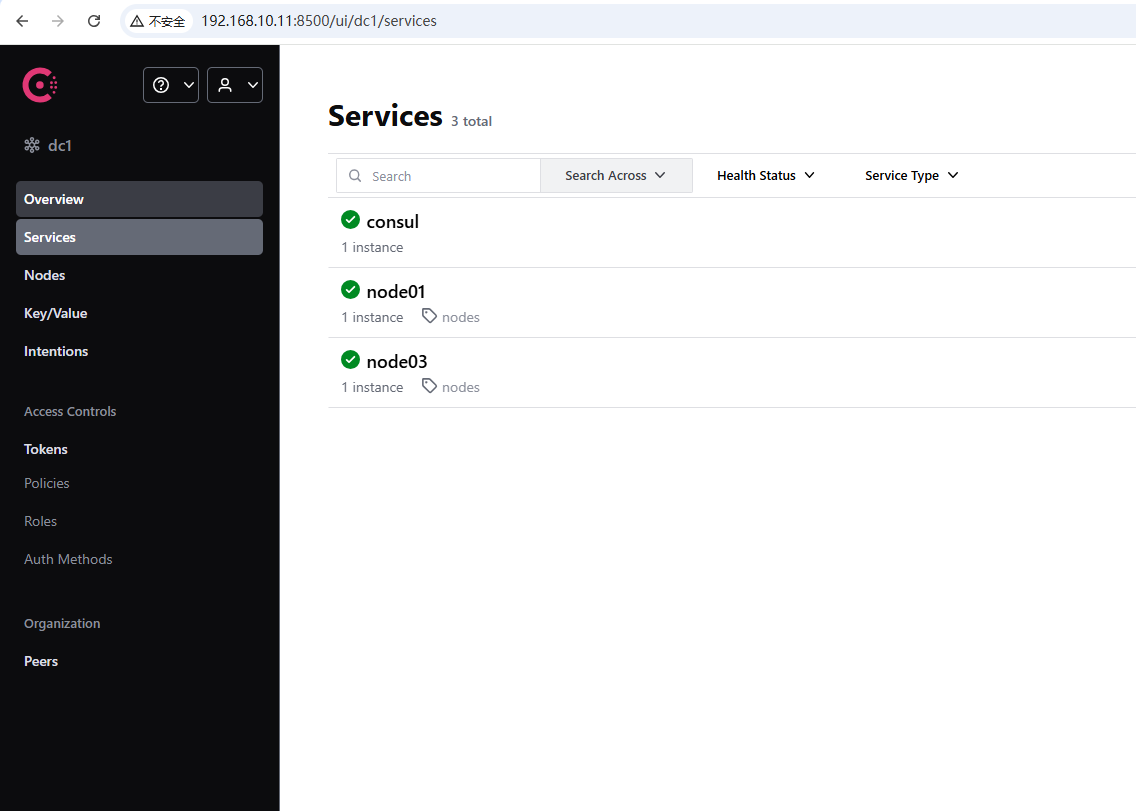
- 基于 Consul 的服务发现:利用 Consul 实现服务注册与发现。
https://www.consul.io/downloads/ #(https://developer.hashicorp.com/)
cd /opt/
unzip consul_1.21.5_linux_386.zip
mv consul /usr/local/bin/
chmod +x /usr/local/bin/consul
#创建 Consul 服务的数据目录和配置目录
mkdir /var/lib/consul-data
mkdir /etc/consul/
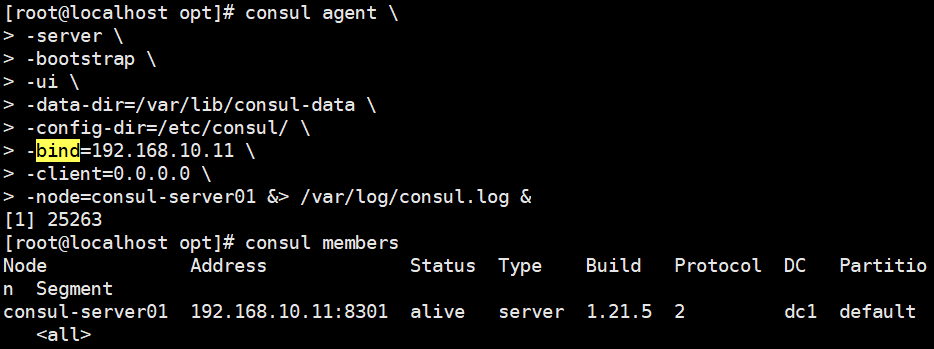
#使用 server 模式启动 Consul 服务
consul agent \
-server \
-bootstrap \
-ui \
-data-dir=/var/lib/consul-data \
-config-dir=/etc/consul/ \
-bind=192.168.10.80 \
-client=0.0.0.0 \
-node=consul-server01 &> /var/log/consul.log &
#查看 consul 集群成员
consul members
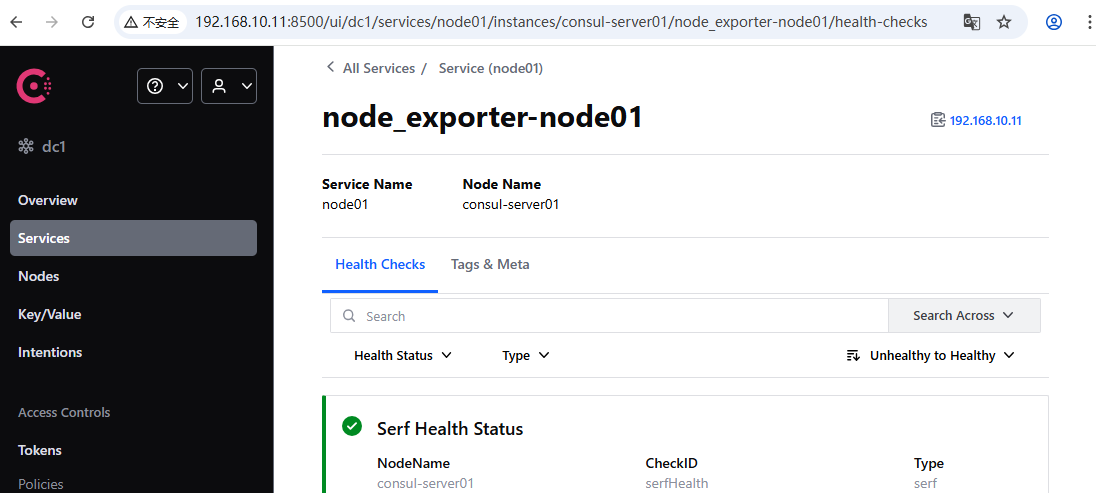
vim /etc/consul/nodes.json
{"services": [{"id": "node_exporter-node01","name": "node01","address": "192.168.10.11","port": 9100,"tags": ["nodes"],"checks": [{"http": "http://192.168.10.11:9100/metrics","interval": "5s"}]},{"id": "node_exporter-node02","name": "node02","address": "192.168.10.12","port": 9100,"tags": ["nodes"],"checks": [{"http": "http://192.168.10.12:9100/metrics","interval": "5s"}]},{"id": "node_exporter-node03","name": "node03","address": "192.168.10.13","port": 9100,"tags": ["nodes"],"checks": [{"http": "http://192.168.10.13:9100/metrics","interval": "5s"}]}]
}
consul reload
vim /usr/local/prometheus/prometheus.yml- job_name: nodesconsul_sd_configs: #指定使用 consul 服务发现- server: 192.168.10.11:8500 #指定 consul 服务的端点列表tags: #指定 consul 服务发现的 services 中哪些 service 能够加入到 prometheus 监控的标签- nodesrefresh_interval: 2m
systemctl reload prometheus
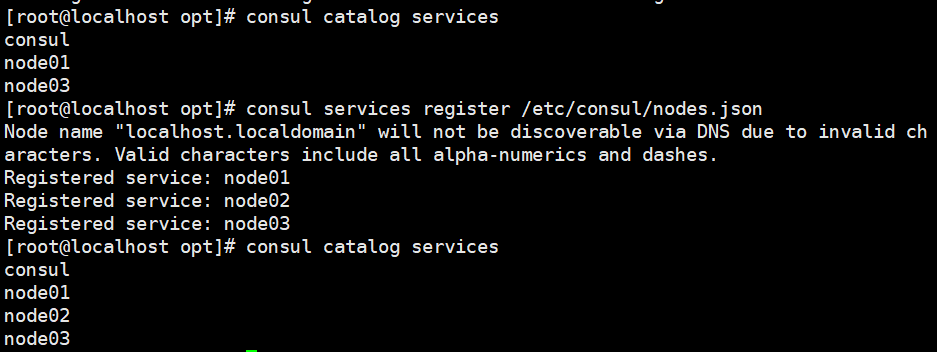
#让 consul 注销 Service
consul services deregister -id="node_exporter-node02"
#重新注册
consul services register /etc/consul/nodes.json
- 基于 Kubernetes 的服务发现:通过 Kubernetes API 动态发现集群中的监控目标。
官网:https://prometheus.io/docs/prometheus/2.47/configuration/configuration/
# The information to access the Kubernetes API.
# The API server addresses. If left empty, Prometheus is assumed to run inside
# of the cluster and will discover API servers automatically
and use the pod's
# CA certificate and bearer token file at /var/run/secrets/kubernetes.io/serviceaccount/.
[ api_server: <host> ]# The Kubernetes role of entities that should be discovered. One of endpoints, service, pod, node, or ingress.
role: <string># Optional authentication information used to authenticate to the API server.
# Note that 'basic_auth', 'bearer_token'和'bearer_token_file' 等认证方式互斥;
[ bearer_token: <secret> ]
[ bearer_token_file: <filename> ]# TLS configuration.
tls_config:
# CA certificate to validate API server certificate with.
[ ca_file: <filename> ]# Certificate and key files for client cert authentication to the server.
[ cert_file: <filename> ]
[ key_file: <filename> ]# ServerName extension to indicate the name of the server.
[ server_name: <string> ]# Optional namespace discovery. If omitted, all namespaces are used.
namespaces:
names:
[ - <string> ]
二、Prometheus 的局限性与解决方案
尽管 Prometheus 功能强大,但也存在一些局限性,如不适合存储事件和日志、本地存储设计主要用于短期数据、集群机制成熟度不高等。针对这些问题,可以考虑以下解决方案:
- 长期数据存储:结合使用 InfluxDB 或 OpenTSDB 等远端存储系统。
- 高可用与集群:基于 Thanos 或 Cortex 实现 Prometheus 的高可用和联邦集群。
结语
Prometheus 作为一个功能强大且灵活的监控系统,为现代应用的监控和告警提供了全面的解决方案。通过本文的介绍,读者应该对 Prometheus 的核心概念、架构、组件、工作原理及部署方法有了全面的了解。希望读者能够根据实际需求,合理利用 Prometheus 及其生态系统中的各个组件,构建高效、可靠的监控体系,确保系统的稳定运行和高效管理。未来,随着技术的不断发展,Prometheus 将继续在监控领域发挥重要作用,为用户提供更加优质的服务。