设备管理平台项目部署文档(含自动化脚本)
目录
一、环境规划
1.1 节点信息表
1.2 前置要求
二、节点部署(含自动化脚本)
2.1 MySQL 节点部署
2.1.1 手动部署步骤
2.1.2 自动化脚本(mysql_deploy.sh)
2.2 Redis 节点部署
2.2.1 手动部署步骤
2.2.2 自动化脚本(redis_deploy.sh)
2.3 Java 节点部署
2.3.1 手动部署步骤
2.3.2 自动化脚本(java_deploy.sh)
2.4 Nginx 节点部署
2.4.1 手动部署步骤
2.4 Nginx 节点部署
2.4.2 自动化脚本(nginx_deploy.sh)
2.5 ELK 节点部署(日志处理核心)
2.5.1 手动部署步骤
2.5.2 自动化脚本(elk_deploy.sh 续)
三、整体验证与测试
3.1 业务功能验证
3.2 日志收集验证
3.2.1 生成测试日志
3.2.2 Kibana 查看日志
四、常见问题排查
4.1 服务启动失败
4.2 日志收集不到
五、部署完成确认清单
一、环境规划
1.1 节点信息表
| 节点名称 | IP 地址 | 部署服务 | 特殊说明 |
|---|---|---|---|
| mysql | 172.16.0.100 | mysql + filebeat | IP 不可变,需存储业务数据库 |
| nginx | 172.16.0.10 | nginx + filebeat + kibana | 承载前端页面与 Kibana 可视化 |
| java | 172.16.0.11 | openjdk + filebeat | 运行微服务 Jar 包 |
| redis | 172.16.0.12 | redis | IP 不可变,提供缓存服务 |
| elk | 172.16.0.13 | Elasticsearch + Logstash | 需更高内存(建议 4G),日志处理核心 |
1.2 前置要求
- 所有节点关闭防火墙与 SELinux(增强功能)
# 关闭防火墙(永久生效) systemctl stop firewalld && systemctl disable firewalld # 关闭SELinux(永久生效,需重启) sed -i 's/SELINUX=enforcing/SELINUX=disabled/' /etc/selinux/config setenforce 0 # 临时生效 - 所有节点提前准备依赖工具(wget、unzip、gcc 等)
yum install -y wget unzip gcc gcc-c++ make pcre pcre-devel zlib zlib-devel openssl openssl-devel - 软件包准备:将以下包上传至对应节点的
/opt目录- mysql 节点:
mysql5720_rpms.tar.gz、yl_app.sql - redis 节点:
redis-5.0.7.tar.gz - nginx 节点:
nginx-1.20.2.tar.gz、dist.zip、kibana-6.6.1-x86_64.rpm、filebeat-6.6.1-x86_64.rpm - java 节点:
yl_application-1.0-SNAPSHOT.jar、filebeat-6.6.1-x86_64.rpm - elk 节点:
elasticsearch-6.6.1.rpm、logstash-6.6.1.rpm、filebeat-6.6.1-x86_64.rpm
- mysql 节点:
二、节点部署(含自动化脚本)
2.1 MySQL 节点部署
2.1.1 手动部署步骤
- 解压并安装 MySQL RPM 包
cd /opt tar zxvf mysql5720_rpms.tar.gz cd mysql5720_rpms yum localinstall -y *.rpm - 启动 MySQL 并初始化密码
systemctl start mysqld && systemctl enable mysqld # 获取初始密码 init_pass=$(grep "password" /var/log/mysqld.log | awk '{print $NF}') # 修改初始密码为Admin@123 mysql -uroot -p"$init_pass" --connect-expired-password -e "ALTER USER 'root'@'localhost' IDENTIFIED BY 'Admin@123';" - 配置 MySQL(日志、密码策略)
# 备份原配置 cp /etc/my.cnf /etc/my.cnf.bak # 写入配置 cat >> /etc/my.cnf << EOF [mysqld] validate_password_policy=LOW validate_password_length=6 log_error = /var/log/mysql/mysql_error.log slow_query_log = ON slow_query_log_file = /var/log/mysql/mysql_slow.log long_query_time = 2 log_queries_not_using_indexes = ON EOF # 创建日志目录并授权 mkdir -p /var/log/mysql chown -R mysql:mysql /var/log/mysql # 重启MySQL并修改业务密码(123456) systemctl restart mysqld mysql -uroot -pAdmin@123 -e "ALTER USER 'root'@'localhost' IDENTIFIED BY '123456';" - 导入业务 SQL
mysql -uroot -p123456 < /opt/yl_app.sql # 验证导入结果 mysql -uroot -p123456 -e "use yl_app; show tables;" - 安装并配置 Filebeat(收集 MySQL 日志)
# 安装Filebeat
rpm -ivh /opt/filebeat-6.6.1-x86_64.rpm
# 配置Filebeat
cp /etc/filebeat/filebeat.yml /etc/filebeat/filebeat.yml.bak
cat > /etc/filebeat/filebeat.yml << EOF
filebeat.inputs:
- type: logenabled: truepaths:- /var/log/mysql/mysql_error.logfields:service_name: mysql_error_loglog_type: mysql_errorfields_under_root: true
- type: logenabled: truepaths:- /var/log/mysql/mysql_slow.logfields:service_name: mysql_slow_loglog_type: mysql_slowfields_under_root: true# 注释Elasticsearch输出,启用Logstash输出
#output.elasticsearch:
#  hosts: ["localhost:9200"]
output.logstash:hosts: ["172.16.0.13:6000"]
EOF
# 启动Filebeat
systemctl start filebeat && systemctl enable filebeat
# 验证输出连接
filebeat test output -c /etc/filebeat/filebeat.yml
2.1.2 自动化脚本(mysql_deploy.sh)
#!/bin/bash
# MySQL节点自动化部署脚本
set -e  # 出错即退出# 1. 安装依赖
yum install -y wget unzip gcc gcc-c++ make pcre pcre-devel zlib zlib-devel openssl openssl-devel# 2. 安装MySQL
echo "=== 开始安装MySQL ==="
cd /opt
tar zxvf mysql5720_rpms.tar.gz
cd mysql5720_rpms
yum localinstall -y *.rpm# 3. 初始化MySQL
systemctl start mysqld && systemctl enable mysqld
init_pass=$(grep "password" /var/log/mysqld.log | awk '{print $NF}')
mysql -uroot -p"$init_pass" --connect-expired-password -e "ALTER USER 'root'@'localhost' IDENTIFIED BY 'Admin@123';"# 4. 配置MySQL
cp /etc/my.cnf /etc/my.cnf.bak
cat >> /etc/my.cnf << EOF
[mysqld]
validate_password_policy=LOW
validate_password_length=6
log_error = /var/log/mysql/mysql_error.log
slow_query_log = ON
slow_query_log_file = /var/log/mysql/mysql_slow.log
long_query_time = 2
log_queries_not_using_indexes = ON
EOF
mkdir -p /var/log/mysql
chown -R mysql:mysql /var/log/mysql
systemctl restart mysqld
mysql -uroot -pAdmin@123 -e "ALTER USER 'root'@'localhost' IDENTIFIED BY '123456';"# 5. 导入SQL
echo "=== 开始导入业务SQL ==="
mysql -uroot -p123456 < /opt/yl_app.sql
mysql -uroot -p123456 -e "use yl_app; show tables;" && echo "SQL导入成功"# 6. 配置Filebeat
echo "=== 开始配置Filebeat ==="
rpm -ivh /opt/filebeat-6.6.1-x86_64.rpm
cp /etc/filebeat/filebeat.yml /etc/filebeat/filebeat.yml.bak
cat > /etc/filebeat/filebeat.yml << EOF
filebeat.inputs:
- type: logenabled: truepaths:- /var/log/mysql/mysql_error.logfields:service_name: mysql_error_loglog_type: mysql_errorfields_under_root: true
- type: logenabled: truepaths:- /var/log/mysql/mysql_slow.logfields:service_name: mysql_slow_loglog_type: mysql_slowfields_under_root: trueoutput.logstash:hosts: ["172.16.0.13:6000"]
EOF
systemctl start filebeat && systemctl enable filebeat
filebeat test output -c /etc/filebeat/filebeat.yml && echo "Filebeat配置成功"echo "=== MySQL节点部署完成 ==="
2.2 Redis 节点部署
2.2.1 手动部署步骤
- 解压并编译安装 Redis
cd /opt tar zxvf redis-5.0.7.tar.gz -C /opt/ cd /opt/redis-5.0.7/ make && make PREFIX=/usr/local/redis install - 配置 Redis 服务
# 执行服务配置脚本 cd /opt/redis-5.0.7/utils ./install_server.sh # 所有选项按回车,最后手动输入/usr/local/redis/bin/redis-server # 创建软链接 ln -s /usr/local/redis/bin/* /usr/local/bin/ - 修改 Redis 配置(允许远程访问)
# 编辑配置文件(默认端口6379)
vim /etc/redis/6379.conf
# 修改以下内容
bind 0.0.0.0        # 第70行,允许所有IP访问
protected-mode no   # 第89行,关闭保护模式
# 重启Redis
/etc/init.d/redis_6379 restart
# 验证端口
netstat -antp | grep 6379
2.2.2 自动化脚本(redis_deploy.sh)
#!/bin/bash
set -e# 1. 安装依赖
yum install -y gcc gcc-c++ make# 2. 安装Redis
echo "=== 开始安装Redis ==="
cd /opt
tar zxvf redis-5.0.7.tar.gz -C /opt/
cd /opt/redis-5.0.7/
make && make PREFIX=/usr/local/redis install# 3. 配置Redis服务
echo "=== 开始配置Redis服务 ==="
cd /opt/redis-5.0.7/utils
# 自动应答install_server.sh(避免交互)
echo -e "\n\n\n\n/usr/local/redis/bin/redis-server" | ./install_server.sh
ln -s /usr/local/redis/bin/* /usr/local/bin/# 4. 修改配置并重启
sed -i 's/bind 127.0.0.1/bind 0.0.0.0/' /etc/redis/6379.conf
sed -i 's/protected-mode yes/protected-mode no/' /etc/redis/6379.conf
/etc/init.d/redis_6379 restart# 5. 验证
netstat -antp | grep 6379 && echo "=== Redis节点部署完成 ==="
2.3 Java 节点部署
2.3.1 手动部署步骤
- 安装 OpenJDK
yum install -y java-1.8.0-openjdk java-1.8.0-openjdk-devel java -version # 验证版本 - 部署微服务 Jar 包
# 上传Jar包至/opt目录后,创建启动脚本 cat > /opt/start_java.sh << EOF #!/bin/bash nohup java -Xms512m -Xmx2g -jar /opt/yl_application-1.0-SNAPSHOT.jar & echo "微服务已启动,日志路径:/opt/logs/" EOF chmod +x /opt/start_java.sh # 启动微服务 /opt/start_java.sh # 验证日志 tail -f /opt/logs/yulin-$(date +%Y-%m-%d).0.log - 配置 Filebeat(收集微服务日志)
rpm -ivh /opt/filebeat-6.6.1-x86_64.rpm
cp /etc/filebeat/filebeat.yml /etc/filebeat/filebeat.yml.bak
cat > /etc/filebeat/filebeat.yml << EOF
filebeat.inputs:
- type: logenabled: truepaths:- /opt/logs/yulin-*.logfields:service_name: yvlin_loglog_type: java_businessfields_under_root: trueoutput.logstash:hosts: ["172.16.0.13:6002"]
EOF
systemctl start filebeat && systemctl enable filebeat
filebeat test output -c /etc/filebeat/filebeat.yml
2.3.2 自动化脚本(java_deploy.sh)
#!/bin/bash
set -e# 1. 安装JDK
echo "=== 开始安装JDK ==="
yum install -y java-1.8.0-openjdk java-1.8.0-openjdk-devel
java -version && echo "JDK安装完成"# 2. 部署微服务
echo "=== 开始部署微服务 ==="
cat > /opt/start_java.sh << EOF
#!/bin/bash
nohup java -Xms512m -Xmx2g -jar /opt/yl_application-1.0-SNAPSHOT.jar &
EOF
chmod +x /opt/start_java.sh
/opt/start_java.sh
sleep 5
tail -n 10 /opt/logs/yulin-$(date +%Y-%m-%d).0.log && echo "微服务启动成功"# 3. 配置Filebeat
echo "=== 开始配置Filebeat ==="
rpm -ivh /opt/filebeat-6.6.1-x86_64.rpm
cp /etc/filebeat/filebeat.yml /etc/filebeat/filebeat.yml.bak
cat > /etc/filebeat/filebeat.yml << EOF
filebeat.inputs:
- type: logenabled: truepaths:- /opt/logs/yulin-*.logfields:service_name: yvlin_loglog_type: java_businessfields_under_root: trueoutput.logstash:hosts: ["172.16.0.13:6002"]
EOF
systemctl start filebeat && systemctl enable filebeat
filebeat test output -c /etc/filebeat/filebeat.yml && echo "=== Java节点部署完成 ==="
2.4 Nginx 节点部署
2.4.1 手动部署步骤
- 安装 Nginx
# 创建nginx用户 useradd -M -s /sbin/nologin nginx # 解压并编译 cd /opt tar zxvf nginx-1.20.2.tar.gz cd nginx-1.20.2/ ./configure \ --prefix=/usr/local/nginx \ --user=nginx \ --group=nginx \ --with-http_stub_status_module \ --with-http_ssl_module make && make install # 创建软链接 ln -s /usr/local/nginx/sbin/nginx /usr/local/sbin/ - 配置 Nginx 系统服务
cat > /lib/systemd/system/nginx.service << EOF
[Unit]
Description=nginx
After=network.target[Service]
Type=forking
PIDFile=/usr/local/nginx/logs/nginx.pid
ExecStart=/usr/local/nginx/sbin/nginx
ExecReload=/bin/kill -s HUP \$MAINPID
ExecStop=/bin/kill -s QUIT \$MAINPID
PrivateTmp=true[Install]
WantedBy=multi-user.target
EOF
chmod 754 /lib/systemd/system/nginx.service
systemctl daemon-reload
2.4 Nginx 节点部署
- 部署前端页面并配置 Nginx
# 解压前端包 unzip /opt/dist.zip -d /usr/local/nginx/html # 备份原配置 cp /usr/local/nginx/conf/nginx.conf /usr/local/nginx/conf/nginx.conf.bak # 写入业务配置 cat > /usr/local/nginx/conf/nginx.conf << EOF worker_processes 1;events {worker_connections 1024; }http {include mime.types;default_type application/octet-stream;sendfile on;keepalive_timeout 65;server {listen 80;server_name 172.16.0.10;charset utf-8;index index.html index.htm;root /usr/local/nginx/html/dist;# 反向代理微服务location /ylApp {proxy_set_header X-Real-IP \$remote_addr;proxy_set_header X-Forwarded-For \$proxy_add_x_forwarded_for;proxy_set_header Host \$http_host;proxy_set_header X-NginX-Proxy true;proxy_pass http://172.16.0.11:8090; # 指向Java微服务节点proxy_redirect off;}# 错误页面error_page 500 502 503 504 /50x.html;location = /50x.html {root html;}} } EOF # 启动并设置开机自启 systemctl start nginx && systemctl enable nginx # 验证Nginx启动 netstat -antp | grep 80 && echo "Nginx启动成功" - 安装并配置 Kibana(日志可视化)
# 安装Kibana rpm -ivh /opt/kibana-6.6.1-x86_64.rpm # 备份原配置 cp /etc/kibana/kibana.yml /etc/kibana/kibana.yml.bak # 写入配置(关联ELK节点的ES服务) cat > /etc/kibana/kibana.yml << EOF server.port: 5601 server.host: "0.0.0.0" elasticsearch.hosts: ["http://172.16.0.13:9200"] # 指向ELK节点的ES kibana.index: ".kibana" EOF # 启动Kibana并设置开机自启 systemctl start kibana && systemctl enable kibana # 验证Kibana启动 netstat -antp | grep 5601 && echo "Kibana启动成功" - 配置 Filebeat(收集 Nginx 日志)
# 安装Filebeat
rpm -ivh /opt/filebeat-6.6.1-x86_64.rpm
# 备份原配置
cp /etc/filebeat/filebeat.yml /etc/filebeat/filebeat.yml.bak
# 写入日志收集配置
cat > /etc/filebeat/filebeat.yml << EOF
filebeat.inputs:
- type: logenabled: truepaths:- /usr/local/nginx/logs/access.log  # Nginx访问日志fields:service_name: nginx_access_loglog_type: nginx_accessfields_under_root: true
- type: logenabled: truepaths:- /usr/local/nginx/logs/error.log   # Nginx错误日志fields:service_name: nginx_error_loglog_type: nginx_errorfields_under_root: true# 禁用ES输出,启用Logstash输出
#output.elasticsearch:
#  hosts: ["localhost:9200"]
output.logstash:hosts: ["172.16.0.13:6001"]  # 指向ELK节点的Logstash
EOF
# 启动Filebeat并设置开机自启
systemctl start filebeat && systemctl enable filebeat
# 验证Filebeat连接
filebeat test output -c /etc/filebeat/filebeat.yml && echo "Nginx节点Filebeat配置成功"
2.4.2 自动化脚本(nginx_deploy.sh)
#!/bin/bash
set -e  # 出错即退出# 1. 安装依赖与Nginx
echo "=== 开始安装Nginx ==="
yum install -y gcc gcc-c++ make pcre pcre-devel zlib zlib-devel openssl openssl-devel unzip
useradd -M -s /sbin/nologin nginx# 解压编译Nginx
cd /opt
tar zxvf nginx-1.20.2.tar.gz
cd nginx-1.20.2/
./configure \
--prefix=/usr/local/nginx \
--user=nginx \
--group=nginx \
--with-http_stub_status_module \
--with-http_ssl_module
make && make install
ln -s /usr/local/nginx/sbin/nginx /usr/local/sbin/# 2. 配置Nginx系统服务
echo "=== 配置Nginx系统服务 ==="
cat > /lib/systemd/system/nginx.service << EOF
[Unit]
Description=nginx
After=network.target[Service]
Type=forking
PIDFile=/usr/local/nginx/logs/nginx.pid
ExecStart=/usr/local/nginx/sbin/nginx
ExecReload=/bin/kill -s HUP \$MAINPID
ExecStop=/bin/kill -s QUIT \$MAINPID
PrivateTmp=true[Install]
WantedBy=multi-user.target
EOF
chmod 754 /lib/systemd/system/nginx.service
systemctl daemon-reload# 3. 部署前端与配置反向代理
echo "=== 部署前端页面 ==="
unzip /opt/dist.zip -d /usr/local/nginx/html
cp /usr/local/nginx/conf/nginx.conf /usr/local/nginx/conf/nginx.conf.bak# 写入Nginx业务配置
cat > /usr/local/nginx/conf/nginx.conf << EOF
worker_processes  1;events {worker_connections  1024;
}http {include       mime.types;default_type  application/octet-stream;sendfile        on;keepalive_timeout  65;server {listen       80;server_name  172.16.0.10;charset utf-8;index index.html index.htm;root /usr/local/nginx/html/dist;location /ylApp {proxy_set_header X-Real-IP \$remote_addr;proxy_set_header X-Forwarded-For \$proxy_add_x_forwarded_for;proxy_set_header Host \$http_host;proxy_set_header X-NginX-Proxy true;proxy_pass http://172.16.0.11:8090;proxy_redirect off;}error_page   500 502 503 504  /50x.html;location = /50x.html {root   html;}}
}
EOF# 启动Nginx
systemctl start nginx && systemctl enable nginx
netstat -antp | grep 80 && echo "Nginx启动成功"# 4. 安装配置Kibana
echo "=== 安装配置Kibana ==="
rpm -ivh /opt/kibana-6.6.1-x86_64.rpm
cp /etc/kibana/kibana.yml /etc/kibana/kibana.yml.bakcat > /etc/kibana/kibana.yml << EOF
server.port: 5601
server.host: "0.0.0.0"
elasticsearch.hosts: ["http://172.16.0.13:9200"]
kibana.index: ".kibana"
EOFsystemctl start kibana && systemctl enable kibana
netstat -antp | grep 5601 && echo "Kibana启动成功"# 5. 配置Filebeat
echo "=== 配置Filebeat ==="
rpm -ivh /opt/filebeat-6.6.1-x86_64.rpm
cp /etc/filebeat/filebeat.yml /etc/filebeat/filebeat.yml.bakcat > /etc/filebeat/filebeat.yml << EOF
filebeat.inputs:
- type: logenabled: truepaths:- /usr/local/nginx/logs/access.logfields:service_name: nginx_access_loglog_type: nginx_accessfields_under_root: true
- type: logenabled: truepaths:- /usr/local/nginx/logs/error.logfields:service_name: nginx_error_loglog_type: nginx_errorfields_under_root: trueoutput.logstash:hosts: ["172.16.0.13:6001"]
EOFsystemctl start filebeat && systemctl enable filebeat
filebeat test output -c /etc/filebeat/filebeat.yml && echo "=== Nginx节点部署完成 ==="
2.5 ELK 节点部署(日志处理核心)
2.5.1 手动部署步骤
- 环境预处理(优化 ES 内存配置)
# 调整系统内核参数(适配ES要求) cat >> /etc/sysctl.conf << EOF vm.max_map_count=262144 # ES要求的虚拟内存映射数 fs.file-max=65535 # 最大文件句柄数 EOF sysctl -p # 使内核参数生效# 调整用户资源限制 cat >> /etc/security/limits.conf << EOF elasticsearch soft nofile 65535 elasticsearch hard nofile 65535 elasticsearch soft nproc 4096 elasticsearch hard nproc 4096 EOF - 安装并配置 Elasticsearch(ES)
# 安装JDK(ES依赖Java) yum install -y java-1.8.0-openjdk java-1.8.0-openjdk-devel java -version && echo "JDK安装完成"# 安装ES cd /opt rpm -ivh elasticsearch-6.6.1.rpm # 加载系统服务 systemctl daemon-reload && systemctl enable elasticsearch# 配置ES核心参数 cp /etc/elasticsearch/elasticsearch.yml /etc/elasticsearch/elasticsearch.yml.bak cat > /etc/elasticsearch/elasticsearch.yml << EOF cluster.name: yl-elk-cluster # 集群名称(自定义) node.name: node1 # 节点名称(唯一) path.data: /data/elk_data # 数据存储路径 path.logs: /var/log/elasticsearch # 日志路径 bootstrap.memory_lock: false # 关闭内存锁定(避免低内存环境报错) network.host: 0.0.0.0 # 允许所有IP访问 http.port: 9200 # ES默认端口 discovery.type: single-node # 单节点模式(非集群) EOF# 创建数据目录并授权 mkdir -p /data/elk_data chown -R elasticsearch:elasticsearch /data/elk_data/ chmod 755 /data/elk_data/# 启动ES(首次启动可能需30秒以上) systemctl start elasticsearch # 验证ES启动(返回JSON信息即成功) curl http://172.16.0.13:9200 && echo "ES启动成功" - 安装并配置 Logstash(日志过滤转发)
# 安装Logstash
cd /opt
rpm -ivh logstash-6.6.1.rpm
# 加载系统服务
systemctl daemon-reload && systemctl enable logstash
# 创建软链接(便于命令调用)
ln -s /usr/share/logstash/bin/logstash /usr/local/bin/# 1. 创建MySQL日志处理配置(对应MySQL节点Filebeat)
cat > /etc/logstash/conf.d/mysql_log.conf << EOF
input {beats {port => 6000  # 接收MySQL节点Filebeat的端口}
}
filter {# 日志时间格式化(可选,按实际日志格式调整)date {match => ["timestamp", "yyyy-MM-dd HH:mm:ss"]target => "@timestamp"}
}
output {# 输出到ES(按服务名+日期创建索引)elasticsearch {hosts => ["http://172.16.0.13:9200"]index => "%{service_name}-%{+YYYY.MM.dd}"}# 同时输出到控制台(调试用,生产可注释)stdout {codec => rubydebug}
}
EOF# 2. 创建Nginx日志处理配置(对应Nginx节点Filebeat)
cat > /etc/logstash/conf.d/nginx_log.conf << EOF
input {beats {port => 6001  # 接收Nginx节点Filebeat的端口}
}
filter {# Nginx日志格式解析(按实际日志格式调整)grok {match => { "message" => "%{IPORHOST:client_ip} %{USER:ident} %{USER:auth} \[%{HTTPDATE:timestamp}\] \"%{WORD:method} %{URIPATHPARAM:request} HTTP/%{NUMBER:http_version}\" %{NUMBER:response} %{NUMBER:bytes} \"%{DATA:referrer}\" \"%{DATA:user_agent}\"" }}
}
output {elasticsearch {hosts => ["http://172.16.0.13:9200"]index => "%{service_name}-%{+YYYY.MM.dd}"}stdout {codec => rubydebug}
}
EOF# 3. 创建Java日志处理配置(对应Java节点Filebeat)
cat > /etc/logstash/conf.d/java_log.conf << EOF
input {beats {port => 6002  # 接收Java节点Filebeat的端口}
}
filter {# Java日志时间解析(按微服务日志格式调整)date {match => ["timestamp", "yyyy-MM-dd HH:mm:ss.SSS"]target => "@timestamp"}
}
output {elasticsearch {hosts => ["http://172.16.0.13:9200"]index => "%{service_name}-%{+YYYY.MM.dd}"}stdout {codec => rubydebug}
}
EOF# 配置多管道(让Logstash同时加载3个配置)
cp /etc/logstash/pipelines.yml /etc/logstash/pipelines.yml.bak
cat > /etc/logstash/pipelines.yml << EOF
- pipeline.id: mysql_logpath.config: "/etc/logstash/conf.d/mysql_log.conf"
- pipeline.id: nginx_logpath.config: "/etc/logstash/conf.d/nginx_log.conf"
- pipeline.id: java_logpath.config: "/etc/logstash/conf.d/java_log.conf"
EOF# 启动Logstash
systemctl start logstash
# 验证Logstash端口(6000/6001/6002均监听即成功)
netstat -antp | grep -E "6000|6001|6002" && echo "Logstash启动成功"
2.5.2 自动化脚本(elk_deploy.sh 续)
# 2. 安装配置Elasticsearch
echo "=== 安装配置Elasticsearch ==="
yum install -y java-1.8.0-openjdk java-1.8.0-openjdk-devel
java -versioncd /opt
rpm -ivh elasticsearch-6.6.1.rpm
systemctl daemon-reload && systemctl enable elasticsearch# 写入ES配置
cp /etc/elasticsearch/elasticsearch.yml /etc/elasticsearch/elasticsearch.yml.bak
cat > /etc/elasticsearch/elasticsearch.yml << EOF
cluster.name: yl-elk-cluster
node.name: node1
path.data: /data/elk_data
path.logs: /var/log/elasticsearch
bootstrap.memory_lock: false
network.host: 0.0.0.0
http.port: 9200
discovery.type: single-node
EOF# 创建数据目录并授权
mkdir -p /data/elk_data
chown -R elasticsearch:elasticsearch /data/elk_data/
chmod 755 /data/elk_data/# 启动ES并验证
systemctl start elasticsearch
sleep 40  # 等待ES初始化(视服务器性能调整时间)
if curl --output /dev/null --silent --head --fail http://172.16.0.13:9200; thenecho "Elasticsearch启动成功"
elseecho "Elasticsearch启动失败,检查日志:/var/log/elasticsearch/yl-elk-cluster.log"exit 1
fi# 3. 安装配置Logstash
echo "=== 安装配置Logstash ==="
cd /opt
rpm -ivh logstash-6.6.1.rpm
systemctl daemon-reload && systemctl enable logstash
ln -s /usr/share/logstash/bin/logstash /usr/local/bin/# 创建MySQL日志配置
cat > /etc/logstash/conf.d/mysql_log.conf << EOF
input {beats {port => 6000}
}
filter {date {match => ["timestamp", "yyyy-MM-dd HH:mm:ss"]target => "@timestamp"}
}
output {elasticsearch {hosts => ["http://172.16.0.13:9200"]index => "%{service_name}-%{+YYYY.MM.dd}"}stdout {codec => rubydebug}
}
EOF# 创建Nginx日志配置
cat > /etc/logstash/conf.d/nginx_log.conf << EOF
input {beats {port => 6001}
}
filter {grok {match => { "message" => "%{IPORHOST:client_ip} %{USER:ident} %{USER:auth} \[%{HTTPDATE:timestamp}\] \"%{WORD:method} %{URIPATHPARAM:request} HTTP/%{NUMBER:http_version}\" %{NUMBER:response} %{NUMBER:bytes} \"%{DATA:referrer}\" \"%{DATA:user_agent}\"" }}
}
output {elasticsearch {hosts => ["http://172.16.0.13:9200"]index => "%{service_name}-%{+YYYY.MM.dd}"}stdout {codec => rubydebug}
}
EOF# 创建Java日志配置
cat > /etc/logstash/conf.d/java_log.conf << EOF
input {beats {port => 6002}
}
filter {date {match => ["timestamp", "yyyy-MM-dd HH:mm:ss.SSS"]target => "@timestamp"}
}
output {elasticsearch {hosts => ["http://172.16.0.13:9200"]index => "%{service_name}-%{+YYYY.MM.dd}"}stdout {codec => rubydebug}
}
EOF# 配置多管道
cp /etc/logstash/pipelines.yml /etc/logstash/pipelines.yml.bak
cat > /etc/logstash/pipelines.yml << EOF
- pipeline.id: mysql_logpath.config: "/etc/logstash/conf.d/mysql_log.conf"
- pipeline.id: nginx_logpath.config: "/etc/logstash/conf.d/nginx_log.conf"
- pipeline.id: java_logpath.config: "/etc/logstash/conf.d/java_log.conf"
EOF# 启动Logstash并验证端口
systemctl start logstash
sleep 20  # 等待Logstash加载配置
if netstat -antp | grep -E "6000|6001|6002" > /dev/null; thenecho "Logstash启动成功,端口6000/6001/6002已监听"
elseecho "Logstash启动失败,检查日志:/var/log/logstash/logstash-plain.log"exit 1
fiecho "=== ELK节点部署完成 ==="
三、整体验证与测试
3.1 业务功能验证
-
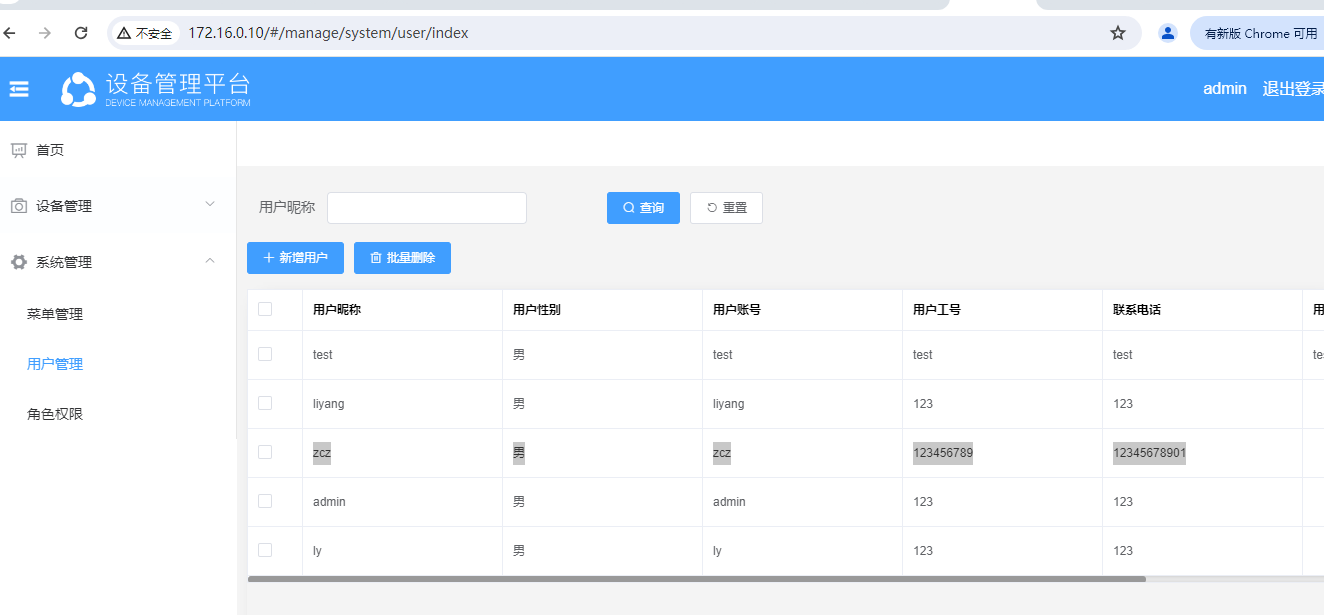
前端页面访问打开浏览器输入
http://172.16.0.10(Nginx 节点 IP),若能正常加载设备管理平台登录页,说明 Nginx 前端部署成功。 -
微服务连通性验证在 Java 节点执行以下命令,测试微服务是否正常响应:
# 假设微服务健康检查接口为/ylApp/actuator/health(需按实际接口调整) curl http://172.16.0.11:8090/ylApp/actuator/health # 若返回"status":"UP",说明微服务运行正常 -
数据库连接验证在 Java 节点测试 MySQL 连接(需安装 mysql-client):
yum install -y mysql mysql -h172.16.0.100 -uroot -p123456 -e "select count(*) from yl_app.sys_user;" # 若返回用户表数据行数,说明数据库连接正常 -
Redis 缓存验证在任意节点测试 Redis 连接:
yum install -y redis
redis-cli -h 172.16.0.12 ping
# 若返回"PONG",说明Redis服务正常
3.2 日志收集验证
3.2.1 生成测试日志
-
MySQL 节点生成测试日志
echo "=== MySQL Test Log $(date '+%Y-%m-%d %H:%M:%S') ===" >> /var/log/mysql/mysql_error.log echo "=== MySQL Slow Test Log $(date '+%Y-%m-%d %H:%M:%S') ===" >> /var/log/mysql/mysql_slow.log -
Nginx 节点生成测试日志
# 模拟前端访问请求 curl http://172.16.0.10 # 生成错误日志 echo "=== Nginx Error Test Log $(date '+%Y-%m-%d %H:%M:%S') ===" >> /usr/local/nginx/logs/error.log -
Java 节点生成测试日志
echo "=== Java Business Test Log $(date '+%Y-%m-%d %H:%M:%S') ===" >> /opt/logs/yulin-$(date +%Y-%m-%d).0.log
3.2.2 Kibana 查看日志
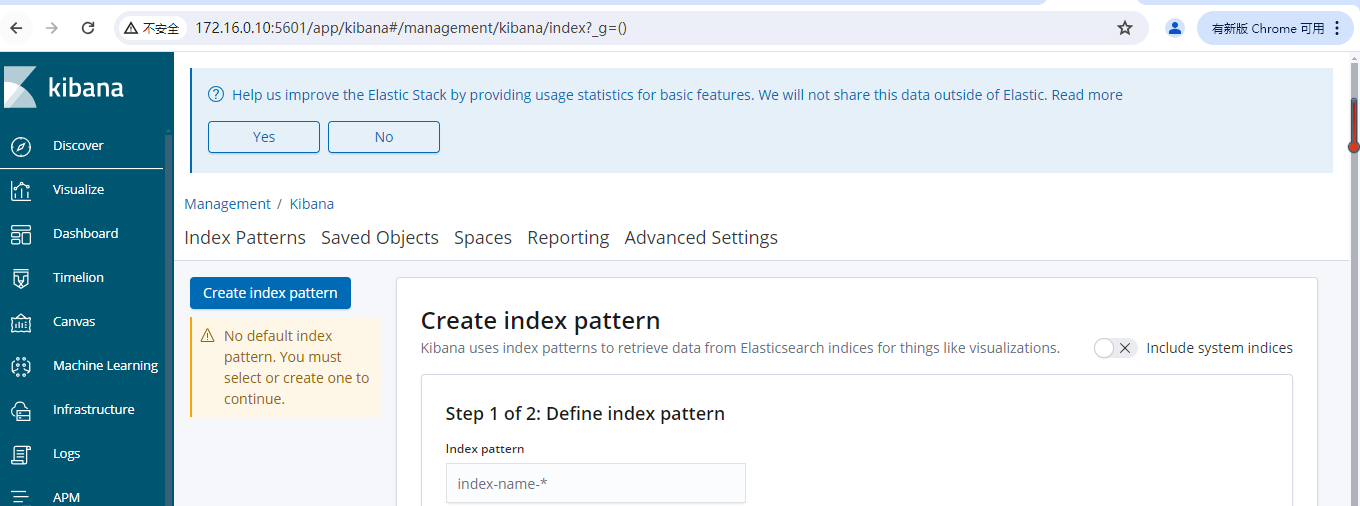
- 打开浏览器访问
http://172.16.0.10:5601(Nginx 节点 IP:5601),进入 Kibana 界面。 - 创建索引模式:
- 点击左侧菜单栏 Management → Index Patterns → Create index pattern。
- 输入索引匹配规则(如
mysql_error_log-*、nginx_access_log-*、yvlin_log-*),点击 Next step。 - 时间字段选择
@timestamp,点击 Create index pattern。
- 查看日志:
- 点击左侧菜单栏 Discover,在顶部索引模式下拉框选择对应索引(如
mysql_error_log-*)。 - 若能看到步骤 3.2.1 生成的测试日志,说明 ELK 日志收集链路正常。
- 点击左侧菜单栏 Discover,在顶部索引模式下拉框选择对应索引(如
四、常见问题排查
4.1 服务启动失败
| 服务 | 排查步骤 | |
|---|---|---|
| MySQL | 1. 查看日志:cat /var/log/mysqld.log2. 检查端口占用:`netstat -antp | grep 3306` |
| Elasticsearch | 1. 查看日志:cat /var/log/elasticsearch/yl-elk-cluster.log2. 检查内存:free -h(建议内存≥2G) | |
| Logstash | 1. 查看日志:cat /var/log/logstash/logstash-plain.log2. 验证配置语法:logstash -t -f /etc/logstash/conf.d/mysql_log.conf | |
| Filebeat | 1. 查看日志:cat /var/log/filebeat/filebeat2. 验证 Logstash 连接:filebeat test output -c /etc/filebeat/filebeat.yml |
4.2 日志收集不到
- 检查 Filebeat→Logstash 链路:
# 在Filebeat节点执行,验证连接 filebeat test output -c /etc/filebeat/filebeat.yml - 检查 Logstash→ES 链路:
# 在ELK节点执行,测试ES是否正常 curl http://172.16.0.13:9200/_cat/indices?v # 查看Logstash是否有数据输出 tail -f /var/log/logstash/logstash-plain.log | grep "stdout" - 检查 Kibana 索引模式:
- 确认索引模式匹配规则正确(如索引名是否为
service_name-YYYY.MM.dd格式)。 - 确认时间范围选择正确(如 “Last 15 minutes”)。
- 确认索引模式匹配规则正确(如索引名是否为
五、部署完成确认清单
| 节点 | 验证项 | 状态(√/×) |
|---|---|---|
| MySQL | 1. MySQL 服务启动2. yl_app 数据库导入完成3. Filebeat 运行正常 | |
| Redis | 1. Redis 服务启动2. 远程连接正常(redis-cli -h 172.16.0.12 ping) | |
| Java | 1. 微服务启动2. 日志文件生成3. Filebeat 运行正常 | |
| Nginx | 1. Nginx 服务启动2. 前端页面访问正常3. Kibana 访问正常4. Filebeat 运行正常 | |
| ELK | 1. ES 服务启动(curl 172.16.0.13:9200)2. Logstash 端口监听(6000/6001/6002)3. Kibana 日志查看正常 |
当所有验证项均为 “√” 时,设备管理平台部署完成,可正常投入使用。