基于Spring Boot与Micrometer的系统参数监控指南
如何为你的Spring Boot应用装上一个功能强大的监控仪表盘
在现代微服务架构中,系统监控已成为保障应用稳定性的关键环节。通过有效的监控,我们可以实时了解应用的运行状态,及时发现并解决性能问题。本文将介绍如何使用Micrometer及其注册表(Registry)在Spring Boot环境中实现全面系统参数监控。
1 Micrometer简介
Micrometer是一款供应商中立的应用程序指标门面(Facade),类似于SLF4J在日志领域的作用,它为不同监控系统提供了统一的度量采集API。它可以与多种监控系统(如Prometheus、Datadog、New Relic、InfluxDB等)无缝集成,让你无需修改代码即可切换监控后端。
Micrometer的架构围绕三个核心概念构建:
Meter:表示具体的度量指标,如计数器(Counter)、计时器(Timer)等
MeterRegistry:负责创建和存储Meter的核心接口
Binder:将框架内部指标(如JVM指标)自动绑定到注册表
2 Spring Boot集成Micrometer
2.1 添加依赖
首先,在您的pom.xml中添加以下依赖:
<dependency><groupId>org.springframework.boot</groupId><artifactId>spring-boot-starter-actuator</artifactId>
</dependency>
<dependency><groupId>io.micrometer</groupId><artifactId>micrometer-core</artifactId>
</dependency>
<!-- 使用Prometheus作为监控系统 -->
<dependency><groupId>io.micrometer</groupId><artifactId>micrometer-registry-prometheus</artifactId>
</dependency>如果使用Gradle,可以在build.gradle中添加:
implementation 'org.springframework.boot:spring-boot-starter-actuator'
implementation 'io.micrometer:micrometer-core'
implementation 'io.micrometer:micrometer-registry-prometheus'
2.2 配置监控端点
在application.yml或application.properties中进行配置:
management:endpoints:web:exposure:include: health,info,metrics,prometheusmetrics:tags:application: ${spring.application.name}region: northexport:prometheus:enabled: true此配置开启了Actuator的监控端点,并设置了全局标签(application和region),这些标签会附加到所有监控指标上
2.3 选择监控系统
Micrometer支持多种监控系统,以下是常见选择:
| 监控系统 | 适用场景 | 特点 |
|---|---|---|
| Prometheus | 时间序列监控 | 开源、拉取模式、适合Kubernetes环境 |
| InfluxDB | 处理大量时间序列数据 | 高性能、支持类SQL查询 |
| Datadog | 全栈可观测性 | 商业化、功能全面、支持多种数据源 |
| StatsD | 简单指标收集 | 轻量级、推送模式、易于部署 |
3 使用MeterRegistry记录指标
Spring Boot会自动配置一个MeterRegistry实例,可以直接在代码中使用它来记录各种指标。
3.1 计数器(Counter)
计数器用于记录单调递增的指标,如请求总数、订单创建数量等。
import io.micrometer.core.instrument.Counter;
import io.micrometer.core.instrument.MeterRegistry;
import org.springframework.stereotype.Service;@Service
public class OrderService {private final Counter orderCounter;public OrderService(MeterRegistry meterRegistry) {this.orderCounter = meterRegistry.counter("orders.total", "type", "created");}public void createOrder() {// 业务逻辑orderCounter.increment();}
}
3.2 计量仪(Gauge)
Gauge用于测量瞬时值,如内存使用量、缓存大小等。
import io.micrometer.core.instrument.Gauge;
import io.micrometer.core.instrument.MeterRegistry;
import org.springframework.stereotype.Component;import javax.annotation.PostConstruct;
import java.util.concurrent.atomic.AtomicInteger;@Component
public class MyGaugeComponent {private AtomicInteger myValue = new AtomicInteger(0);private final MeterRegistry meterRegistry;public MyGaugeComponent(MeterRegistry meterRegistry) {this.meterRegistry = meterRegistry;}@PostConstructpublic void init() {Gauge.builder("my_custom_gauge", myValue, AtomicInteger::get).description("A custom gauge example").tags("component", "gauge").register(meterRegistry);}public void updateValue(int newValue) {myValue.set(newValue);}@Beanpublic CommandLineRunner bindThreadPoolToMetrics(MeterRegistry registry,@Qualifier("asyncExecutorService") ThreadPoolTaskExecutor executor,SystemStatusService systemStatusService) {Gauge.builder("system.status.code", systemStatusService::getStatusCode).description("当前系统状态码").register(registry);return args -> {registry.gauge("asyncExecutorService.threadpool.core.size", executor, ThreadPoolTaskExecutor::getCorePoolSize);registry.gauge("asyncExecutorService.threadpool.max.size", executor, ThreadPoolTaskExecutor::getMaxPoolSize);registry.gauge("asyncExecutorService.threadpool.pool.size", executor, ThreadPoolTaskExecutor::getPoolSize);registry.gauge("asyncExecutorService.threadpool.active.count", executor, ThreadPoolTaskExecutor::getActiveCount);registry.gauge("asyncExecutorService.threadpool.queue.size", executor,new ToDoubleFunction<ThreadPoolTaskExecutor>() {@Overridepublic double applyAsDouble(ThreadPoolTaskExecutor value) {return value.getThreadPoolExecutor().getQueue().size();}});//registry.gauge("system.status.code", systemStatusService, SystemStatusService::getStatusCode);};}@Bean(name = "threadPoolTaskScheduler")public ThreadPoolTaskScheduler threadPoolTaskScheduler() {ThreadPoolTaskScheduler executor = new ThreadPoolTaskScheduler();executor.setPoolSize(2);executor.setThreadNamePrefix("TST-SCHEDULER");executor.setWaitForTasksToCompleteOnShutdown(true);executor.setAwaitTerminationSeconds(10);return executor;}
}
3.3 计时器(Timer)
计时器用于测量短时任务的持续时间,内置百分位计算。
import io.micrometer.core.instrument.Timer;
import io.micrometer.core.instrument.MeterRegistry;
import org.springframework.stereotype.Service;@Service
public class ApiService {private final Timer apiTimer;public ApiService(MeterRegistry meterRegistry) {this.apiTimer = meterRegistry.timer("api.requests", "api_type", "external");}public String callExternalApi() {return apiTimer.record(() -> {// 模拟API调用try {Thread.sleep(100);} catch (InterruptedException e) {Thread.currentThread().interrupt();}return "API response";});}
}
3.4 分布摘要(DistributionSummary)
分布摘要用于记录值的分布情况,适用于不涉及时间的测量,如响应体大小。
import io.micrometer.core.instrument.DistributionSummary;
import io.micrometer.core.instrument.MeterRegistry;
import org.springframework.stereotype.Service;@Service
public class ResponseService {private final DistributionSummary responseSizeSummary;public ResponseService(MeterRegistry meterRegistry) {this.responseSizeSummary = DistributionSummary.builder("response.size").description("Response size distribution").baseUnit("bytes").register(meterRegistry);}public void processResponse(String response) {// 记录响应大小responseSizeSummary.record(response.getBytes().length);}
}
4 监控HTTP请求
Spring Boot会自动监控HTTP请求,并提供一些默认的Metrics,如请求数量、响应时间等。您可以通过以下配置自定义这些指标:
management:metrics:web:server:request:autotime:enabled: truemetric:name: http.server.requests还可以通过自定义过滤器来增强HTTP监控:
import io.micrometer.core.instrument.MeterRegistry;
import org.springframework.stereotype.Component;
import org.springframework.web.filter.OncePerRequestFilter;import javax.servlet.FilterChain;
import javax.servlet.ServletException;
import javax.servlet.http.HttpServletRequest;
import javax.servlet.http.HttpServletResponse;
import java.io.IOException;@Component
public class MetricFilter extends OncePerRequestFilter {private final MeterRegistry meterRegistry;public MetricFilter(MeterRegistry meterRegistry) {this.meterRegistry = meterRegistry;}@Overrideprotected void doFilterInternal(HttpServletRequest request, HttpServletResponse response, FilterChain filterChain) throws ServletException, IOException {String path = request.getRequestURI();String method = request.getMethod();meterRegistry.counter("http.requests.total", "method", method, "path", path).increment();long start = System.currentTimeMillis();try {filterChain.doFilter(request, response);} finally {long duration = System.currentTimeMillis() - start;meterRegistry.timer("http.requests.duration","method", method,"path", path,"status", String.valueOf(response.getStatus())).record(duration, TimeUnit.MILLISECONDS);}}
}
5 自定义MeterFilter
MeterFilter允许您修改或过滤Metrics。例如,可以重命名Metrics,或删除一些不必要的Metrics。
import io.micrometer.core.instrument.Meter;
import io.micrometer.core.instrument.config.MeterFilter;
import io.micrometer.core.instrument.config.MeterFilterReply;
import org.springframework.context.annotation.Bean;
import org.springframework.context.annotation.Configuration;@Configuration
public class MicrometerConfig {@Beanpublic MeterFilter renameFilter() {return MeterFilter.renameTag("http.server.requests", "method", "http_method");}@Beanpublic MeterFilter ignoreTagFilter() {return MeterFilter.ignoreTag("uri");}@Beanpublic MeterFilter denyFilter() {return MeterFilter.deny(id -> {String meterName = id.getName();// 拒绝以"temp"开头的指标return meterName != null && meterName.startsWith("temp");});}
}
6 查看监控数据
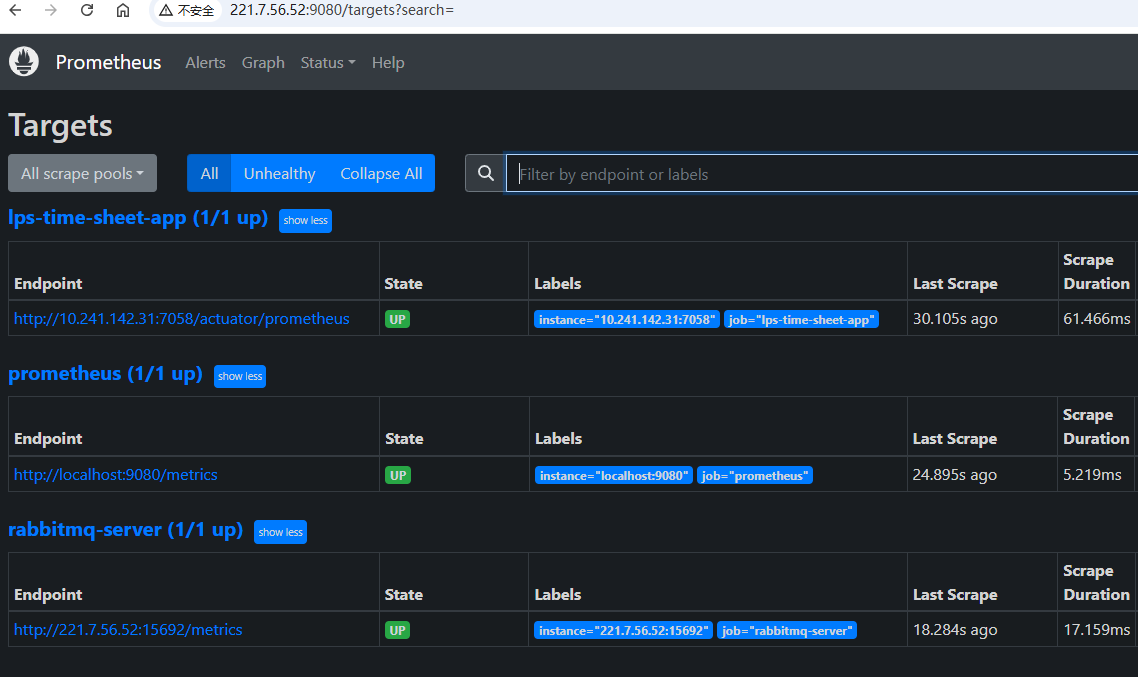
启动Spring Boot应用后,您可以访问/actuator/prometheus端点查看Prometheus格式的监控数据。
示例输出:
# HELP jvm_memory_used_bytes The amount of used memory
# TYPE jvm_memory_used_bytes gauge
jvm_memory_used_bytes{application="my-app",area="heap",id="Eden Space",} 1.2632928E7
7 常见问题与解决方案
Metric名称冲突
如果应用中使用了多个库,它们都使用了相同的Metric名称,可能会导致冲突。解决这个问题的方法是使用不同的标签来区分这些Metrics。性能问题
如果应用需要记录大量的Metrics,可能会导致性能问题。解决这个问题的方法是减少Metrics的数量,或者使用更高效的监控系统。数据丢失
如果监控系统出现故障,可能会导致数据丢失。解决这个问题的方法是使用高可用的监控系统,并定期备份数据。指标基数爆炸
避免使用高基数的标签(如用户ID),这会导致指标数量急剧增加,影响监控系统性能。
8 最佳实践
标签设计:使用有限且一致的标签值集合,避免高基数标签。
命名规范:使用"."分隔小写单词字符,Micrometer会自动转换为各监控系统适应的格式。
监控策略:只监控关键指标,避免过度监控导致系统负载过重。
异常处理:确保指标记录不会影响主要业务逻辑,妥善处理异常。
文档化:为自定义指标提供清晰的文档说明,包括指标名称、标签含义和预期值范围。
9 总结
通过Spring Boot集成Micrometer,我们可以为应用快速添加一个功能强大的"监控仪表盘",实时了解应用的各项指标,如CPU使用率、内存占用、请求响应时间等。Micrometer作为监控门面,让我们能够灵活选择监控后端,而无需修改代码。
关键要点:
Micrometer提供与供应商无关的监控指标接口
Spring Boot自动配置简化了集成过程
合理使用标签和命名规范避免常见问题
结合Grafana等可视化工具可以更好地展示监控数据
通过本文介绍的方法,我们可以快速为Spring Boot应用添加监控功能,及时发现并解决性能问题,确保应用的稳定性和可靠性。
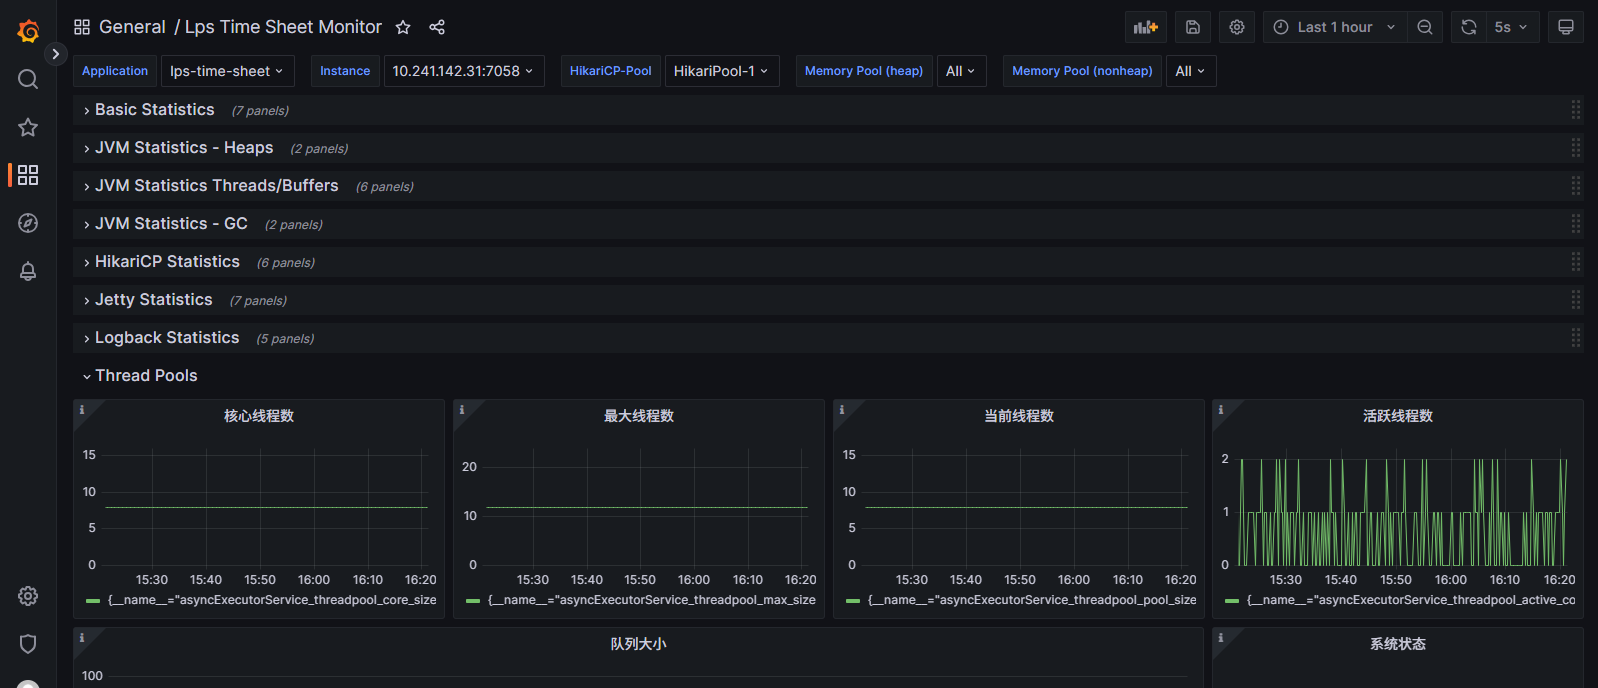
彩蛋
监控参数使用prometheus+grafana展示出来,如下图所示: