Grafana与Prometheus实战
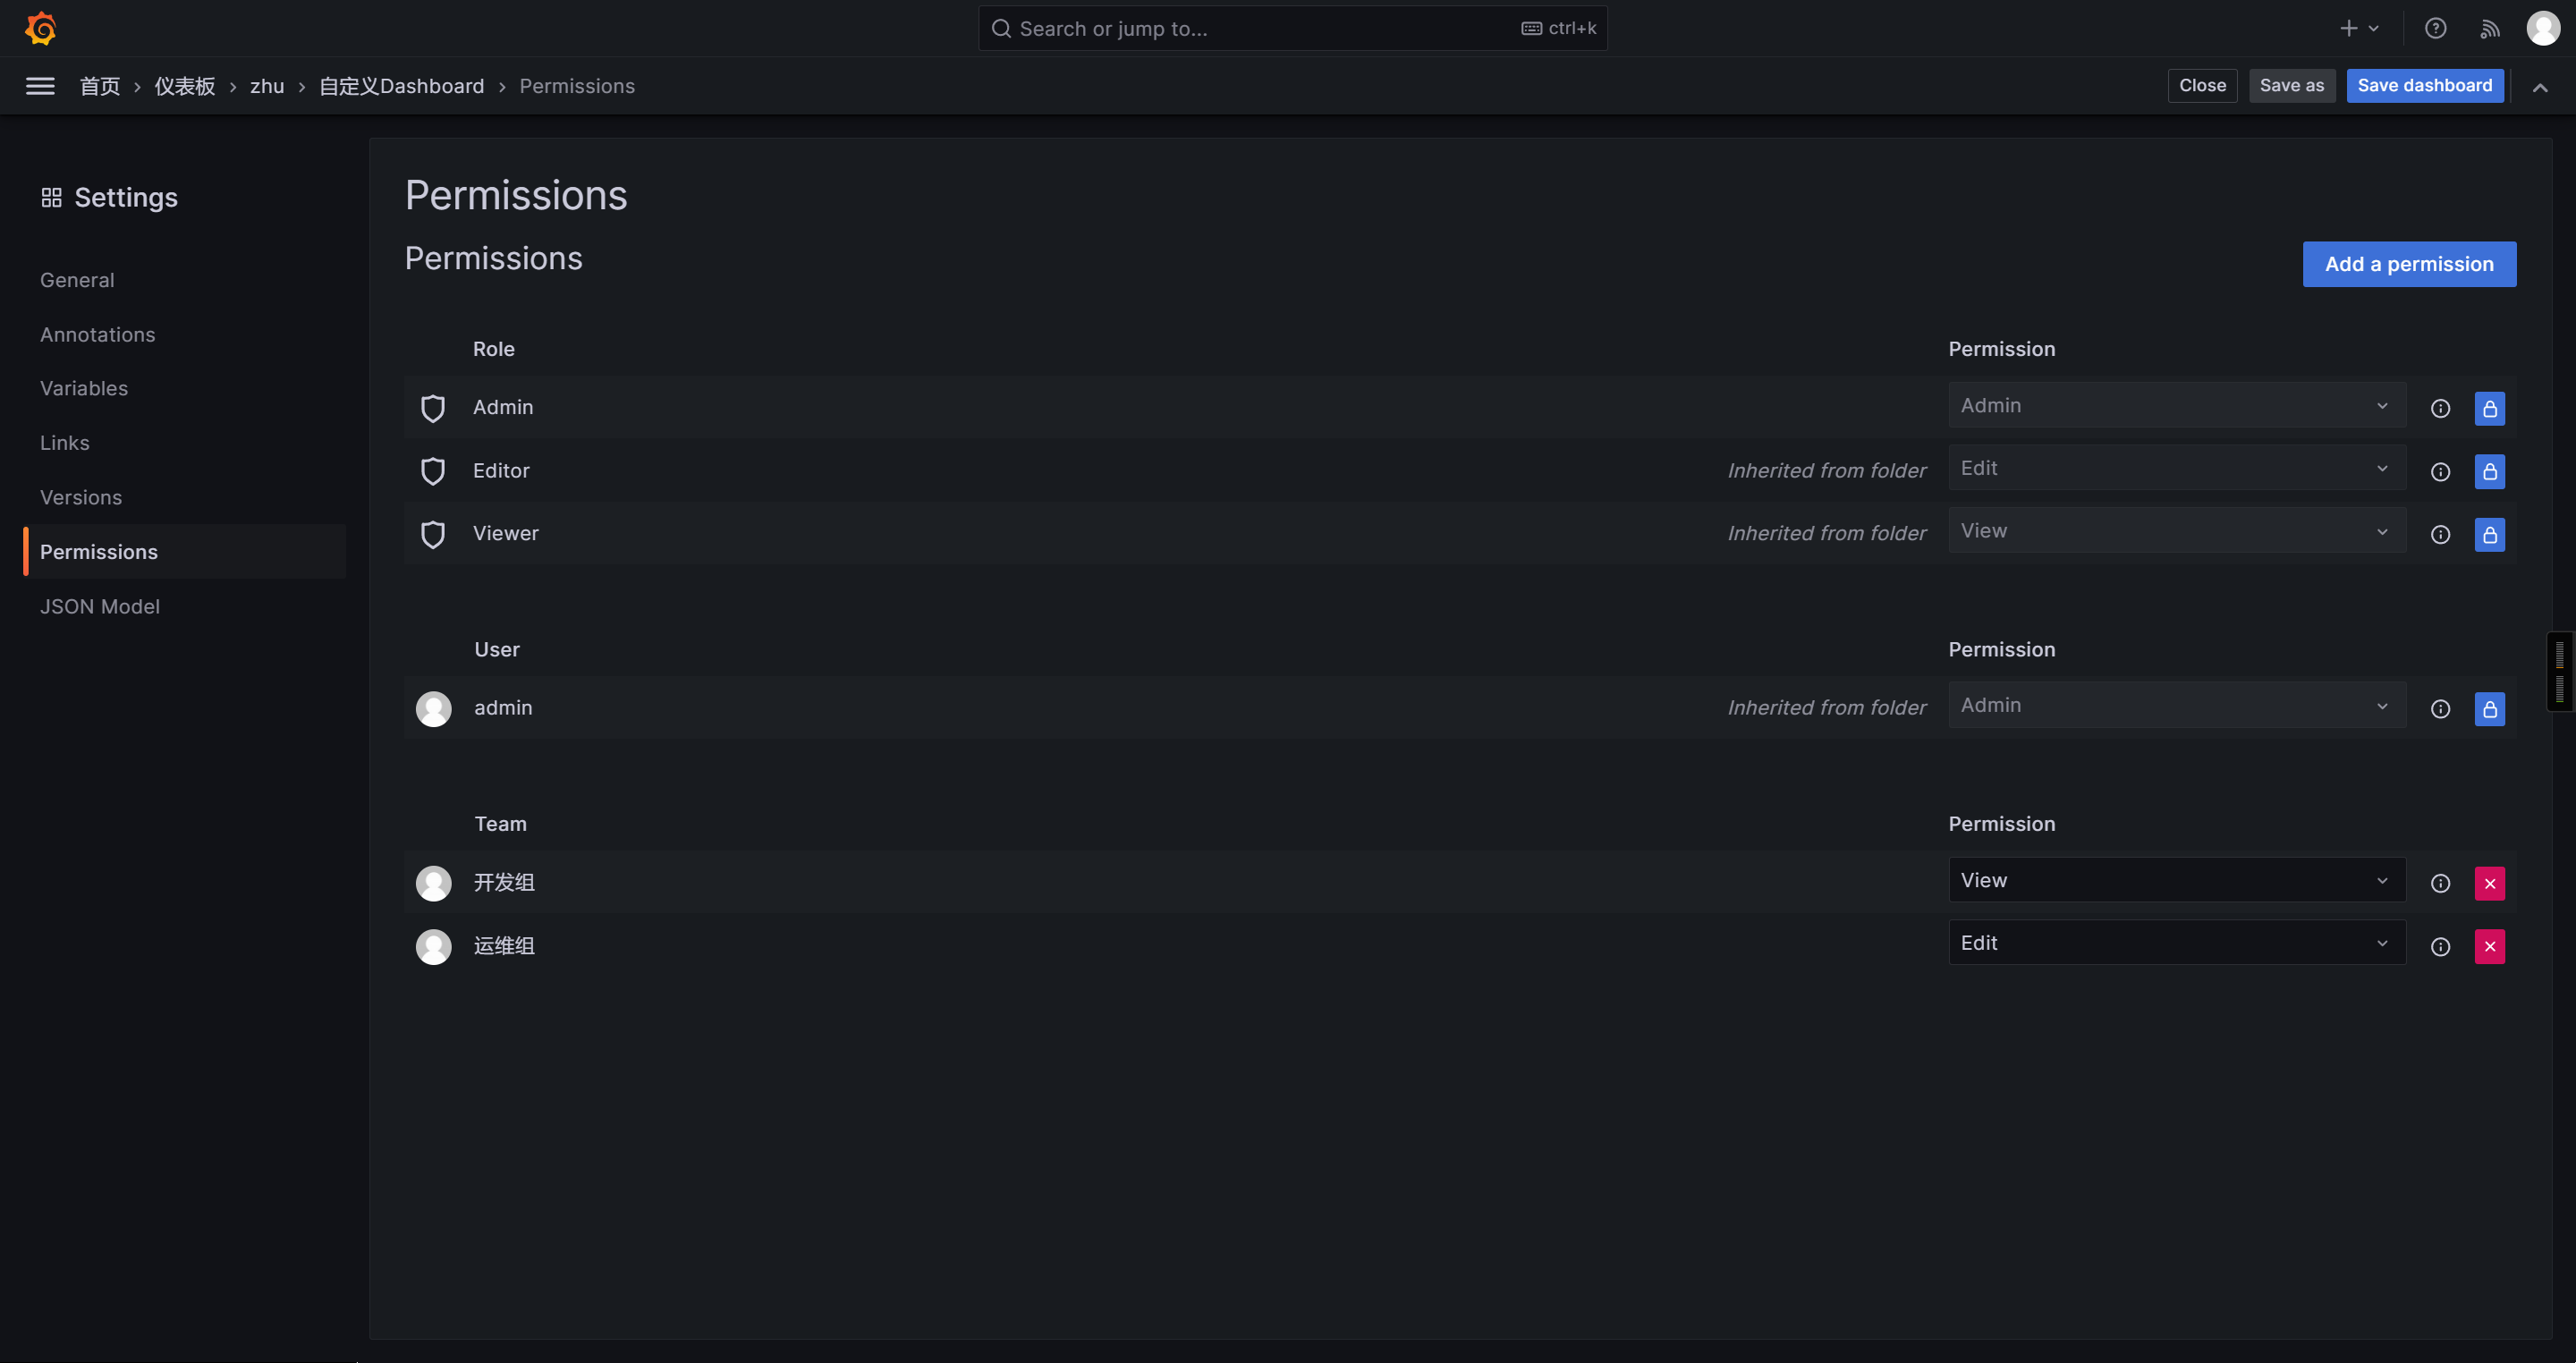
🌟Grafana的Dashboard的权限管理
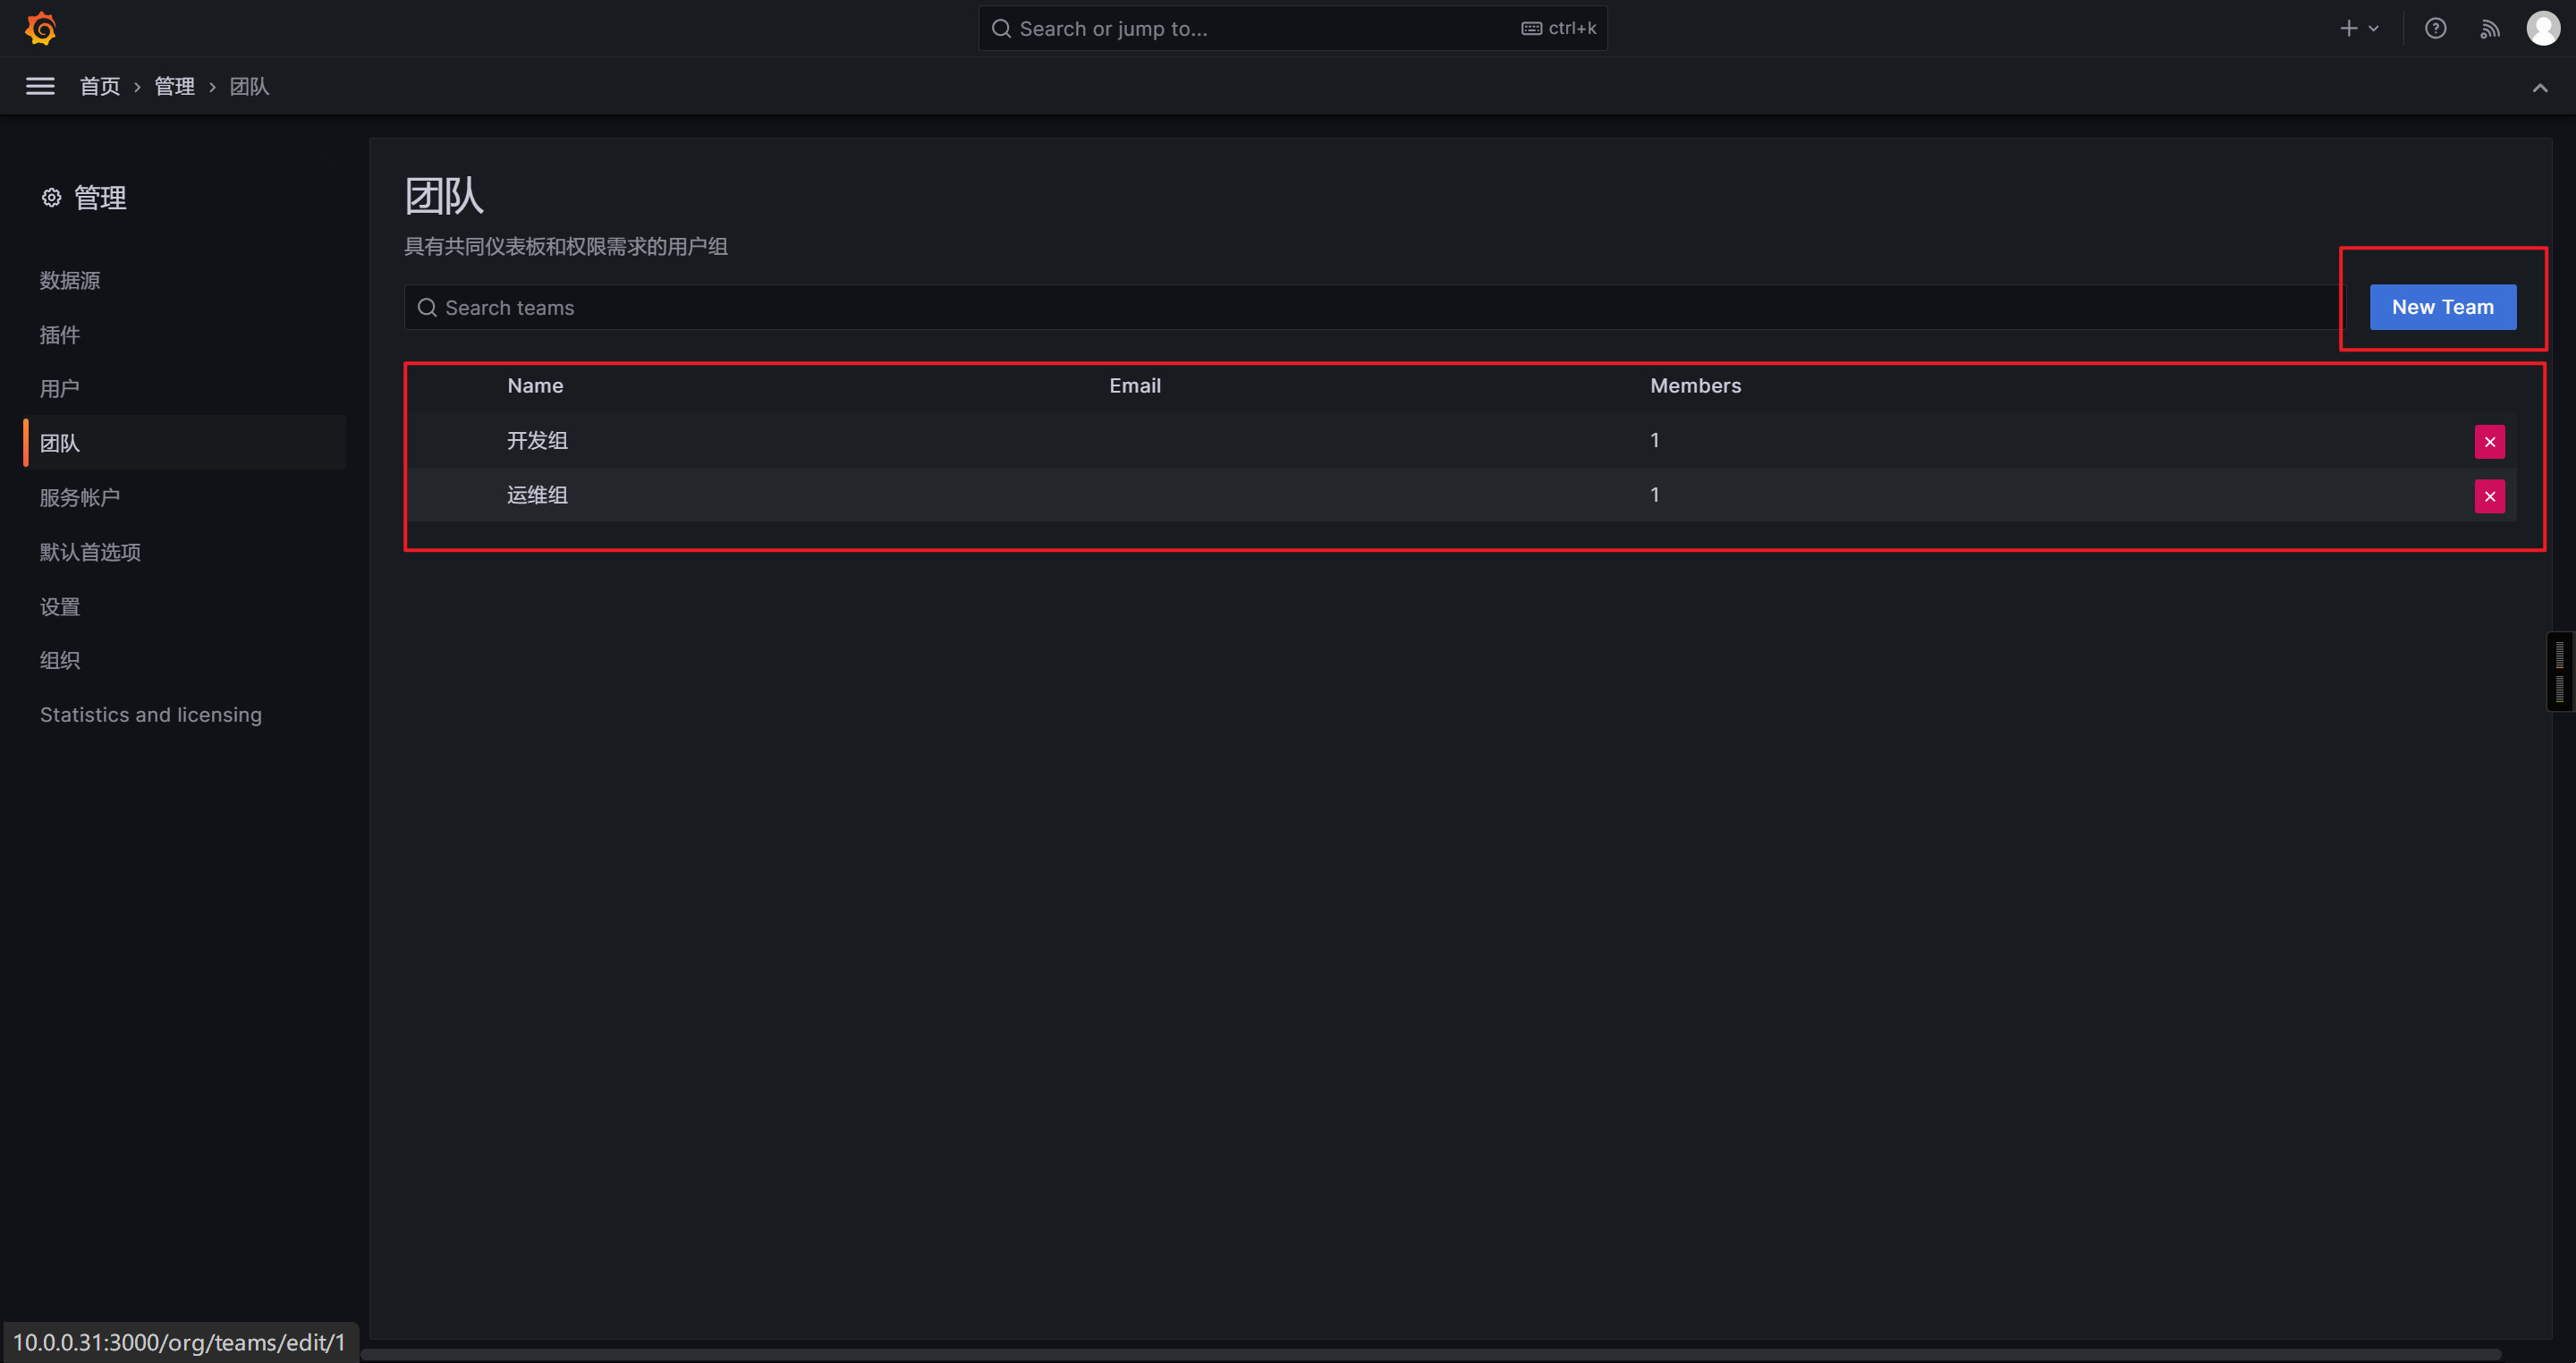
创建团队
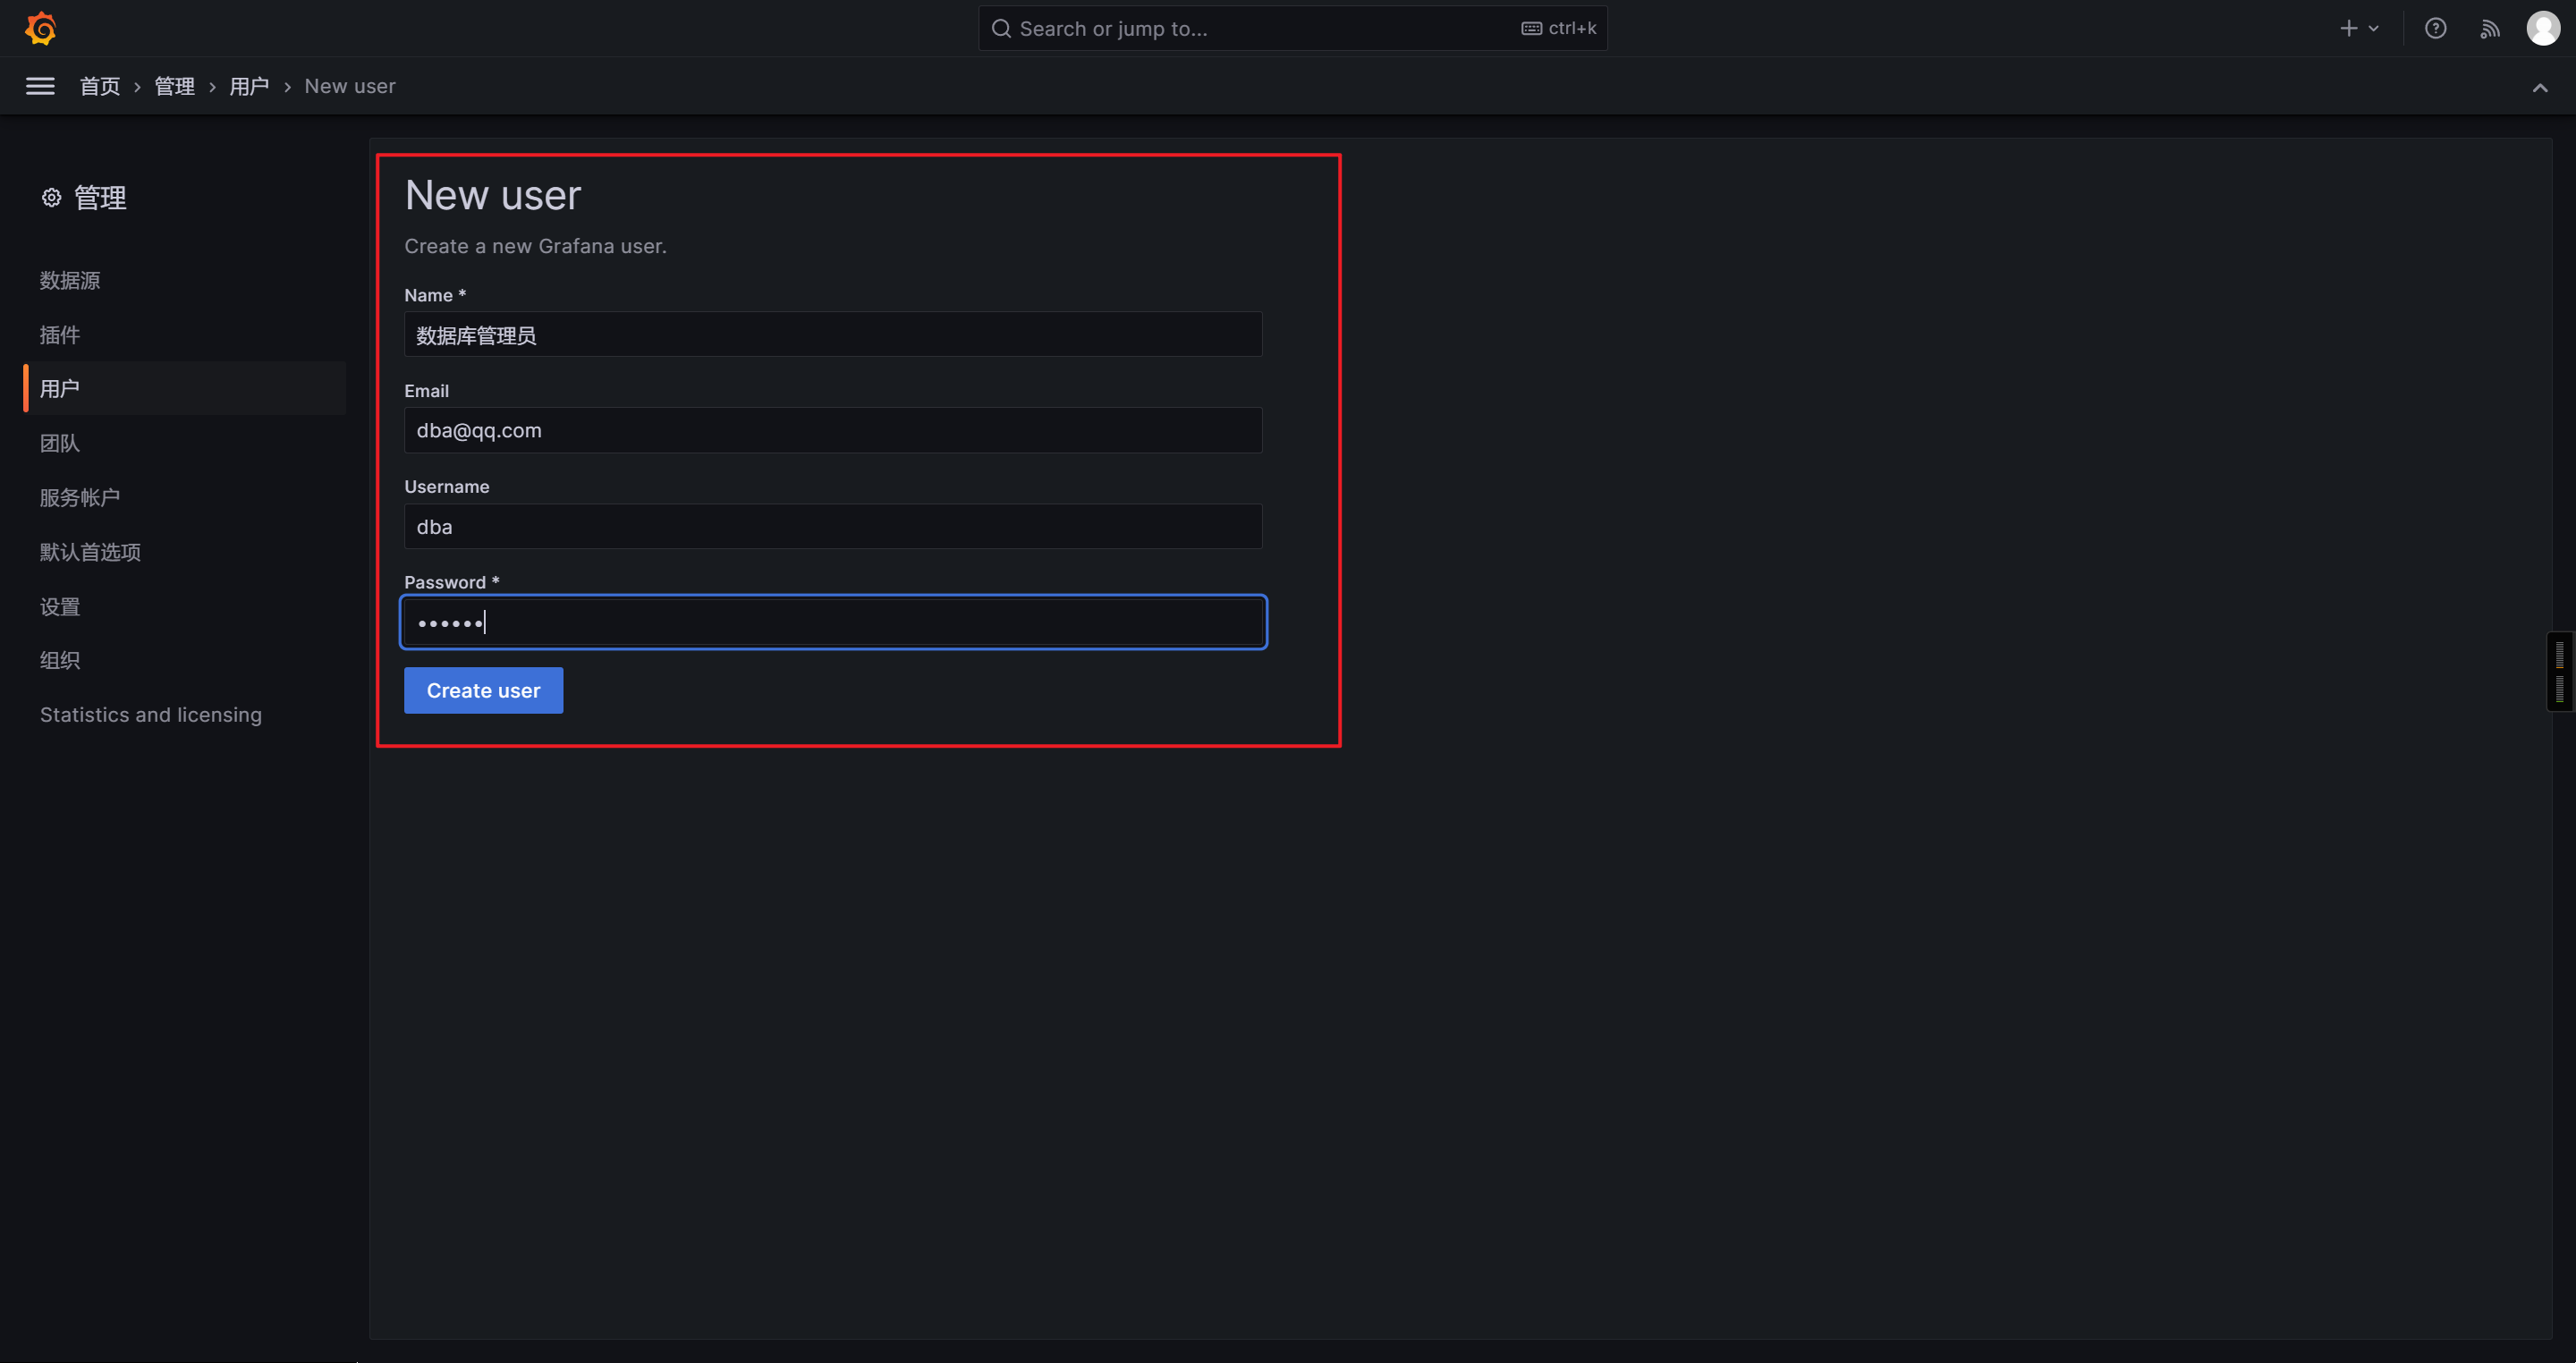
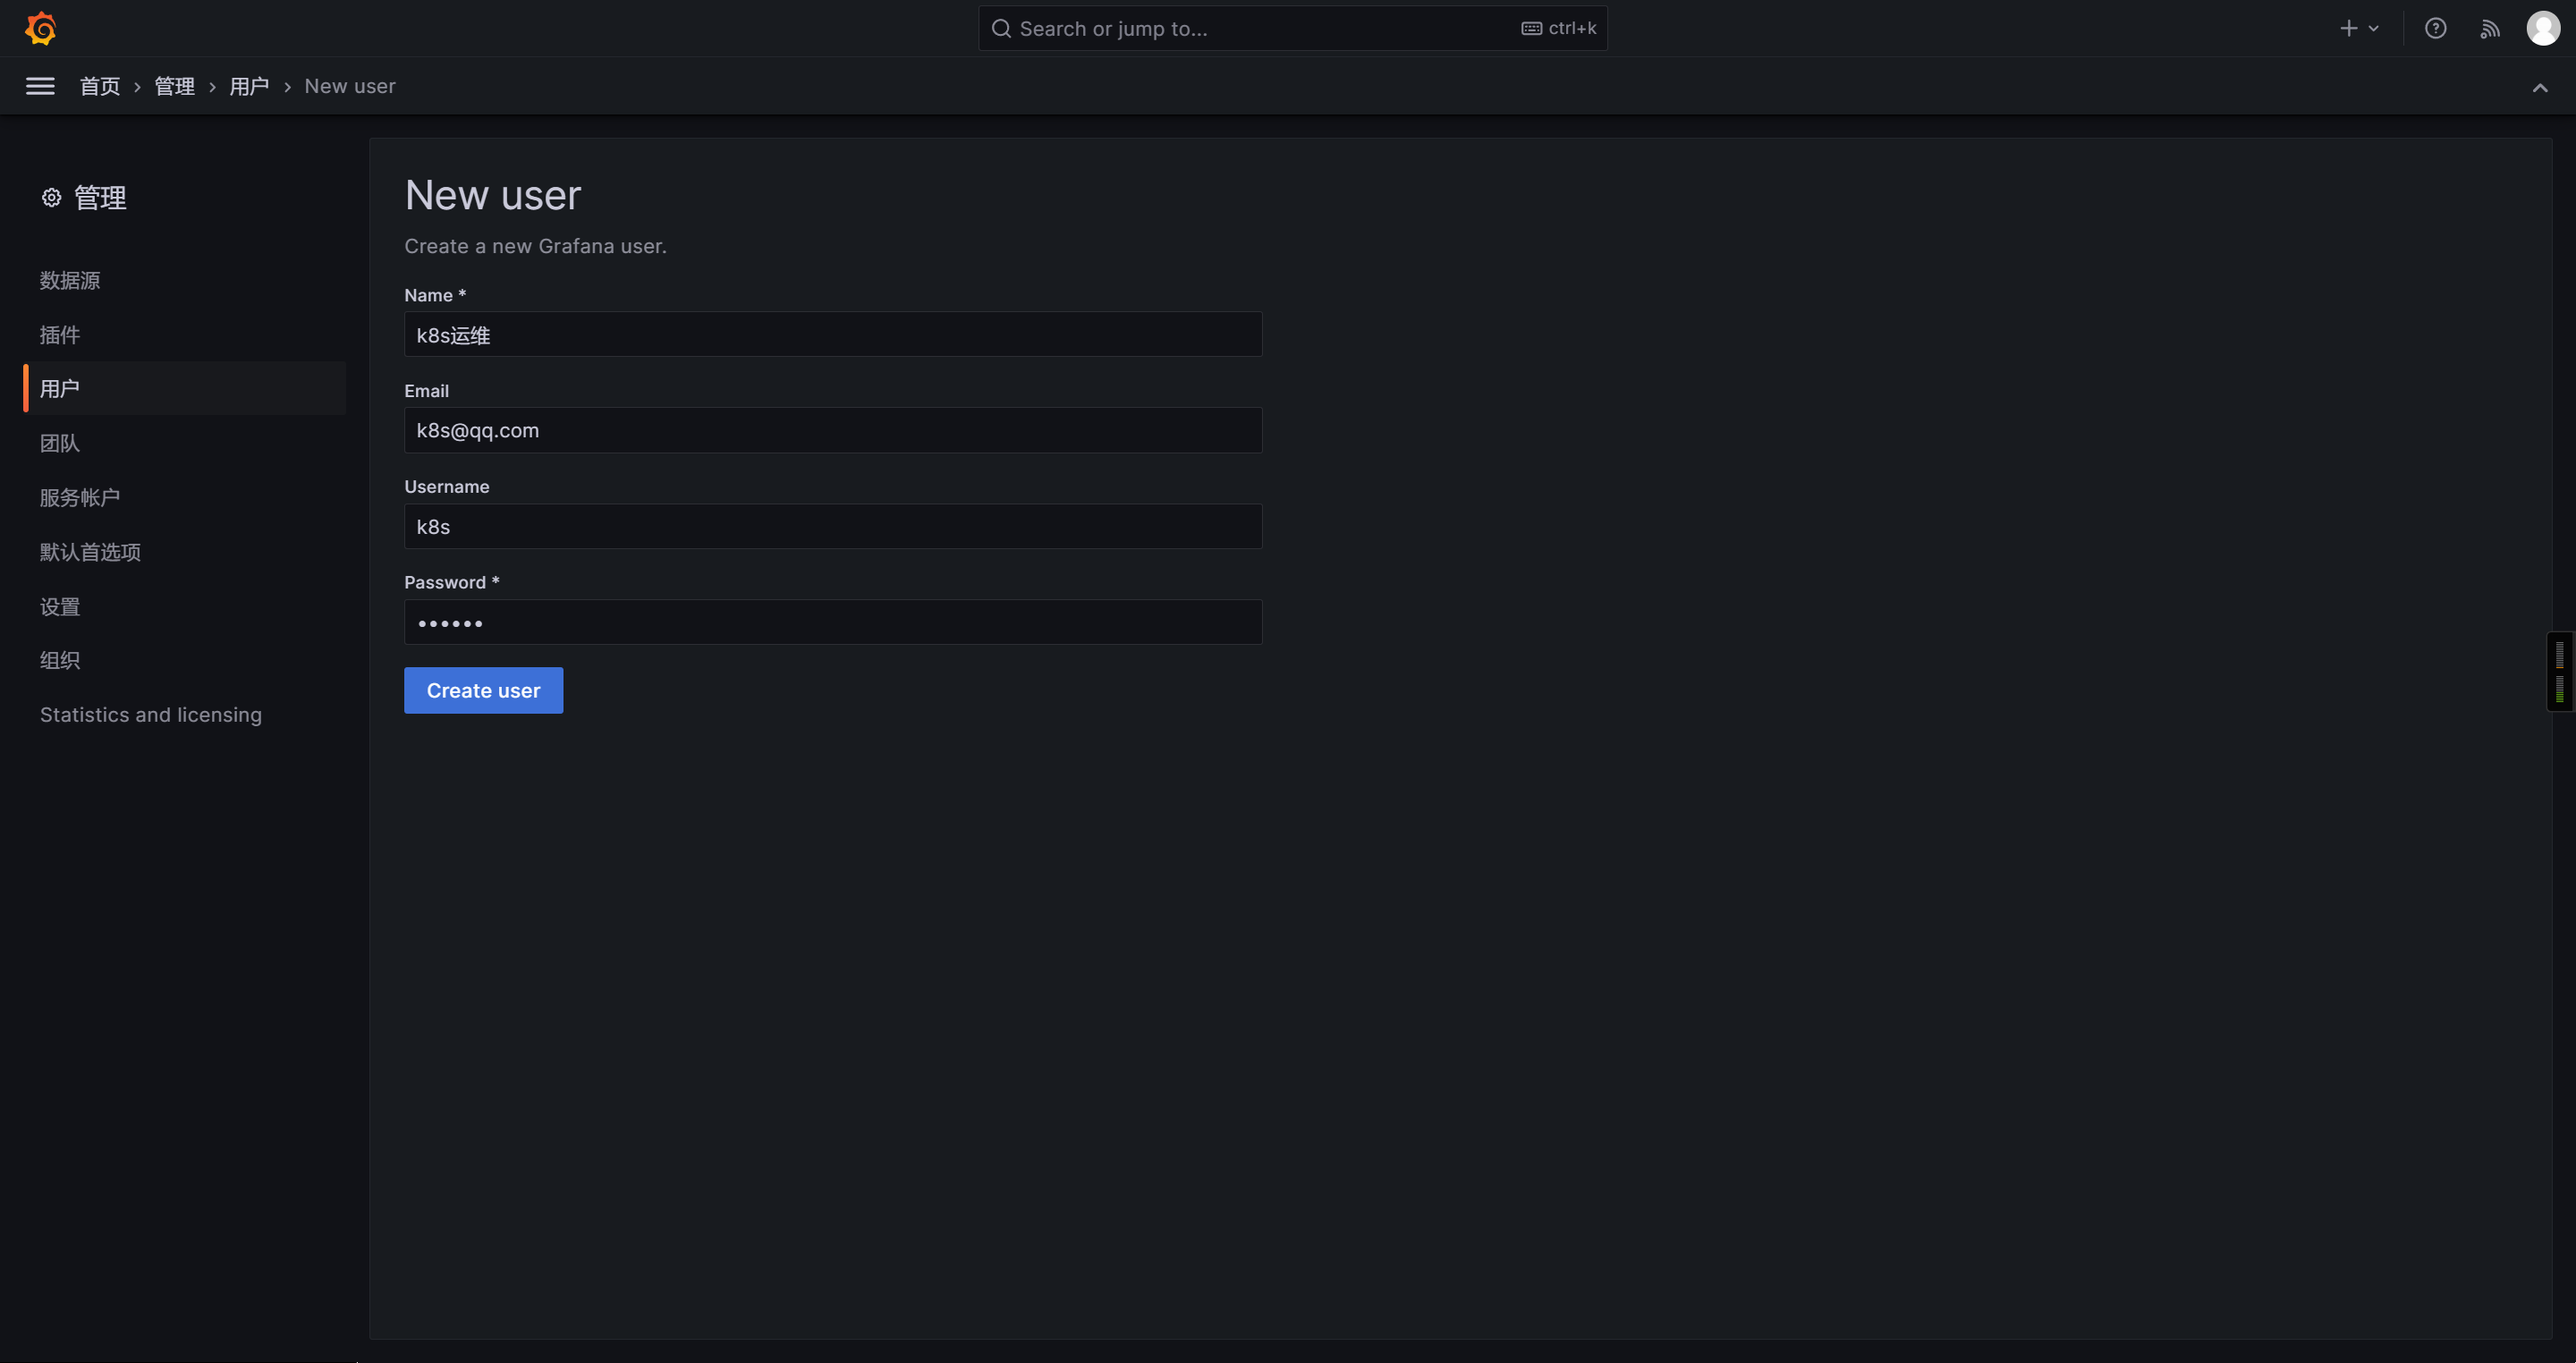
创建用户
设置团队权限
🌟Prometheus启用https及认证功能
自建ca的证书
准备证书目录
mkdir /app/tools/prometheus-2.53.4.linux-amd64/certs
cd /app/tools/prometheus-2.53.4.linux-amd64/certs

生成ca的私钥
openssl genrsa -out ca.key 4096

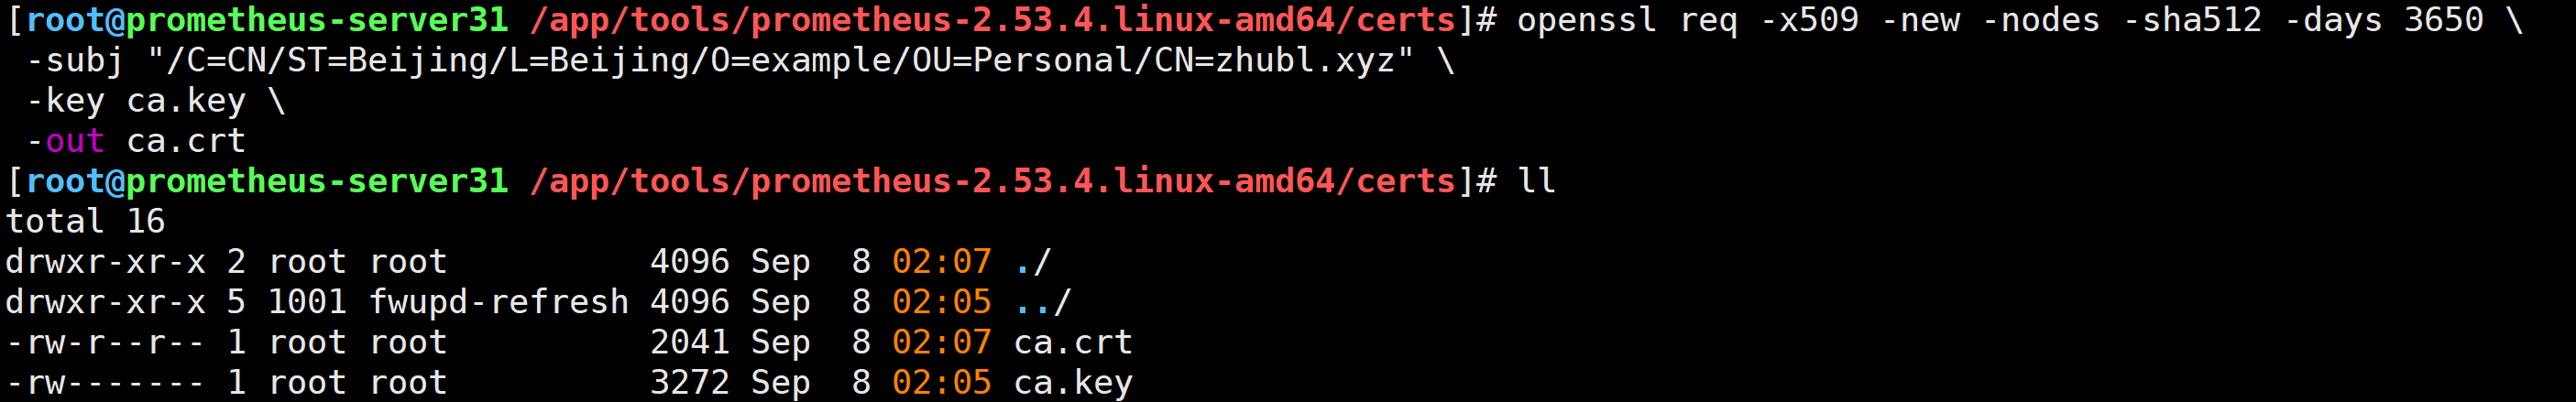
生成ca的自签名证书
openssl req -x509 -new -nodes -sha512 -days 3650 \-subj "/C=CN/ST=Beijing/L=Beijing/O=example/OU=Personal/CN=zhubl.xyz" \-key ca.key \-out ca.crt
基于自建CA证书生成Prometheus服务端证书
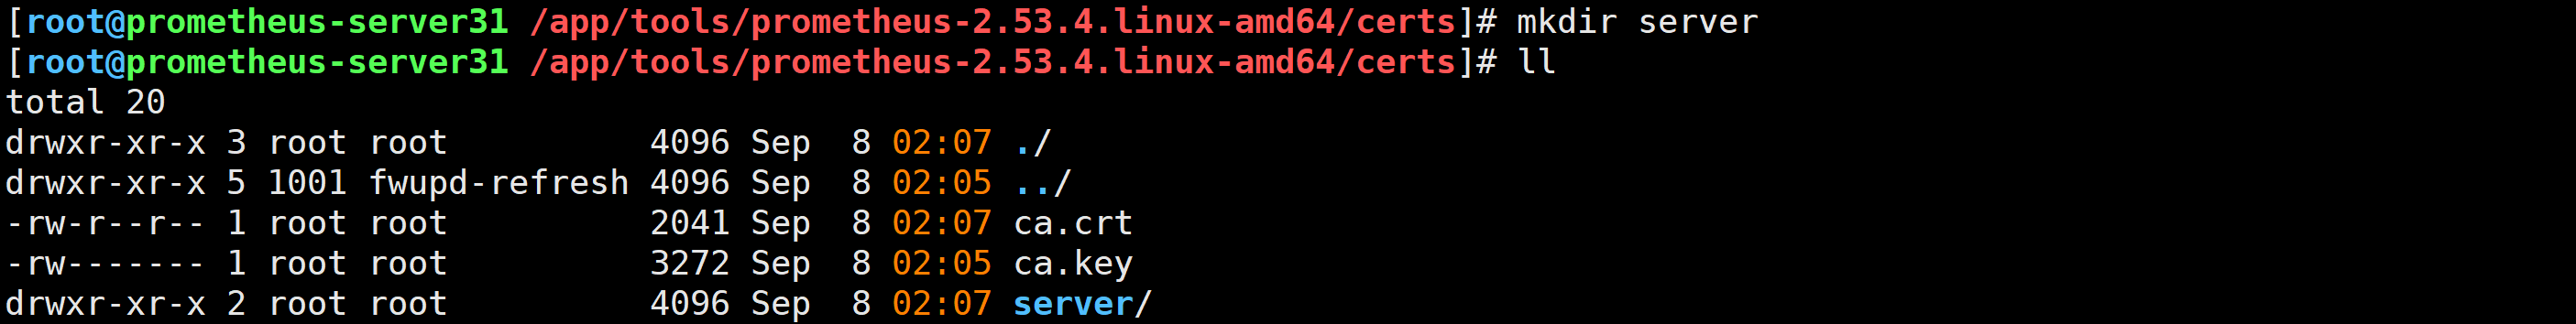
准备证书存放目录
mkdir server
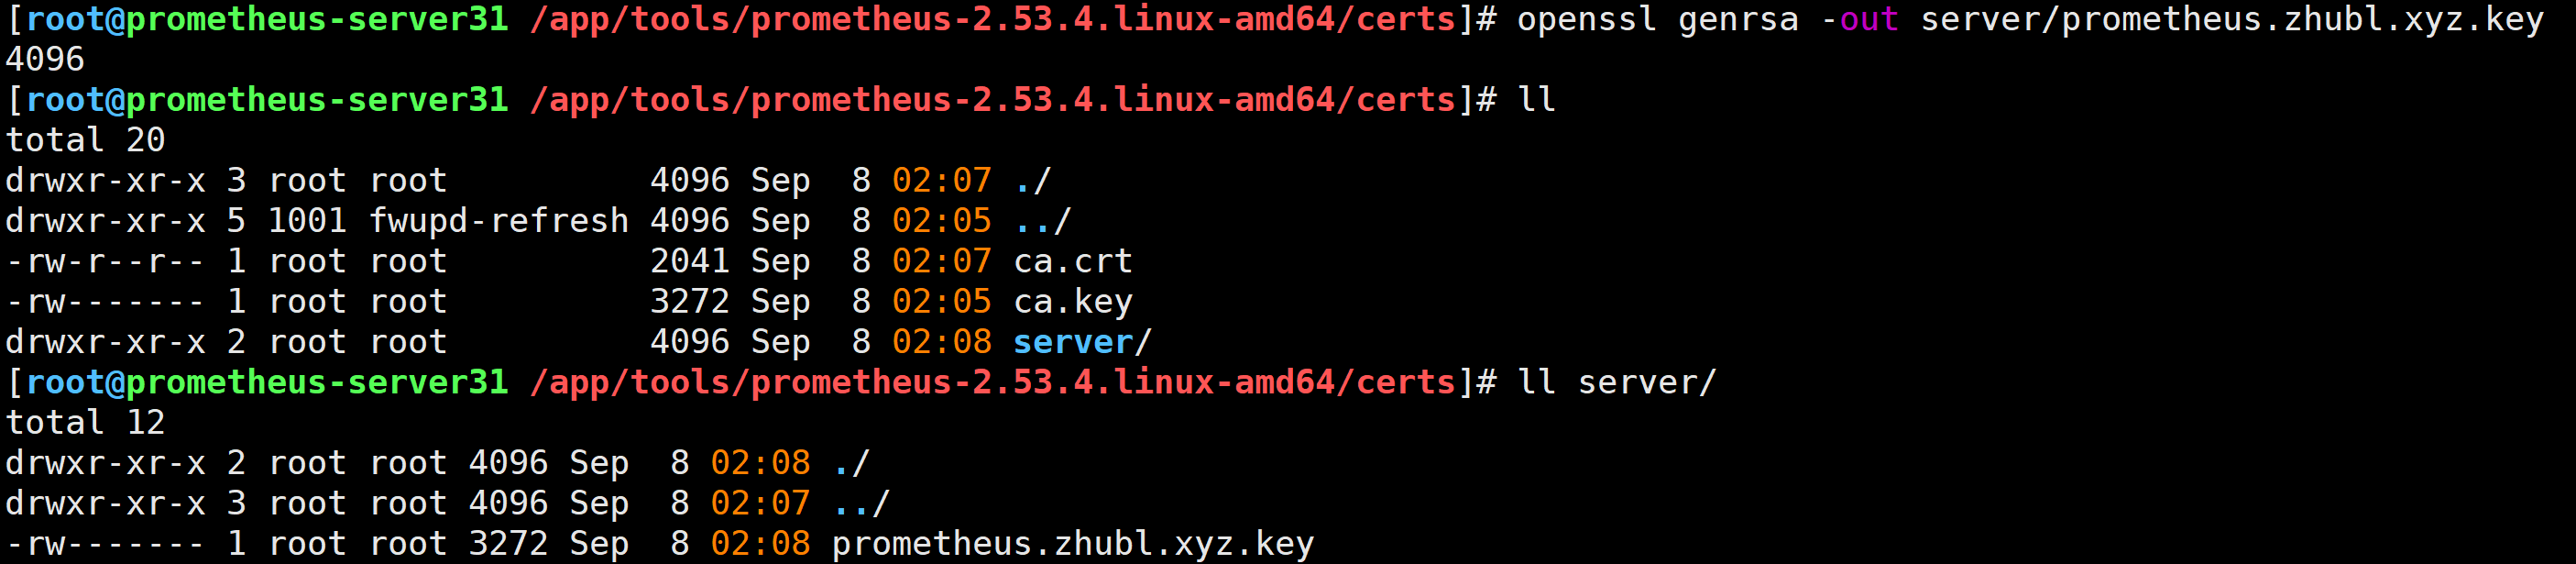
生成prometheus主机的私钥
openssl genrsa -out server/prometheus.zhubl.xyz.key 4096
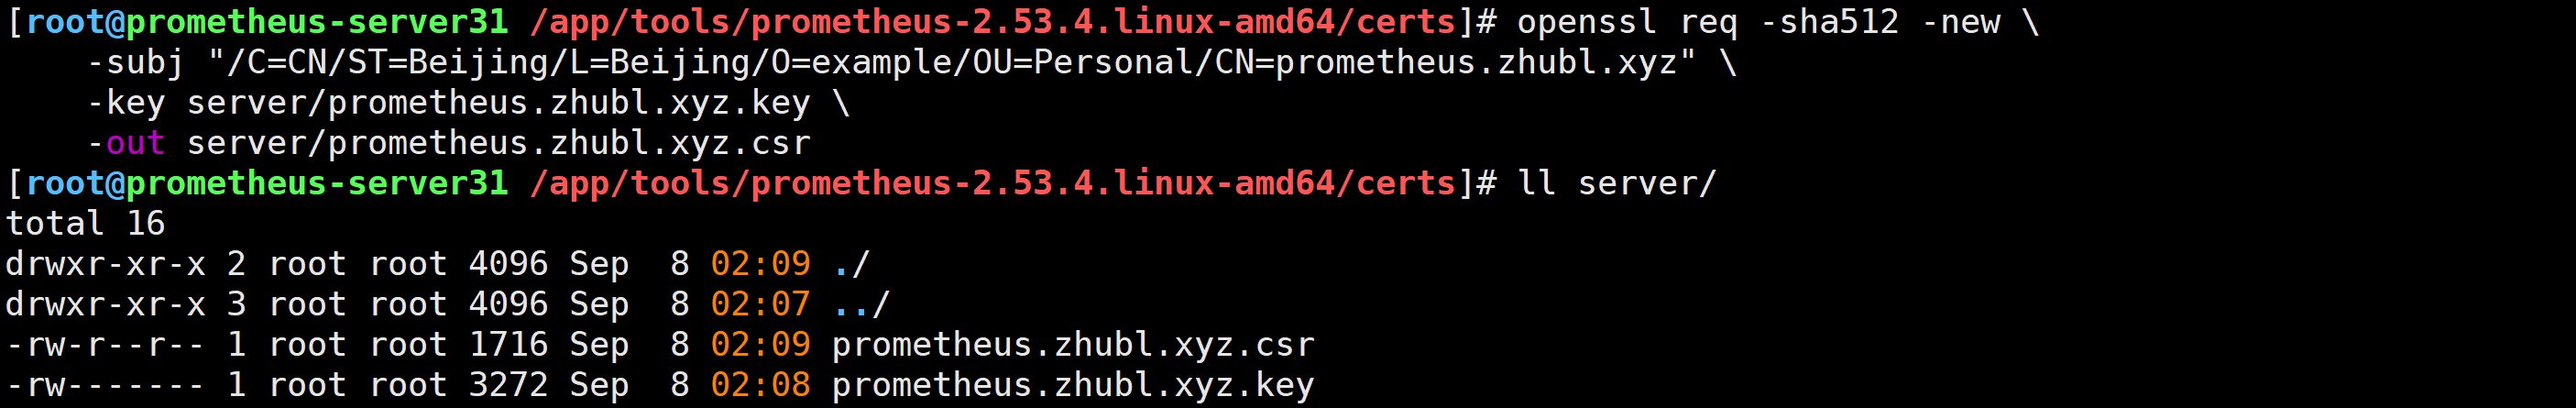
生成prometheus主机的证书申请
openssl req -sha512 -new \-subj "/C=CN/ST=Beijing/L=Beijing/O=example/OU=Personal/CN=prometheus.zhubl.xyz" \-key server/prometheus.zhubl.xyz.key \-out server/prometheus.zhubl.xyz.csr
生成x509 v3扩展文件
cat > v3.ext <<-EOF
authorityKeyIdentifier=keyid,issuer
basicConstraints=CA:FALSE
keyUsage = digitalSignature, nonRepudiation, keyEncipherment, dataEncipherment
extendedKeyUsage = serverAuth
subjectAltName = @alt_names[alt_names]
DNS.1=zhubl.xyz
DNS.2=zhubl
DNS.3=prometheus.zhubl.xyz
EOF
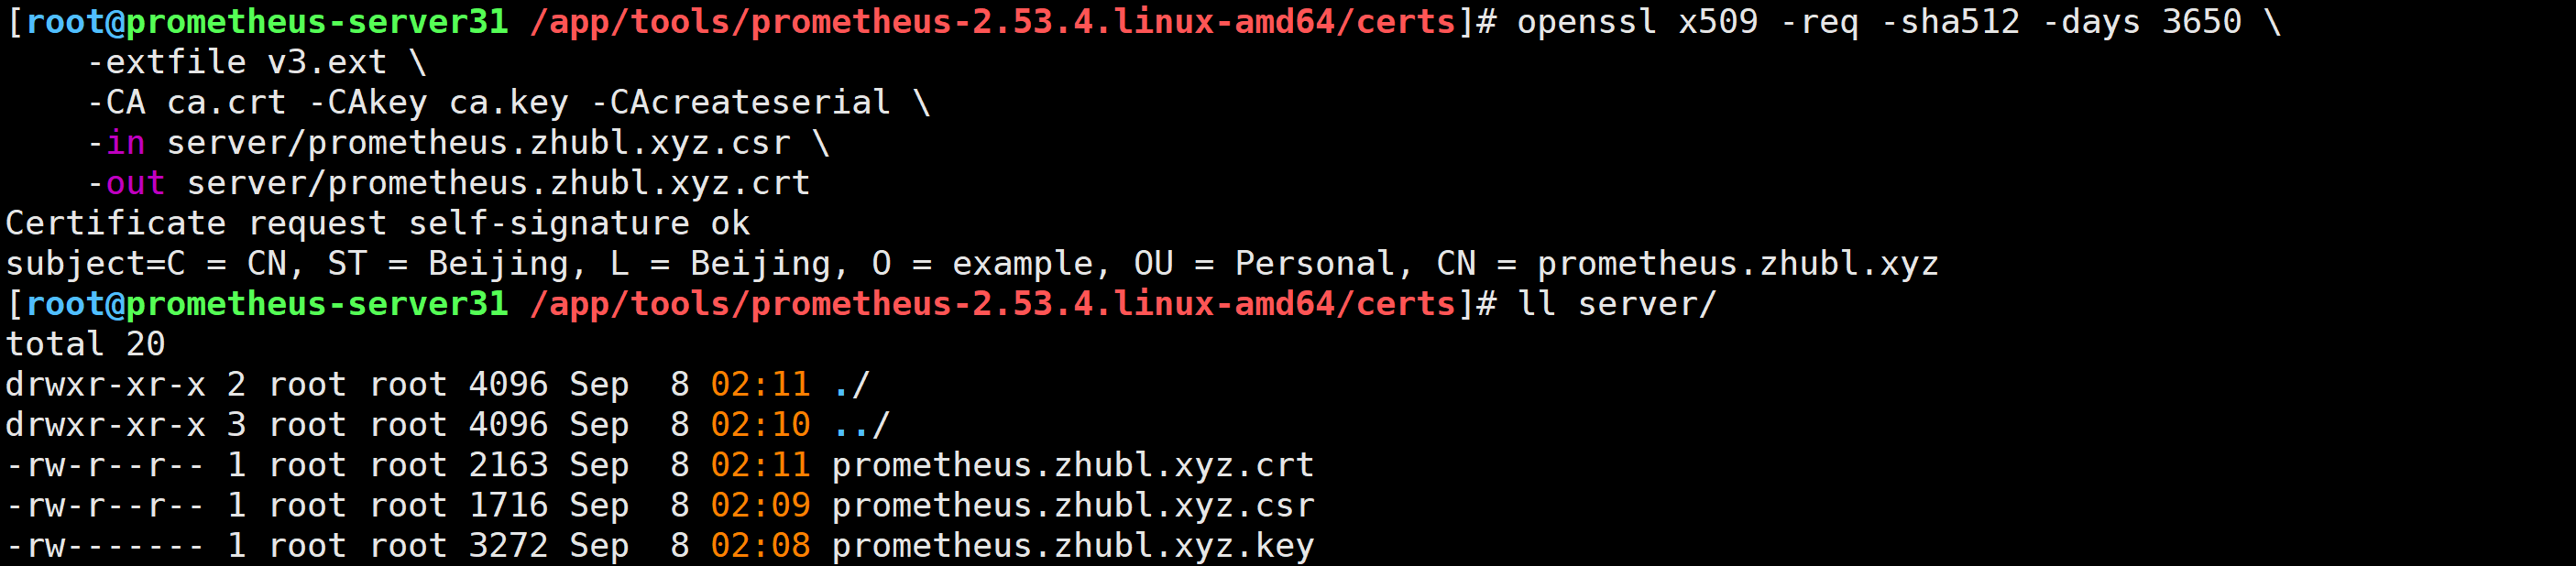
使用"v3.ext"给prometheus主机签发证书
openssl x509 -req -sha512 -days 3650 \-extfile v3.ext \-CA ca.crt -CAkey ca.key -CAcreateserial \-in server/prometheus.zhubl.xyz.csr \-out server/prometheus.zhubl.xyz.crt
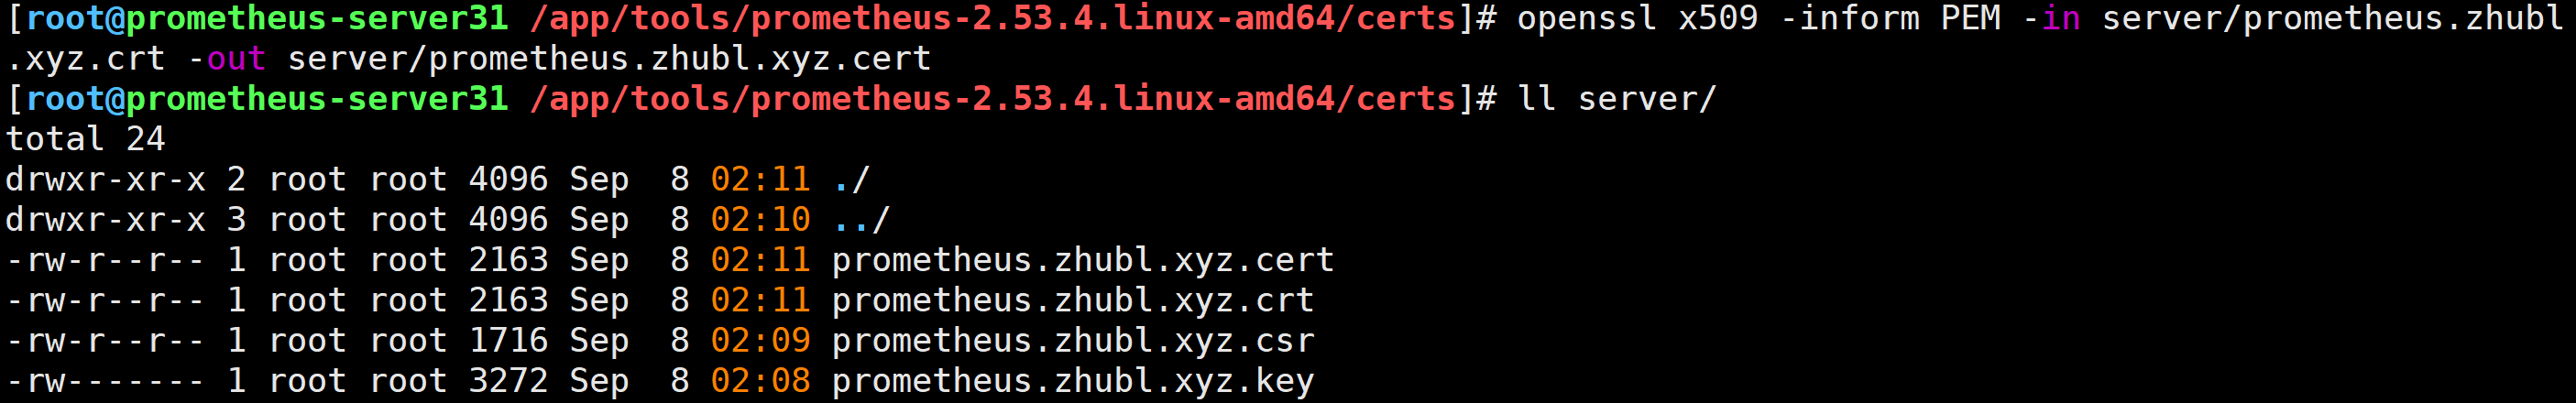
将crt文件转换为cert客户端证书文件
openssl x509 -inform PEM -in server/prometheus.zhubl.xyz.crt -out server/prometheus.zhubl.xyz.cert
生成认证初始用户(可跳过)
方式一
python3 -c 'import bcrypt; print("k8s: " + bcrypt.hashpw("zhubl".encode(), bcrypt.gensalt(rounds=10)).decode())'

方式二
[root@prometheus-server31 ~]# apt-get update
[root@prometheus-server31 ~]# apt-get -y install apache2-utils
[root@prometheus-server31 ~]# htpasswd -Bbn k8s zhubl
k8s:$2y$05$cwtXieUbCkQSFK0EiCPPr.49/JO8MwD6zbTS0IEArl2K9EyyWFbtq[root@prometheus-server31 ~]#

准备Prometheus的认证文件
vim /app/tools/prometheus-2.53.4.linux-amd64/auth.yml
tls_server_config:cert_file: /app/tools/prometheus-2.53.4.linux-amd64/certs/server/prometheus.zhubl.xyz.crtkey_file: /app/tools/prometheus-2.53.4.linux-amd64/certs/server/prometheus.zhubl.xyz.key
# 下面的认证信息可以注释,若启用,则访问https页面时需要指定认证信息哟~
basic_auth_users:k8s: $2b$10$LRfmdrmUBOfL3GrAvCp69ep36rDgpqfKNbO7/u/jjOTJraBgWS3f2
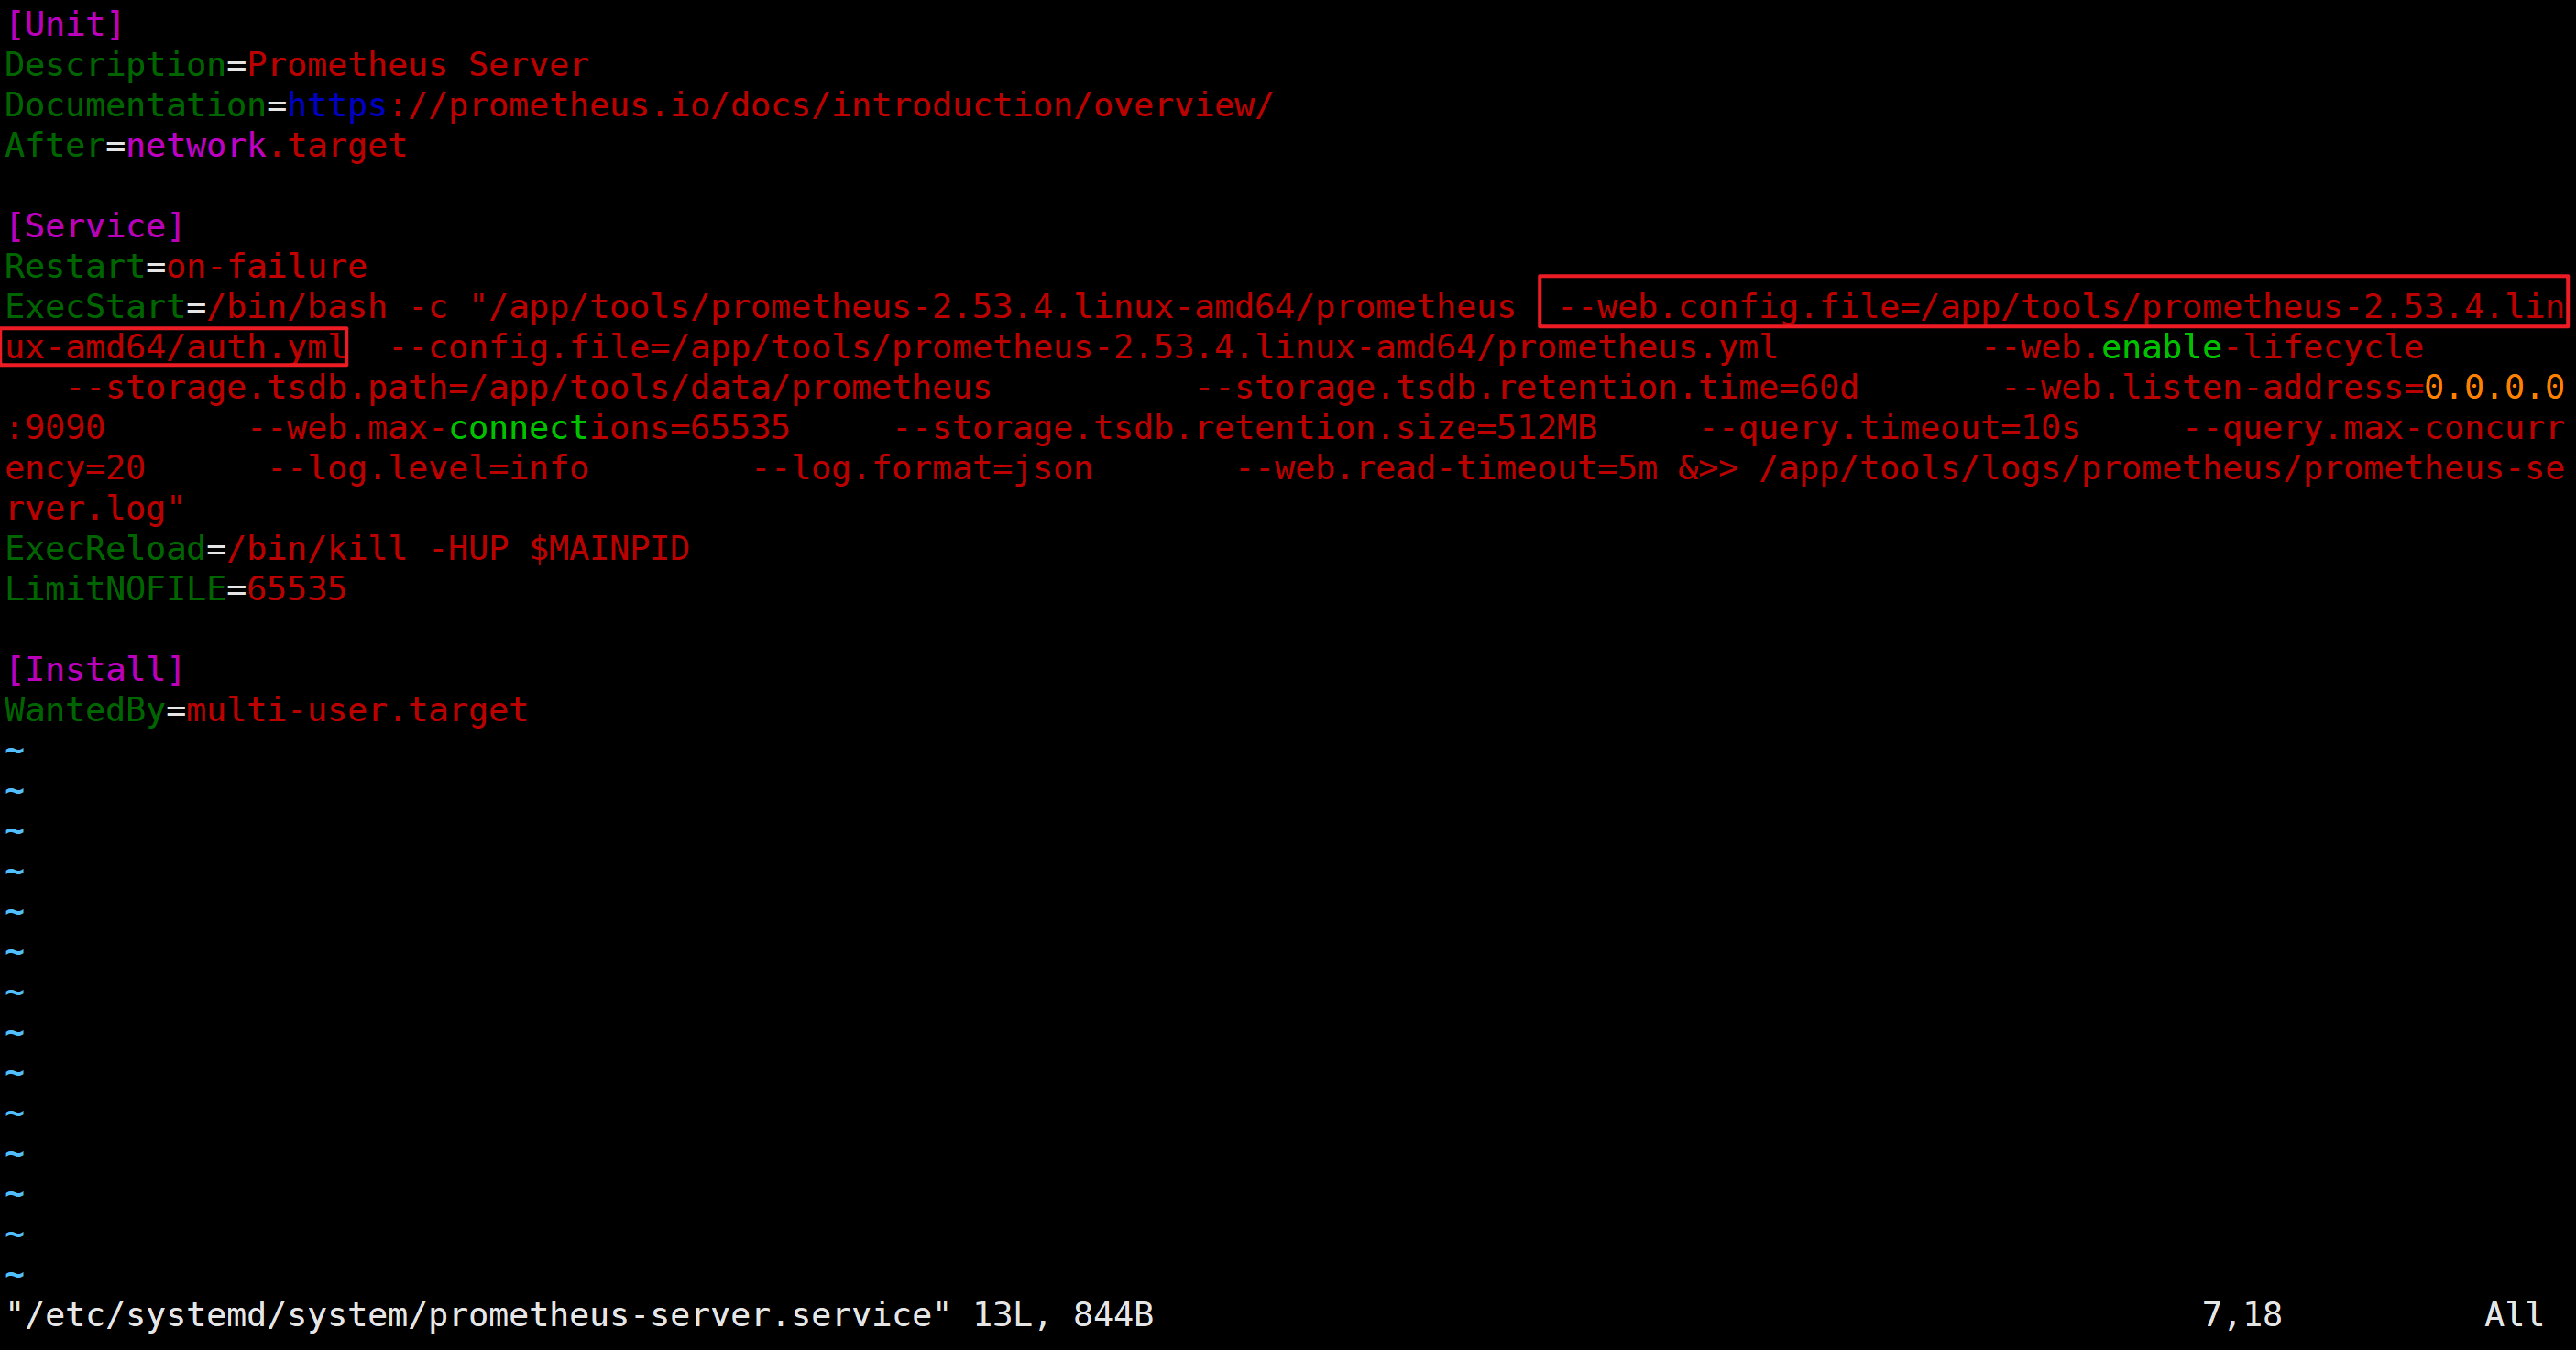
修改Prometheus的启动脚本添加’–web.config.file’参数指定认证文件
vim /etc/systemd/system/prometheus-server.service
...
[Service]
...
ExecStart=/bin/bash -c "/app/tools/prometheus-2.53.4.linux-amd64/prometheus --web.config.file=/app/tools/prometheus-2.53.4.linux-amd64/auth.yml ....
重启Prometheus服务
1.加载服务配置文件
systemctl daemon-reload2.重启服务
systemctl restart prometheus-server.service3.检查
ss -ntl | grep 9090
访问测试
✅使用认证文件的用户配置即可。
✅温馨提示: 生产环境中,如果使用权威机构证书,可跳过前2个步骤。
🌟Prometheus基于文件的服务发现案例
静态配置:(static_configs)
- 修改Prometheus的配置文件时需要热加载配置文件或者重启服务生效。
动态配置:(*_sd_config)
- 无需重启或热加载服务,可以监听本地的文件,或者通过注册中心,服务发现中心发现要监控的目标。
参考链接:
https://prometheus.io/docs/prometheus/latest/configuration/configuration/#file_sd_config
修改配置文件
[root@prometheus-server31 ~]# vim /app/tools/prometheus-2.53.4.linux-amd64/prometheus.yml
...- job_name: "file-sd"file_sd_configs:- files:- /tmp/xixi.json- /tmp/haha.yaml
热加载配置文件
[root@promethues-server31 prometheus-2.53.4.linux-amd64]# curl -X POST https://10.0.0.31:9090/-/reload -k -u k8s:zhubl
[root@promethues-server31 prometheus-2.53.4.linux-amd64]#
[root@promethues-server31 prometheus-2.53.4.linux-amd64]#  ./promtool check config prometheus.yml
Checking prometheus.ymlWARNING: file "/tmp/xixi.json" for file_sd in scrape job "file-sd" does not existWARNING: file "/tmp/haha.yaml" for file_sd in scrape job "file-sd" does not existSUCCESS: prometheus.yml is valid prometheus config file syntax

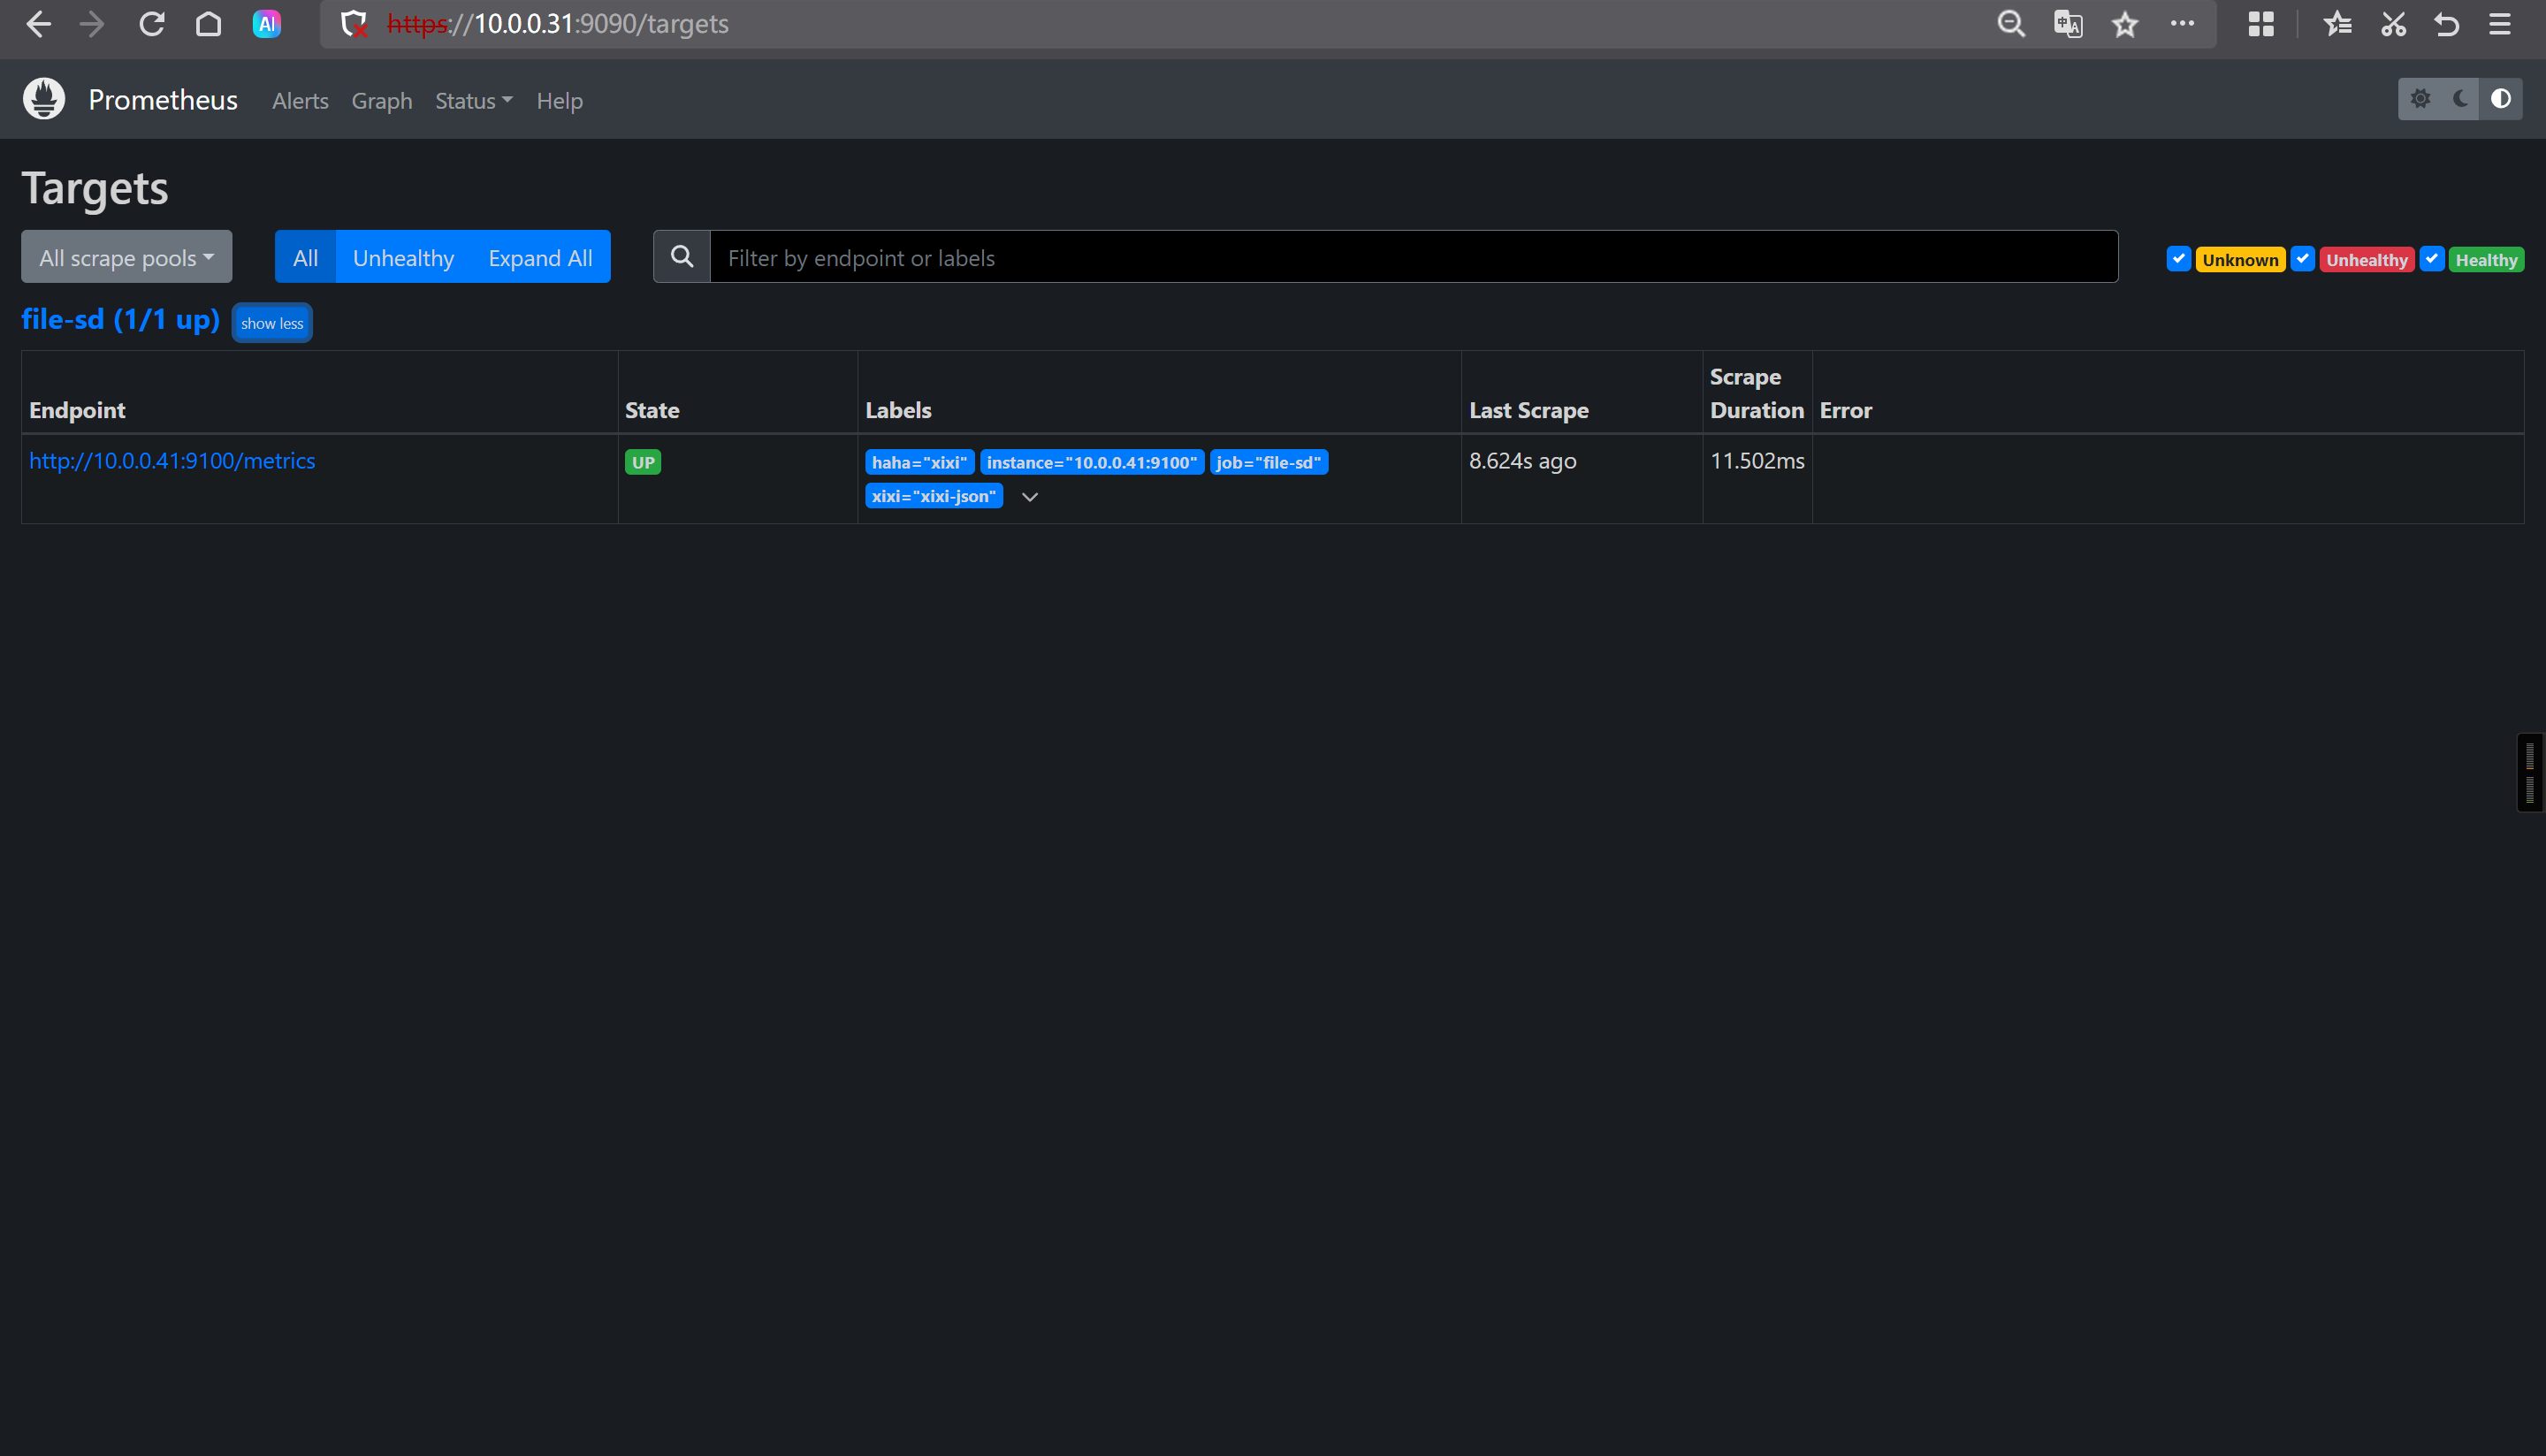
修改json格式文件
[root@prometheus-server31 /app/tools/prometheus-2.53.4.linux-amd64]# cat > /tmp/xixi.json <<EOF
[{"targets": [ "10.0.0.41:9100" ],"labels": {"haha": "xixi", "xixi": "xixi-json"}}
]
EOF
验证是否自动监控目标
https://10.0.0.31:9090/targets?search=
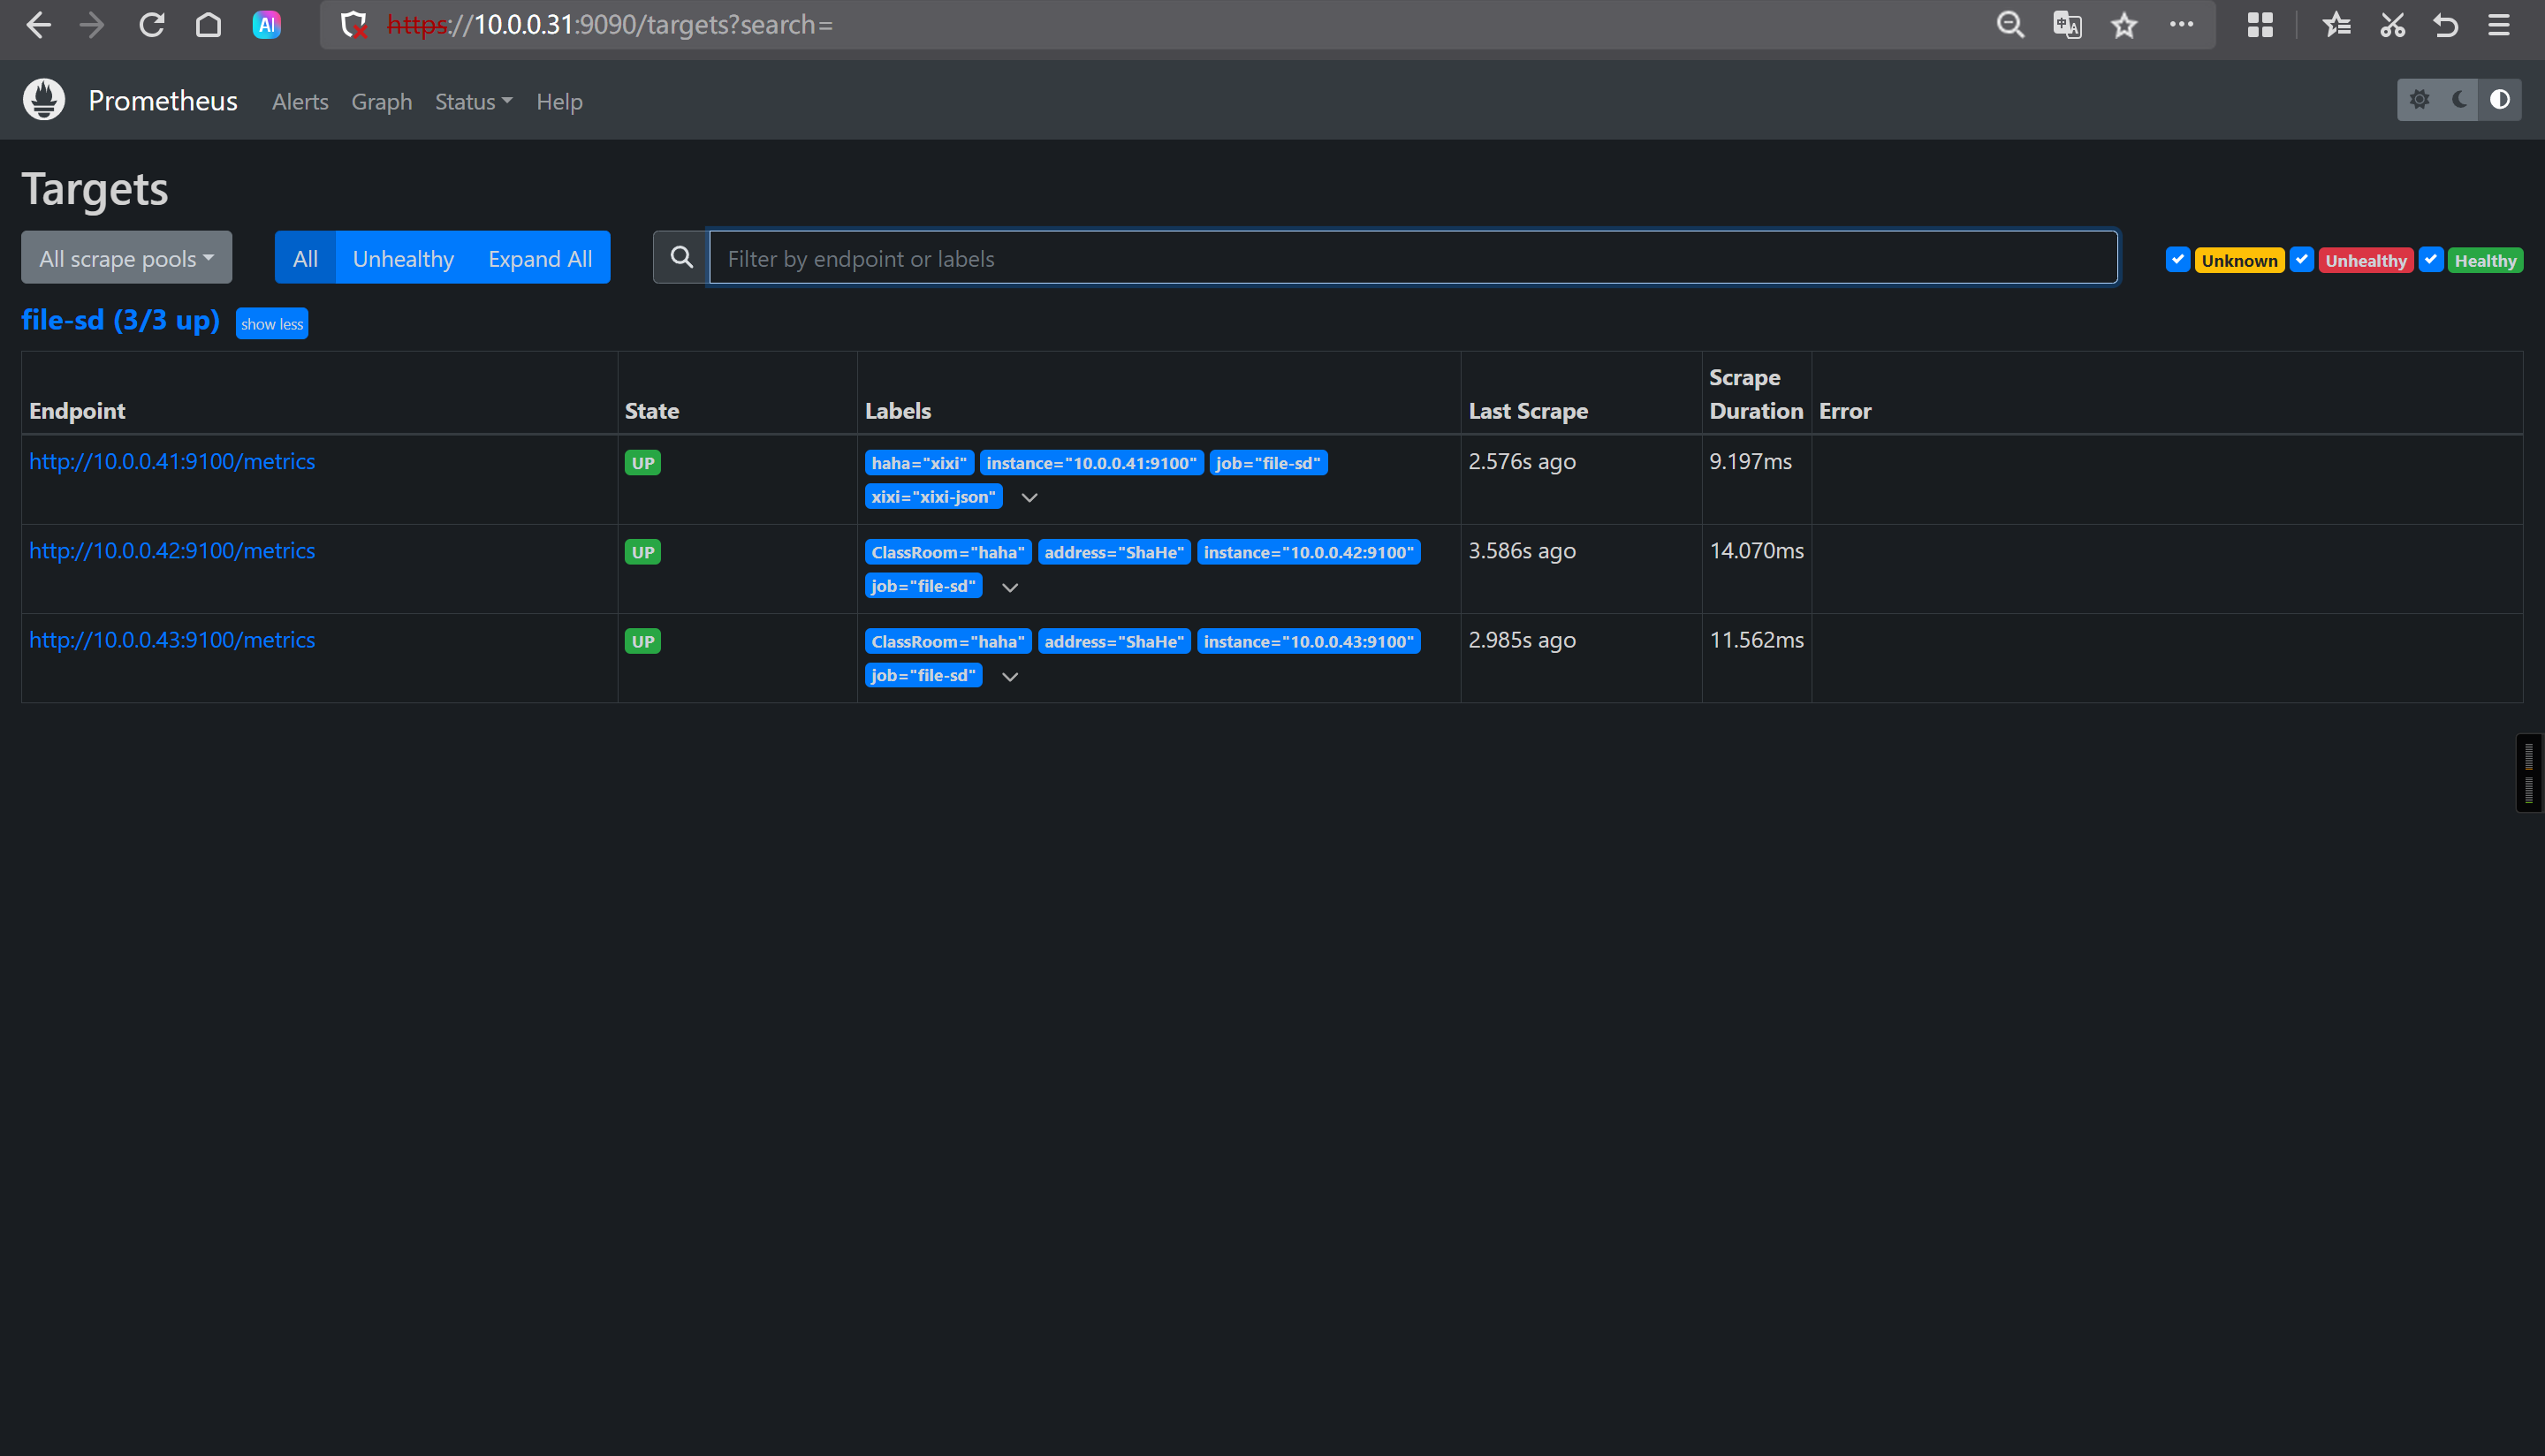
再次编写yaml文件
[root@prometheus-server31 /app/tools/prometheus-2.53.4.linux-amd64]# cat > /tmp/haha.yaml <<EOF
- targets:- '10.0.0.42:9100' - '10.0.0.43:9100' labels:address: ShaHeClassRoom: haha
EOF
[root@promethues-server31 prometheus-2.53.4.linux-amd64]# ./promtool check config prometheus.yml
Checking prometheus.ymlSUCCESS: prometheus.yml is valid prometheus config file syntax

验证是否自动监控目标
https://10.0.0.31:9090/targets?search=
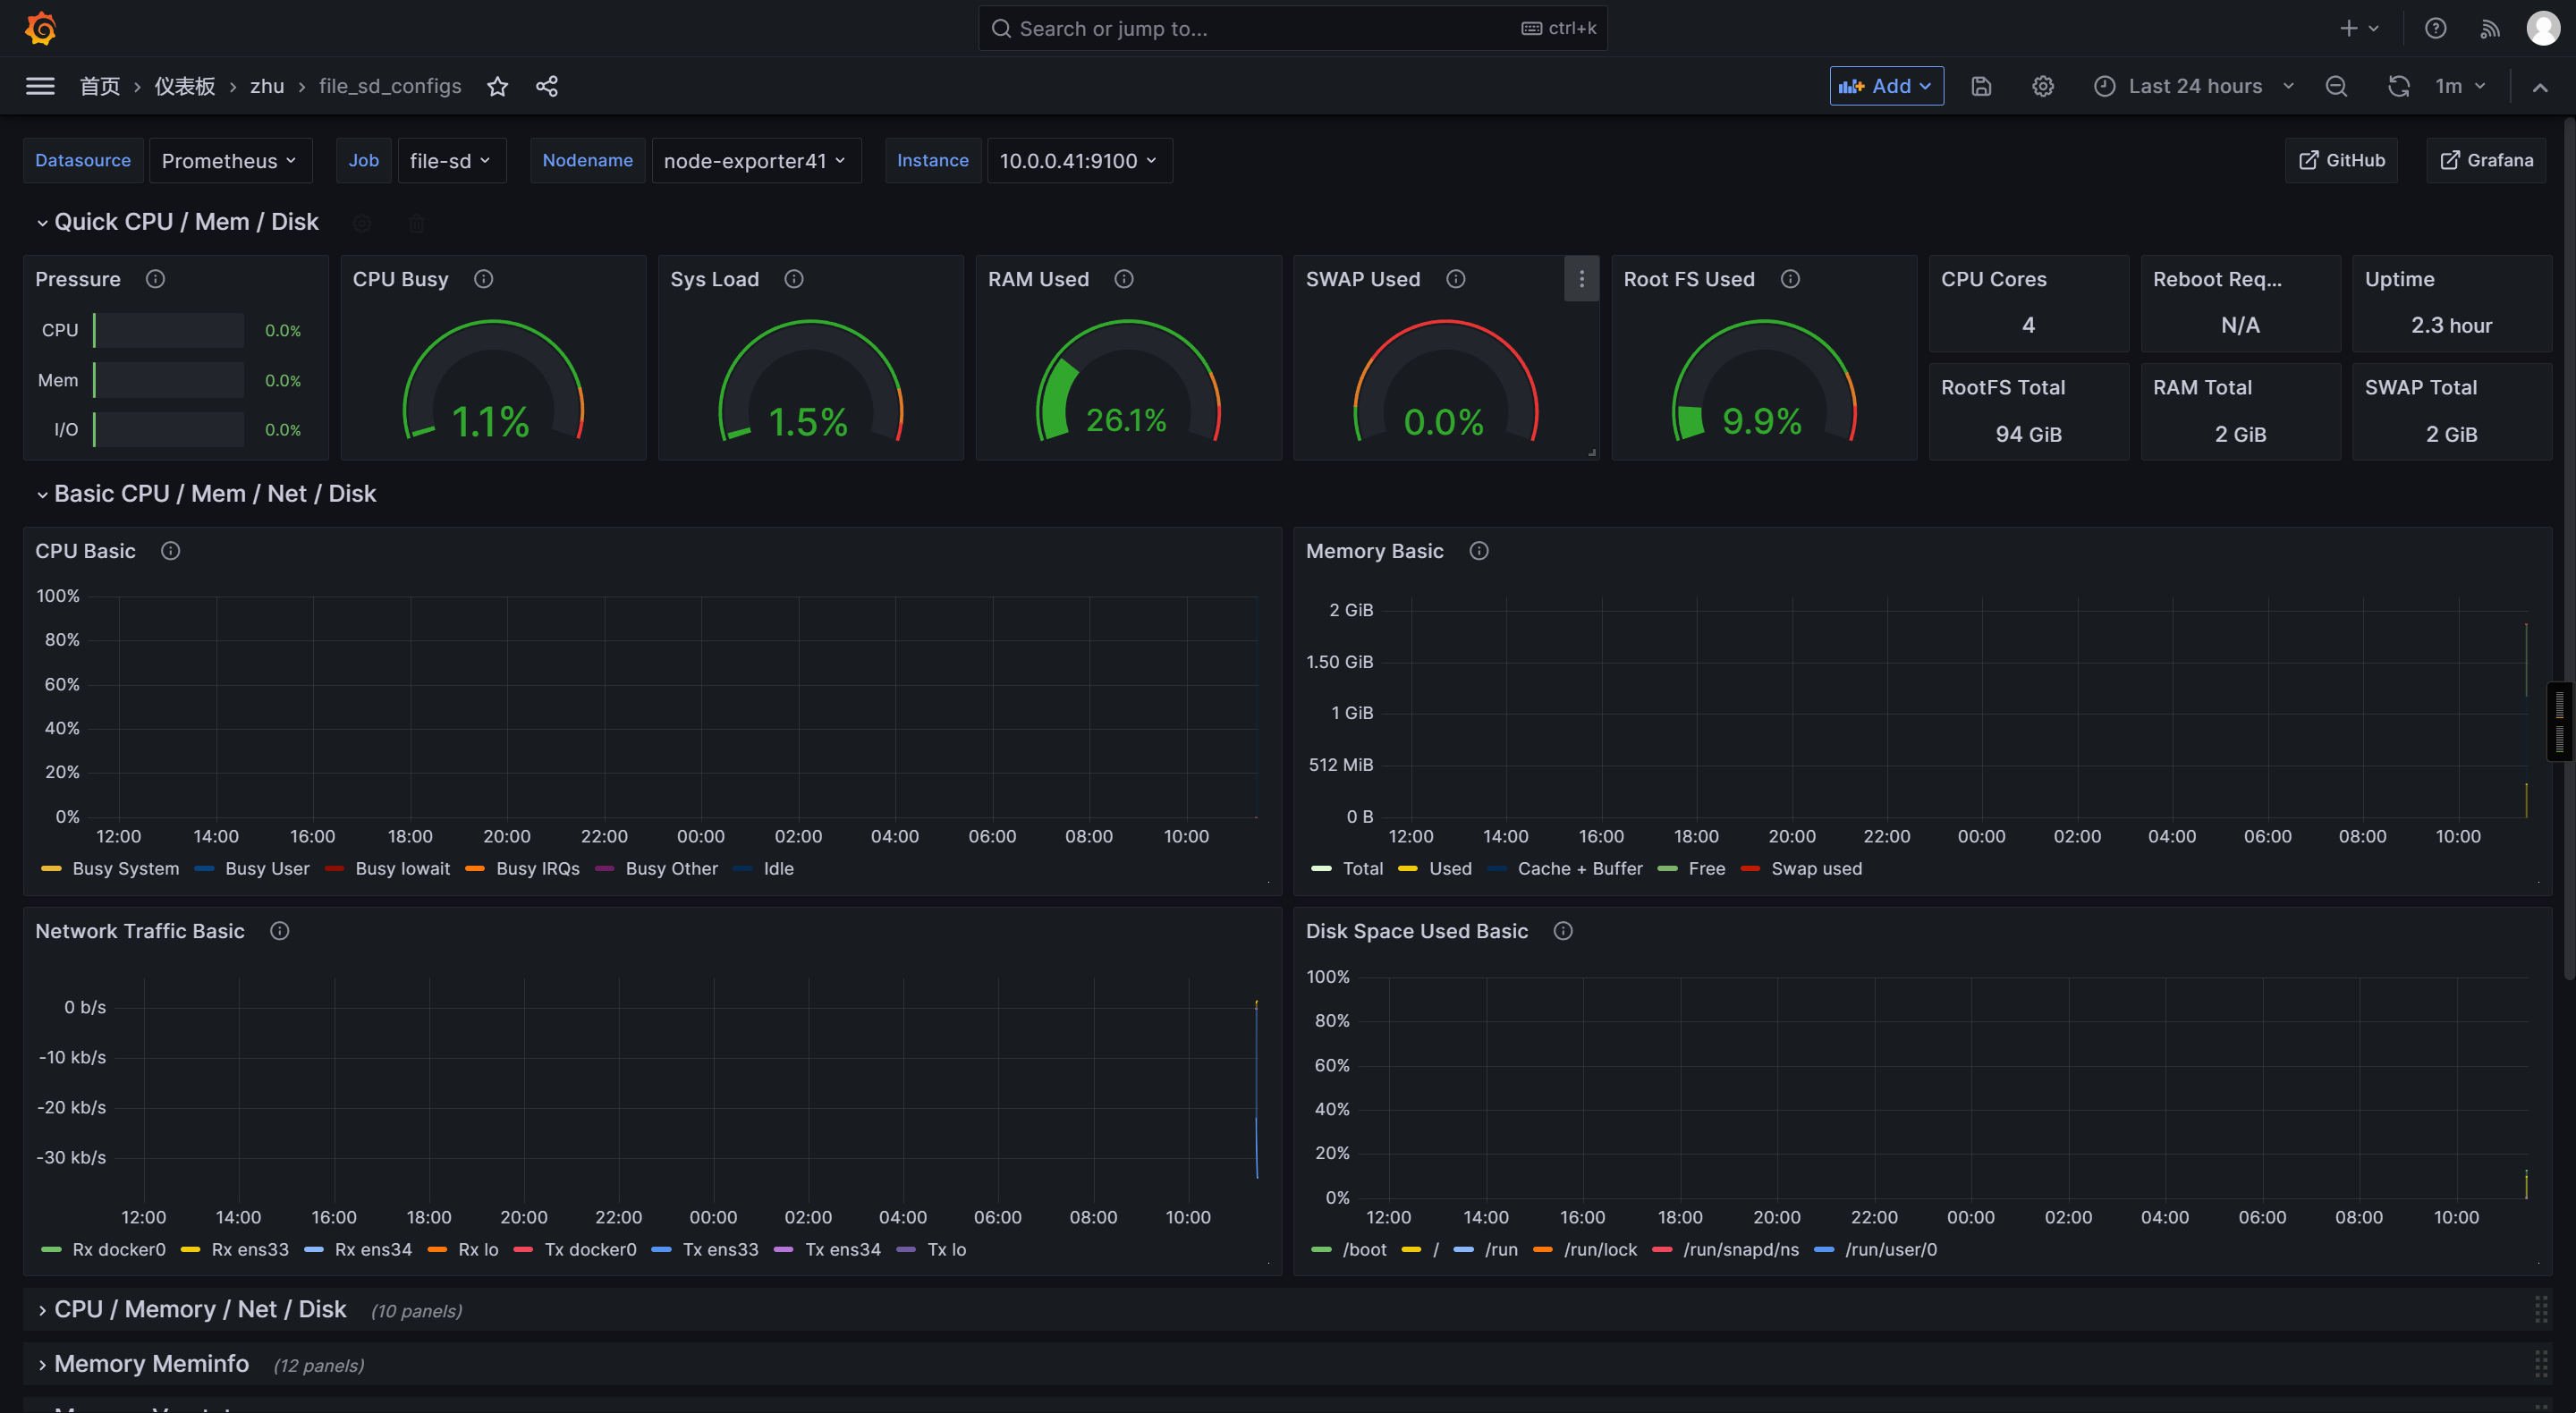
Grafana导入模板ID
1860
🌟基于consul的服务发现案例
官方文档:
https://www.consul.io/
https://developer.hashicorp.com/consul/install#linux
部署consul集群
下载consul(41-43节点)
wget https://releases.hashicorp.com/consul/1.21.4/consul_1.21.4_linux_amd64.zip
解压consul
[root@node-exporter41 ~]# unzip consul_1.21.4_linux_amd64.zip  -d /usr/local/bin/[root@node-exporter41 ~]# scp /usr/local/bin/consul 10.0.0.42:/usr/local/bin/
[root@node-exporter41 ~]# scp /usr/local/bin/consul 10.0.0.43:/usr/local/bin/
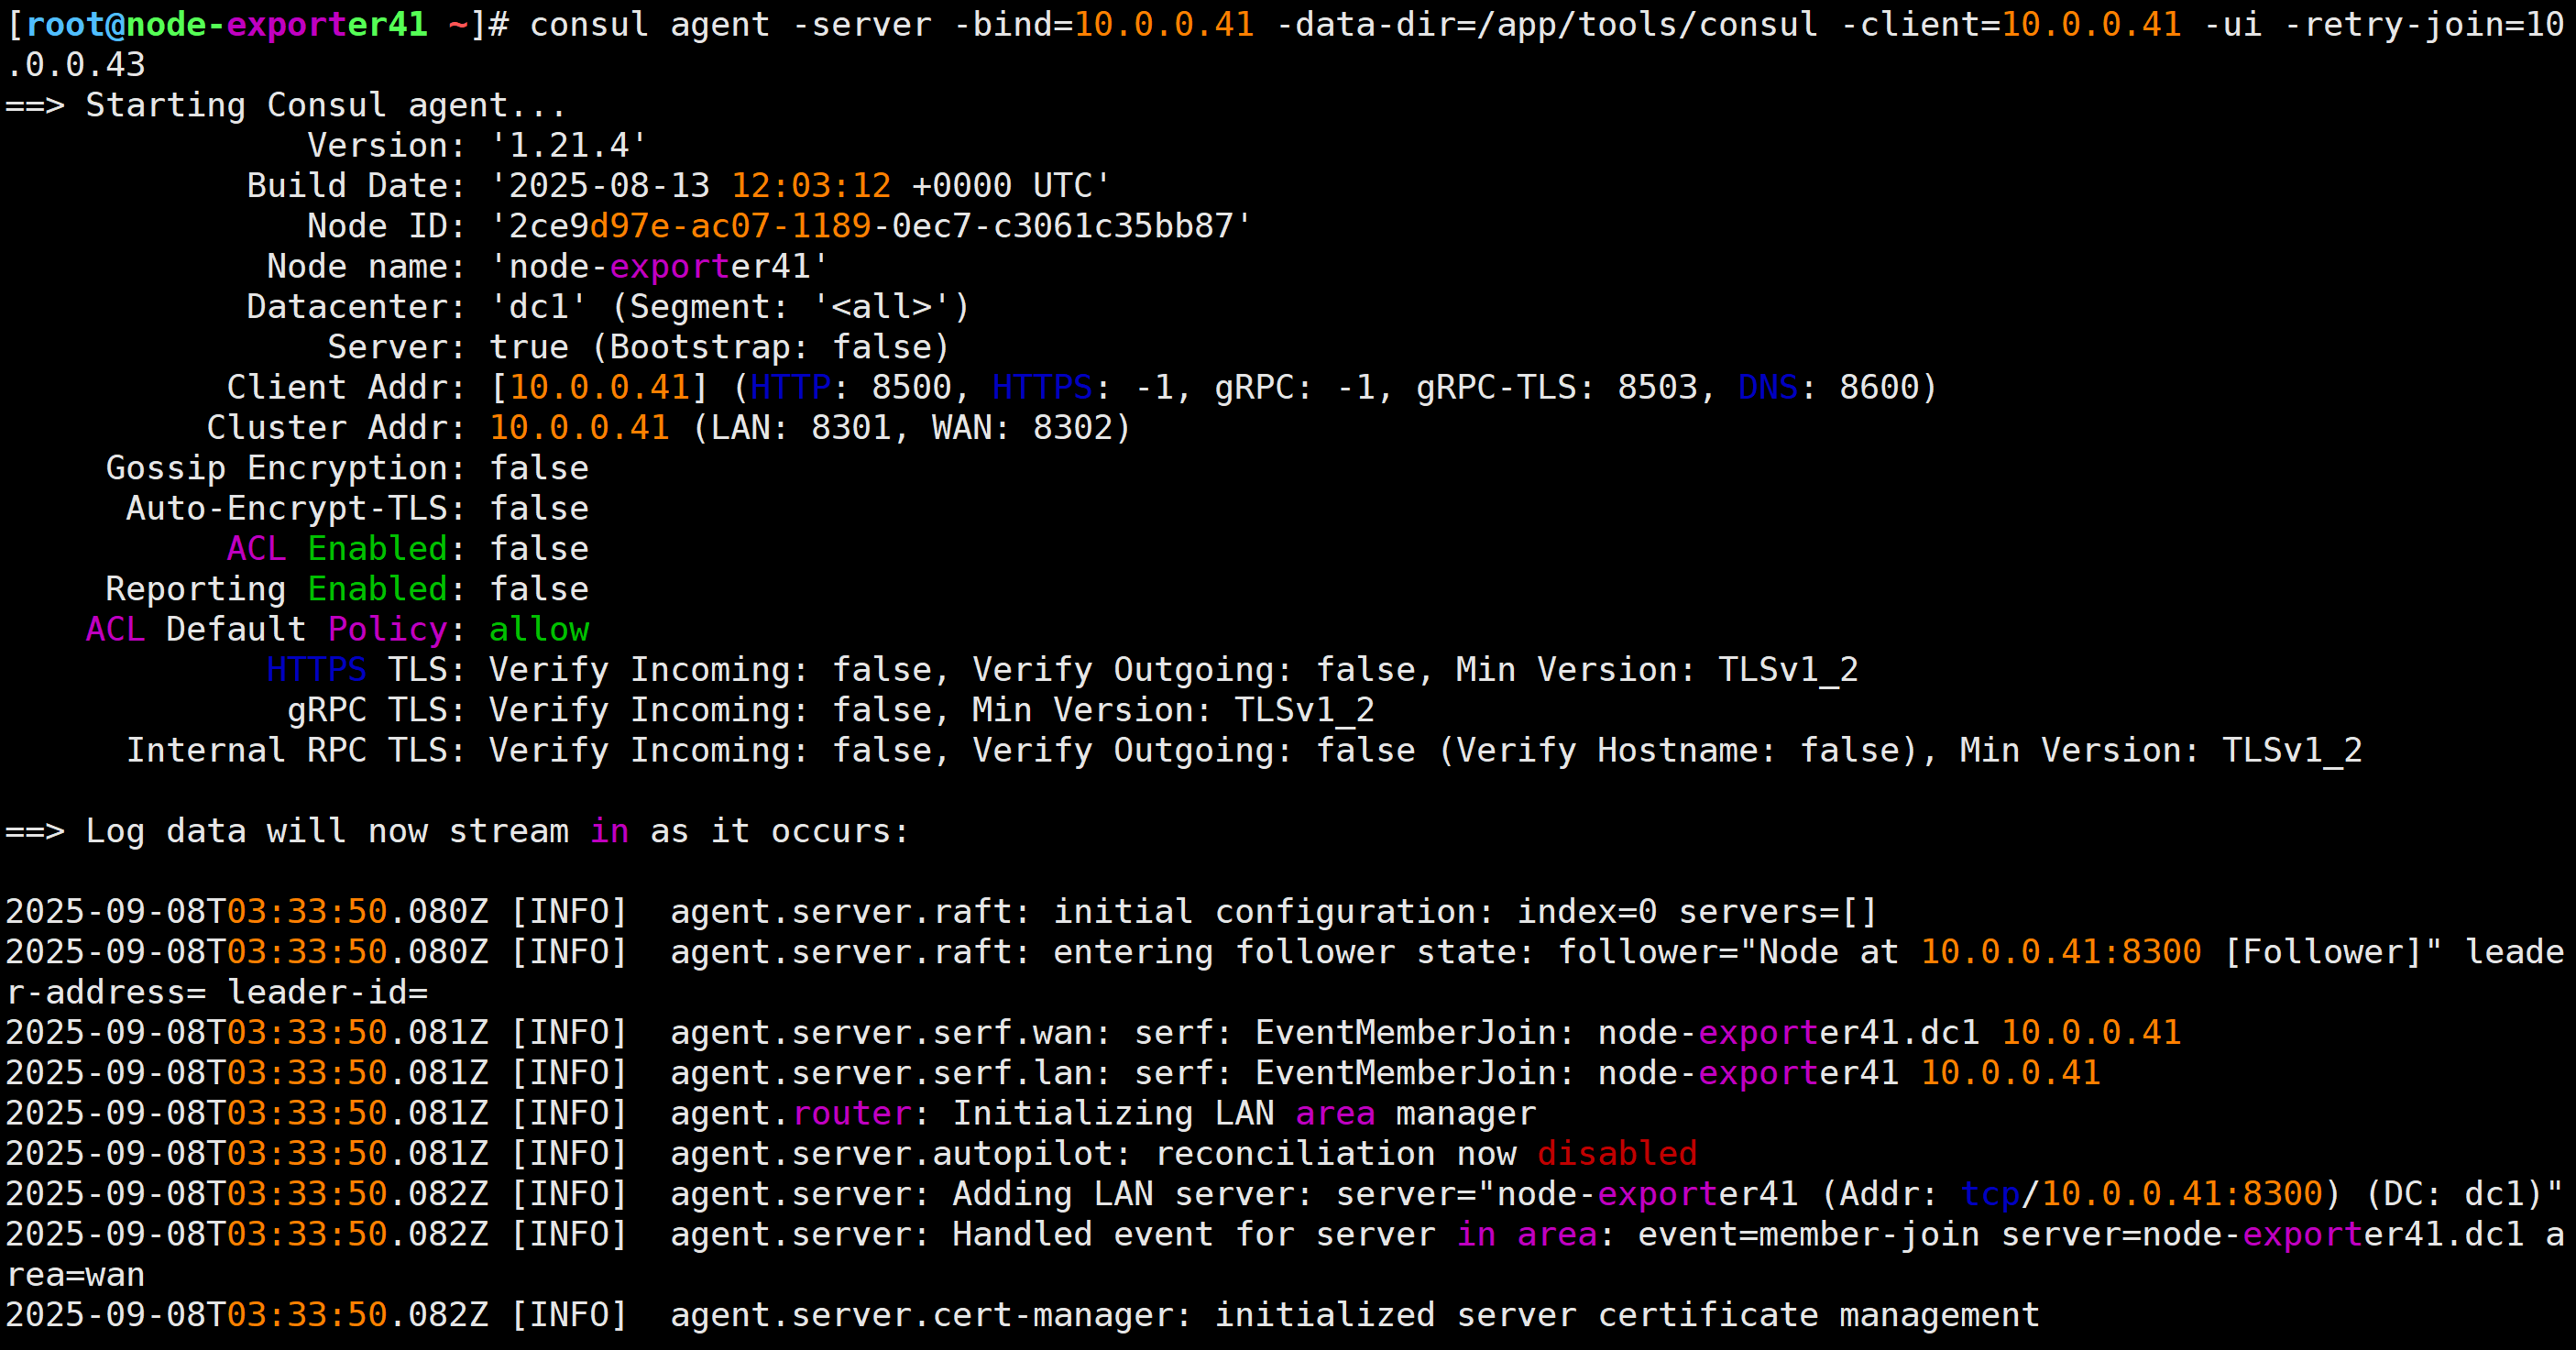
运行consul 集群
服务端43:
[root@node-exporter43 ~]# consul agent -server -bootstrap -bind=10.0.0.43 -data-dir=/app/tools/consul -client=10.0.0.43 -ui客户端42:
[root@node-exporter42 ~]# consul agent -server -bind=10.0.0.42 -data-dir=/app/tools/consul -client=10.0.0.42 -ui -retry-join=10.0.0.43客户端41:
[root@node-exporter41 ~]# consul agent -server -bind=10.0.0.41 -data-dir=/app/tools/consul -client=10.0.0.41 -ui -retry-join=10.0.0.43
查看各节点的监听端口
ss -ntl | egrep "8300|8500"


访问console服务的WebUI
http://10.0.0.43:8500/ui/dc1/nodes
使用consul实现自动发现
修改prometheus的配置文件
[root@prometheus-server31 ~]# vim /app/tools/prometheus-2.53.4.linux-amd64/prometheus.yml- job_name: "consul-seriver-discovery"# 配置基于consul的服务发现consul_sd_configs:# 指定consul的服务器地址,若不指定,则默认值为"localhost:8500".- server: 10.0.0.43:8500- server: 10.0.0.42:8500- server: 10.0.0.41:8500relabel_configs:# 匹配consul的源标签字段,表示服务名称- source_labels: [__meta_consul_service]# 指定源标签的正则表达式,若不定义,默认值为"(.*)"regex: consul# 执行动作为删除,默认值为"replace",有效值有多种# https://prometheus.io/docs/prometheus/latest/configuration/configuration/#relabel_actionaction: drop
检查配置文件是否正确
[root@prometheus-server31 ~]# cd /app/tools/prometheus-2.53.4.linux-amd64/
[root@prometheus-server31 prometheus-2.53.4.linux-amd64]#
[root@prometheus-server31 prometheus-2.53.4.linux-amd64]# ./promtool check config ./prometheus.yml
Checking ./prometheus.ymlSUCCESS: ./prometheus.yml is valid prometheus config file syntax

重新加载配置
[root@prometheus-server31 ~]# curl -X POST https://10.0.0.31:9090/-/reload -k -u k8s:zhubl
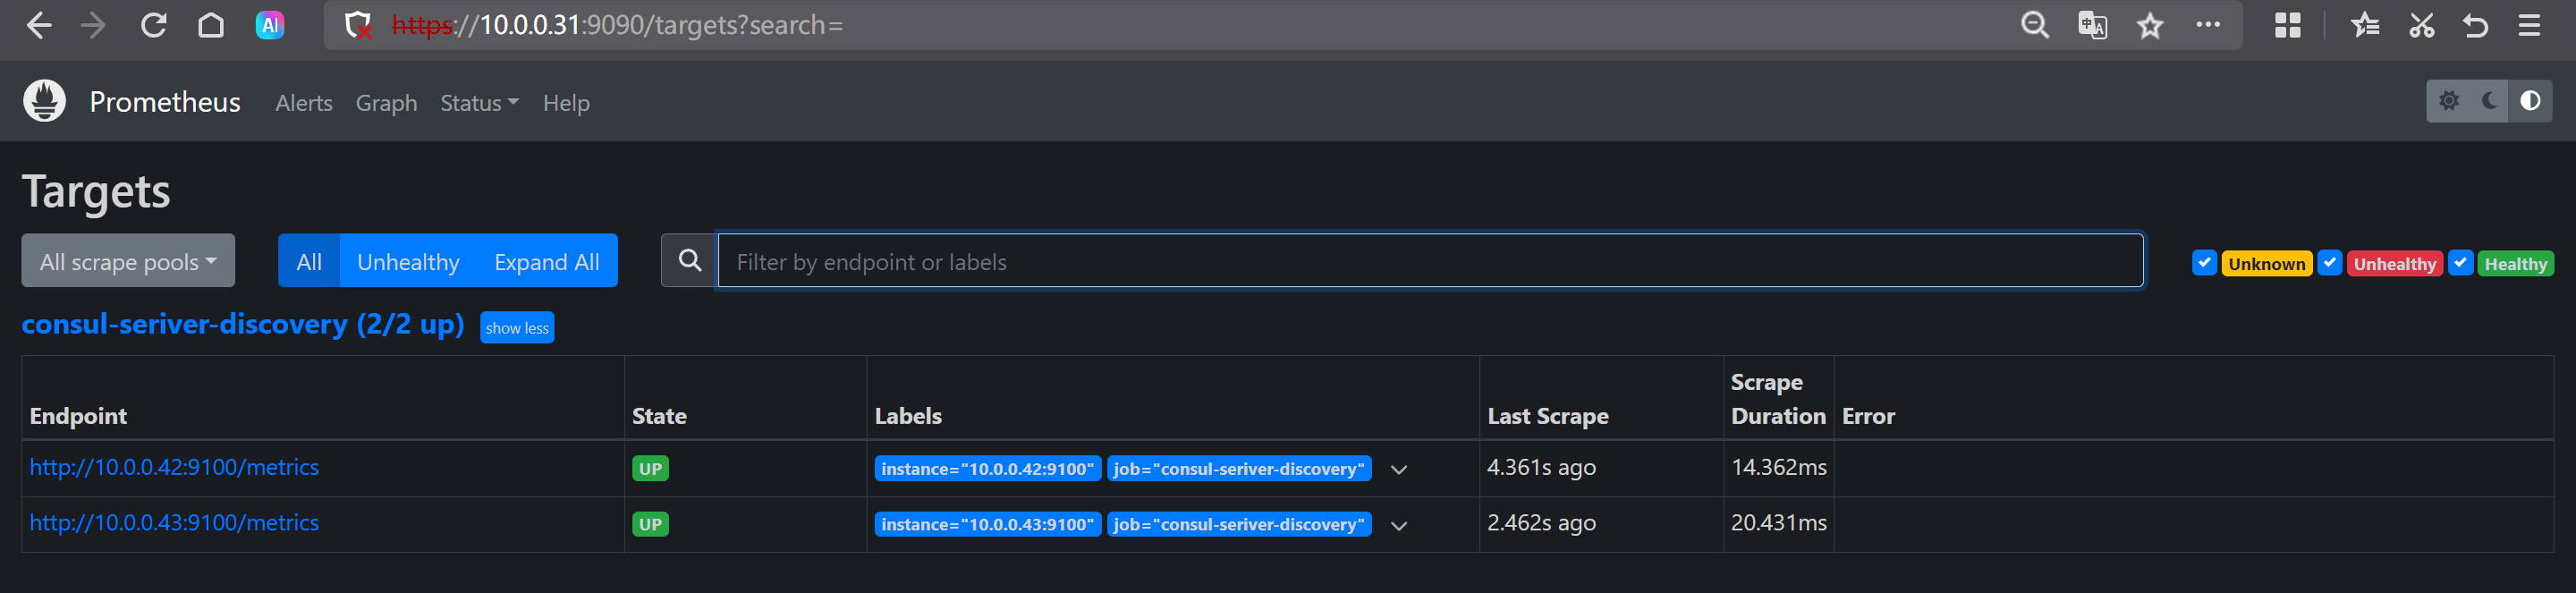
被监控节点注册到console集群
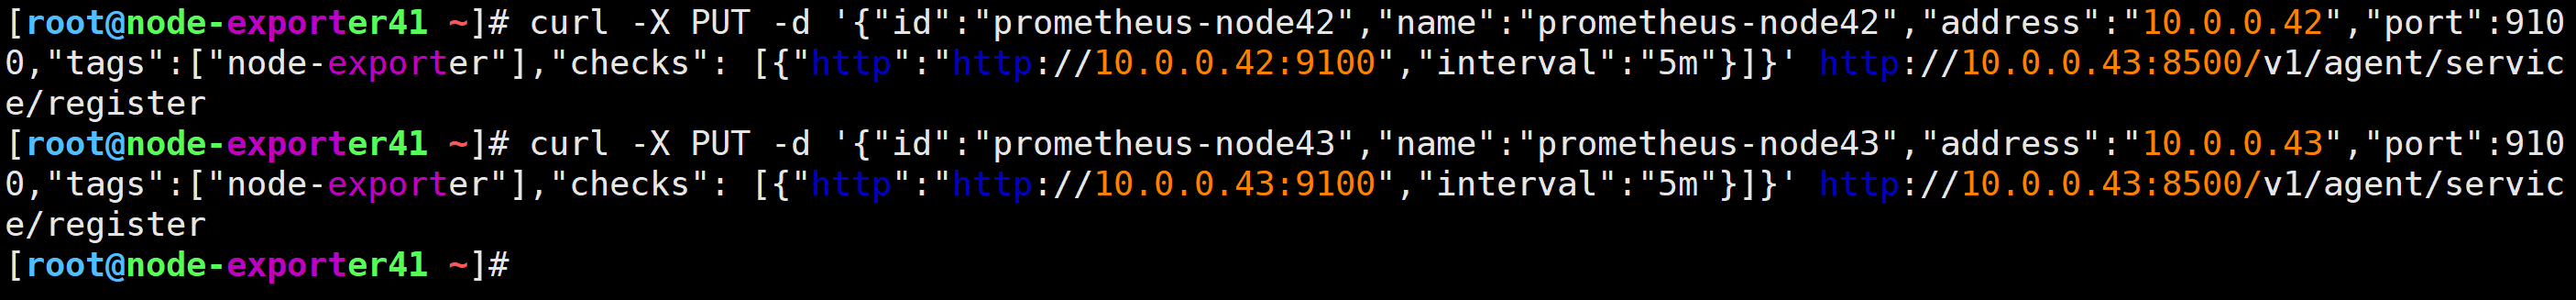
1 注册节点
curl -X PUT -d '{"id":"prometheus-node42","name":"prometheus-node42","address":"10.0.0.42","port":9100,"tags":["node-exporter"],"checks": [{"http":"http://10.0.0.42:9100","interval":"5m"}]}' http://10.0.0.43:8500/v1/agent/service/registercurl -X PUT -d '{"id":"prometheus-node43","name":"prometheus-node43","address":"10.0.0.43","port":9100,"tags":["node-exporter"],"checks": [{"http":"http://10.0.0.43:9100","interval":"5m"}]}' http://10.0.0.43:8500/v1/agent/service/register
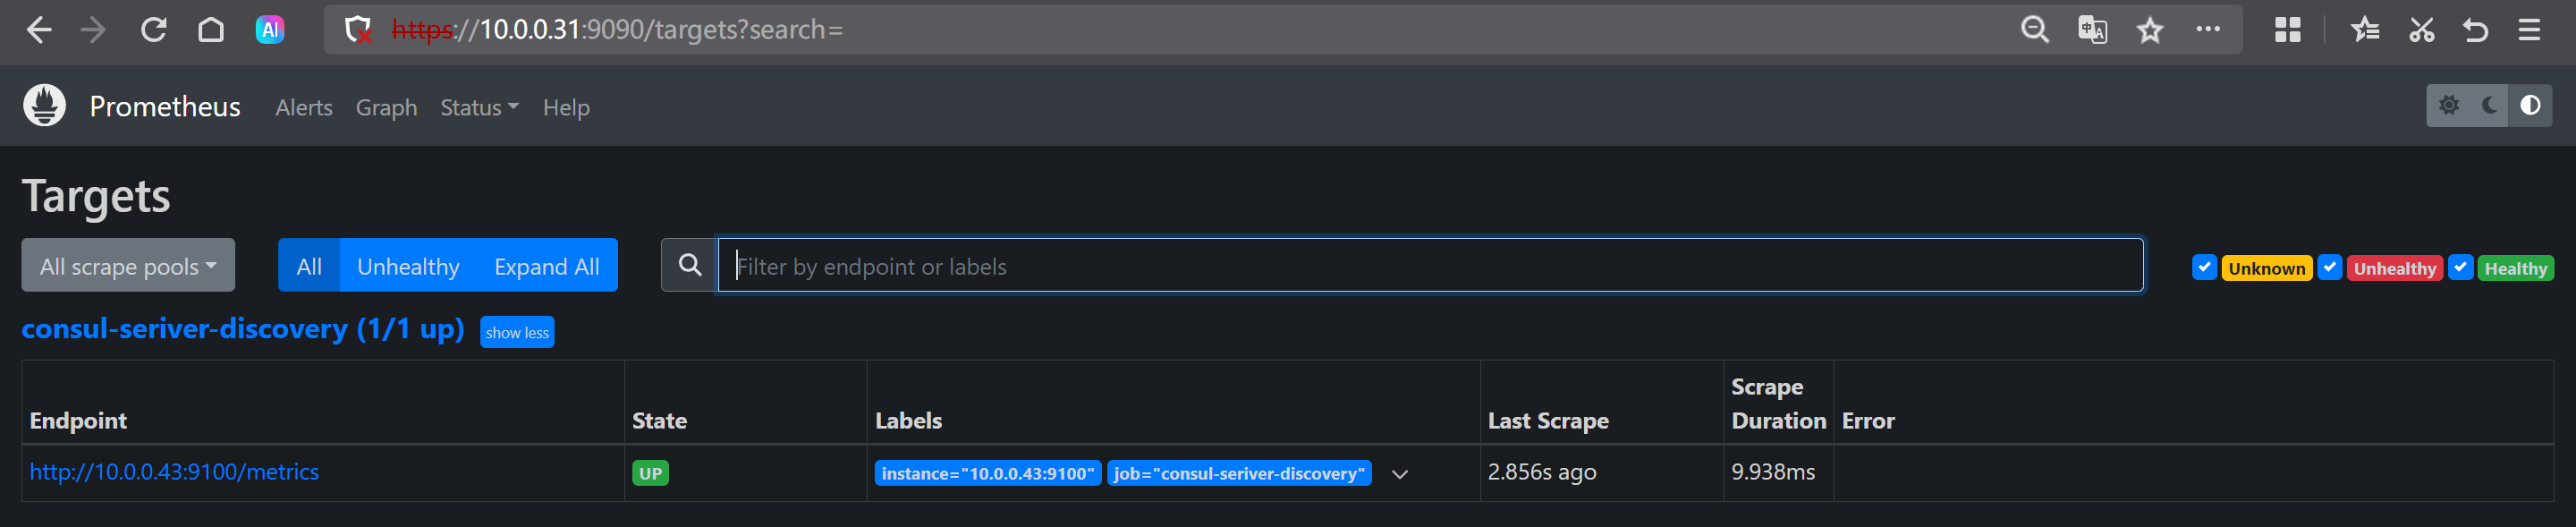
被监控节点注销
curl -X PUT http://10.0.0.43:8500/v1/agent/service/deregister/prometheus-node42
TODO—> 目前有个坑
你注册时找得哪个节点,那么注销时也要找这个节点注销,待解决…
🌟Prometheus监控https实战案例
参考链接:
https://prometheus.io/docs/prometheus/2.54/configuration/configuration/#scrape_config
https://prometheus.io/docs/prometheus/2.54/configuration/configuration/#tls_config
修改Prometheus的配置文件
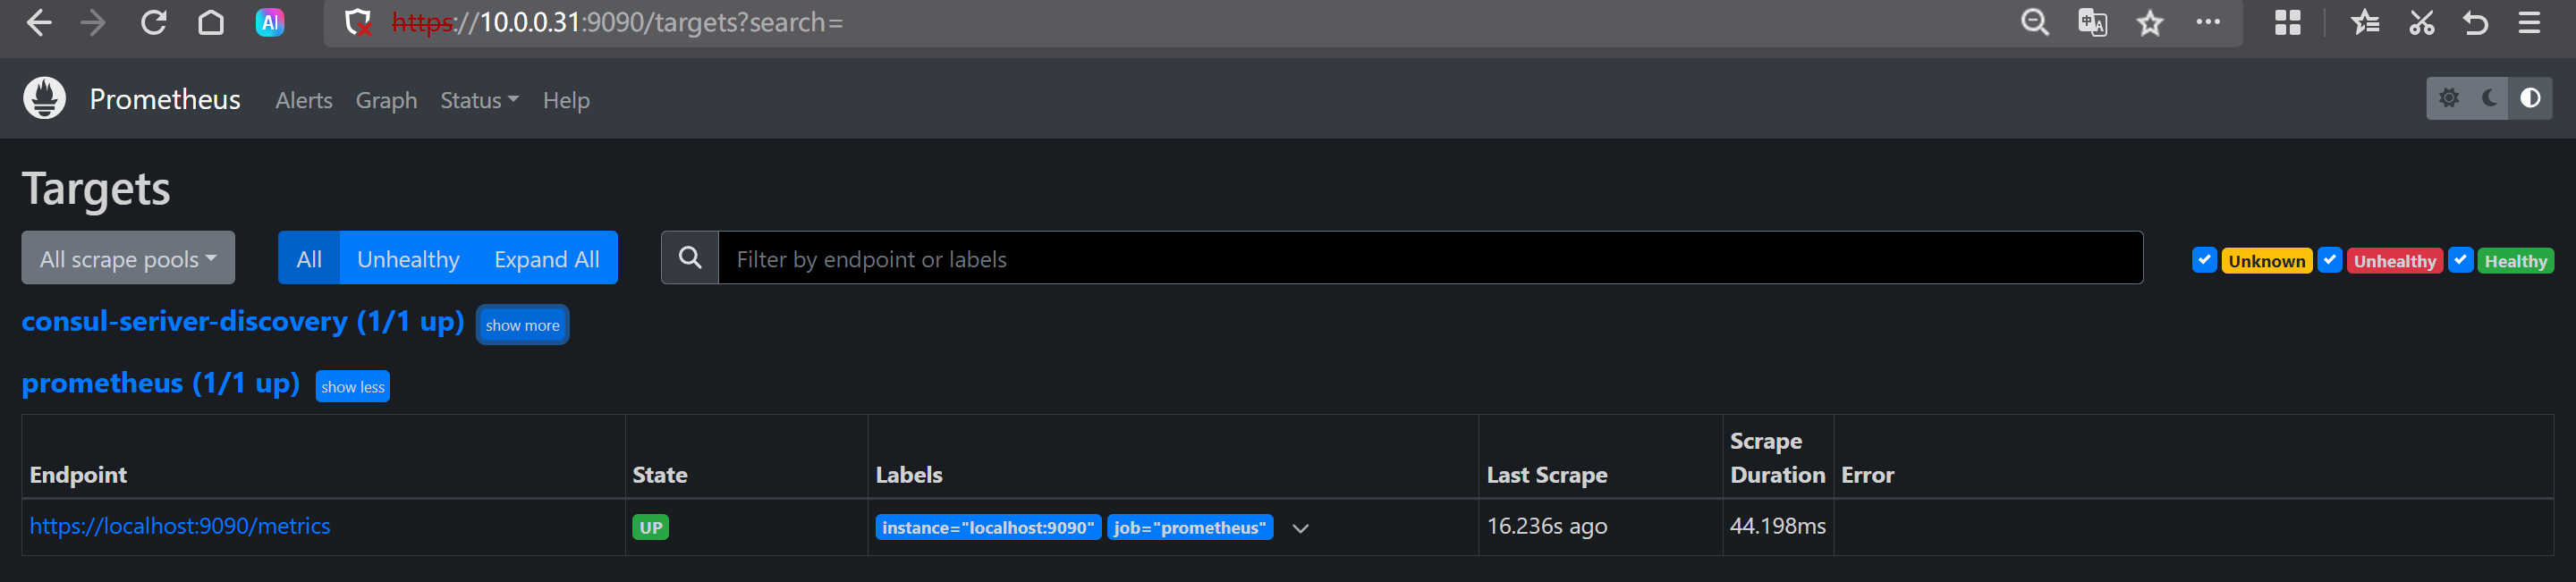
[root@prometheus-server31 ~]# vim /app/tools/prometheus-2.53.4.linux-amd64/prometheus.yml - job_name: "prometheus"# 指定要使用的协议scheme: 'https'# 配置https证书相关信息tls_config:ca_file: certs/ca.crtcert_file: certs/server/prometheus.zhubl.xyz.crtkey_file: certs/server/prometheus.zhubl.xyz.keyinsecure_skip_verify: true# 认证相关的信息basic_auth:username: k8spassword: zhubl
热加载配置
[root@prometheus-server31 ~]# curl -X POST https://10.0.0.31:9090/-/reload -k -u k8s:zhubl
Prometheus的WebUI验证
https://10.0.0.31:9090/targets?search=
🌟node-exporter的黑白名单
参考链接:
https://github.com/prometheus/node_exporter
停止服务
systemctl stop node-exporter.service
配置黑名单
./node_exporter --no-collector.cpu
配置白名单
./node_exporter --collector.disable-defaults --collector.cpu --collector.uname
相关指标测试
node_cpu_seconds_total----》 cpunode_uname_info----》 uname
🌟Prometheus server实现黑白名单
黑名单
修改配置文件
vim /app/tools/prometheus-2.53.4.linux-amd64/prometheus.yml- job_name: "k8s_exporter"params:exclude[]:- cpu static_configs:- targets: ["10.0.0.42:9100"]
过滤方式
node_cpu_seconds_total{job="k8s_exporter"}
白名单
修改配置文件
vim /app/tools/prometheus-2.53.4.linux-amd64/prometheus.yml- job_name: "dba_exporter"params:collect[]:- unamestatic_configs:- targets: ["10.0.0.41:9100"]
过滤方式
node_uname_info{job="dba_exporter"}
🌟Prometheus的标签管理
什么是标签
标签用于对数据分组和分类,利用标签可以将数据进行过滤筛选
标签管理的常见场景
- 删除不必要的指标
- 从指标中删除敏感或不需要的标签
- 添加,编辑或修改指标的标签值或标签格式
标签的分类
默认标签
Prometheus自身内置的标签,格式为"__LABLE__"。如上图所示,典型点如下所示:- "__metrics_path__"- "__address__"- "__scheme__"- "__scrape_interval__"- "__scrape_timeout__"- "instance"- "job"
应用标签
应用本身内置,尤其是监控特定的服务,会有对应的应用标签,格式一般为"__LABLE"如下图所示,以consul服务为例,典型点如下所示:- "__meta_consul_address"- "__meta_consul_dc"- ...
自定义标签
指的是用户自定义的标签,我们在定义targets可以自定义。
标签主要有两种表现形式
私有标签
以"__*“样式存在,用于获取监控目标的默认元数据属性,比如"scheme”,“address”,"metrics_path"等。
普通标签
对监控指标进行各种灵活管理操作,常见的操作有删除不必要敏感数据,添加,编辑或修改指标标签纸或者标签格式等。
Prometheus对数据处理的流程
- 1.服务发现: 支持静态发现和动态发现,主要是找打到对应的target。
- 2.配置: 加载"scheme",“address”,"metrics_path"等信息。
- 3.重新标记: relabel_configs,主要针对要监控的target的标签。
- 4.抓取: 开始抓取数据。
- 5.重新标记: metric_relabel_configs,主要针对已经抓取回来的metrics的标签的操作。
为targets自定义打标签案例
vim /app/tools/prometheus-2.53.4.linux-amd64/prometheus.yml- job_name: "node-exporter-lable"static_configs:- targets: ["10.0.0.41:9100","10.0.0.42:9100","10.0.0.43:9100"]labels:auther: zhuhaha: hahahaxixi: xixixi
查看webUI
https://10.0.0.31:9090/targets?search=
🌟relabel_configs替换标签replace案例
修改prometheus的配置文件
vim /app/tools/prometheus-2.53.4.linux-amd64/prometheus.yml
...- job_name: "node-exporter-relabel_configs"static_configs:- targets: ["10.0.0.41:9100","10.0.0.42:9100","10.0.0.43:9100"]labels:auther: zhublog: zhubaolin.blog.csdn.netrelabel_configs:# 指定正则表达式匹配成功的label进行标签管理的列表- source_labels:- __scheme__- __address__- __metrics_path__# 表示source_labels对应Label的名称或值进行匹配此处指定的正则表达式。# 此处我们对数据进行了分组,后面replacement会使用"${1}"和"$2"进行引用。regex: "(http|https)(.*)" # 指定用于连接多个source_labels为一个字符串的分隔符,若不指定,默认为分号";"。# 假设源数据如下:# 	__address__="10.0.0.31:9100"#		__metrics_path__="/metrics"#		__scheme__="http"# 拼接后操作的结果为: "http10.0.0.31:9100/metrics"separator: ""# 在进行Label替换的时候,可以将原来的source_labels替换为指定修改后的label。# 将来会新加一个标签,标签的名称为"prometheus_ep",值为replacement的数据。target_label: "prometheus_ep"# 替换标签时,将target_label对应的值进行修改成此处的值replacement: "${1}://${2}"# 对Label或指标进行管理,场景的动作有replace|keep|drop|lablemap|labeldrop等,默认为replace。action: replace
热加载配置
curl -X POST https://10.0.0.31:9090/-/reload -k -u k8s:zhubl
webUI验证
https://10.0.0.31:9090/targets?search=
总结
相对来说,relabel_configs和labels的作用类似,也是为实例打标签,只不过relabel_configs的功能性更强。我们可以基于标签来对监控指标进行过滤。
🌟relabel_configs新增标签映射labelmap案例
修改prometheus的配置文件
vim /app/tools/prometheus-2.53.4.linux-amd64/prometheus.yml- job_name: "node-exporter-relabel_configs-labeldrop"static_configs:- targets: ["10.0.0.31:9100","10.0.0.41:9100","10.0.0.42:9100","10.0.0.43:9100"]relabel_configs:- regex: "(job|app)"replacement: "${1}_labelmap_kubernetes"action: labelmap- regex: "(job|app)"# 删除regex匹配到的标签action: labeldrop
热加载配置
curl -X POST https://10.0.0.31:9090/-/reload -k -u k8s:zhubl
webUI验证
https://10.0.0.31:9090/targets?search=
🌟metric_relabel_configs修改metric标签案例
修改prometheus的配置文件
vim /app/tools/prometheus-2.53.4.linux-amd64/prometheus.yml- job_name: "node-exporter-metric_relabel_configs"static_configs:- targets: ["10.0.0.31:9100","10.0.0.41:9100","10.0.0.42:9100","10.0.0.43:9100"]metric_relabel_configs:- source_labels:- __name__regex: "node_cpu_.*"action: drop
热加载配置
curl -X POST https://10.0.0.31:9090/-/reload -k -u k8s:zhubl
webUI验证
https://10.0.0.31:9090/targets?search=
🌟部署blackbox-exporter黑盒监控
blackbox-exporter概述
一般用于监控网站是否监控,端口是否存活,证书有效期等。
blackbox exporter支持基于HTTP, HTTPS, DNS, TCP, ICMP, gRPC协议来对目标节点进行监控。
比如基于http协议我们可以探测一个网站的返回状态码为200判读服务是否正常。
比如基于TCP协议我们可以探测一个主机端口是否监听。
比如基于ICMP协议来ping一个主机的连通性。
比如基于gRPC协议来调用接口并验证服务是否正常工作。
比如基于DNS协议可以来检测域名解析。
下载blackbox-exporter
wget https://github.com/prometheus/blackbox_exporter/releases/download/v0.27.0/blackbox_exporter-0.27.0.linux-amd64.tar.gz
解压软件包
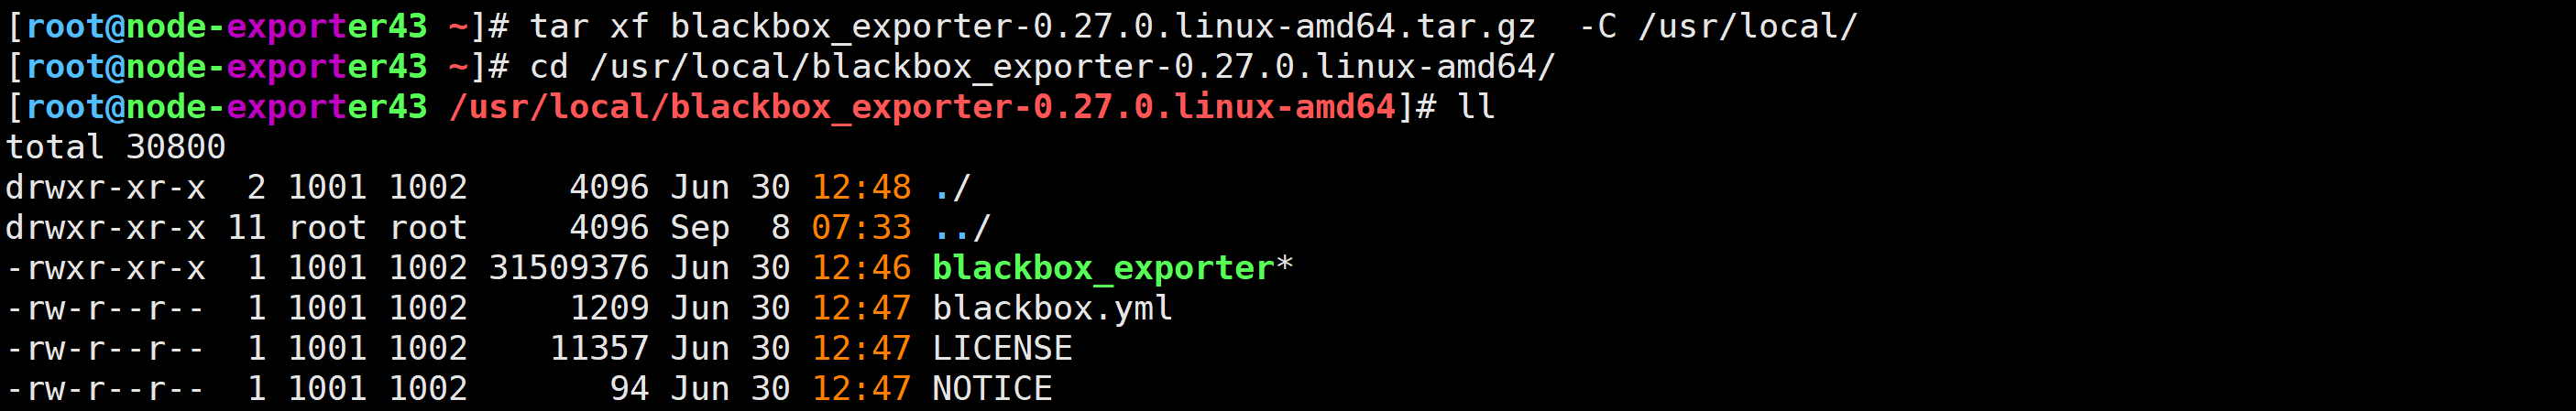
[root@node-exporter43 ~]# tar xf blackbox_exporter-0.27.0.linux-amd64.tar.gz  -C /usr/local/
[root@node-exporter43 ~]# cd /usr/local/blackbox_exporter-0.27.0.linux-amd64/
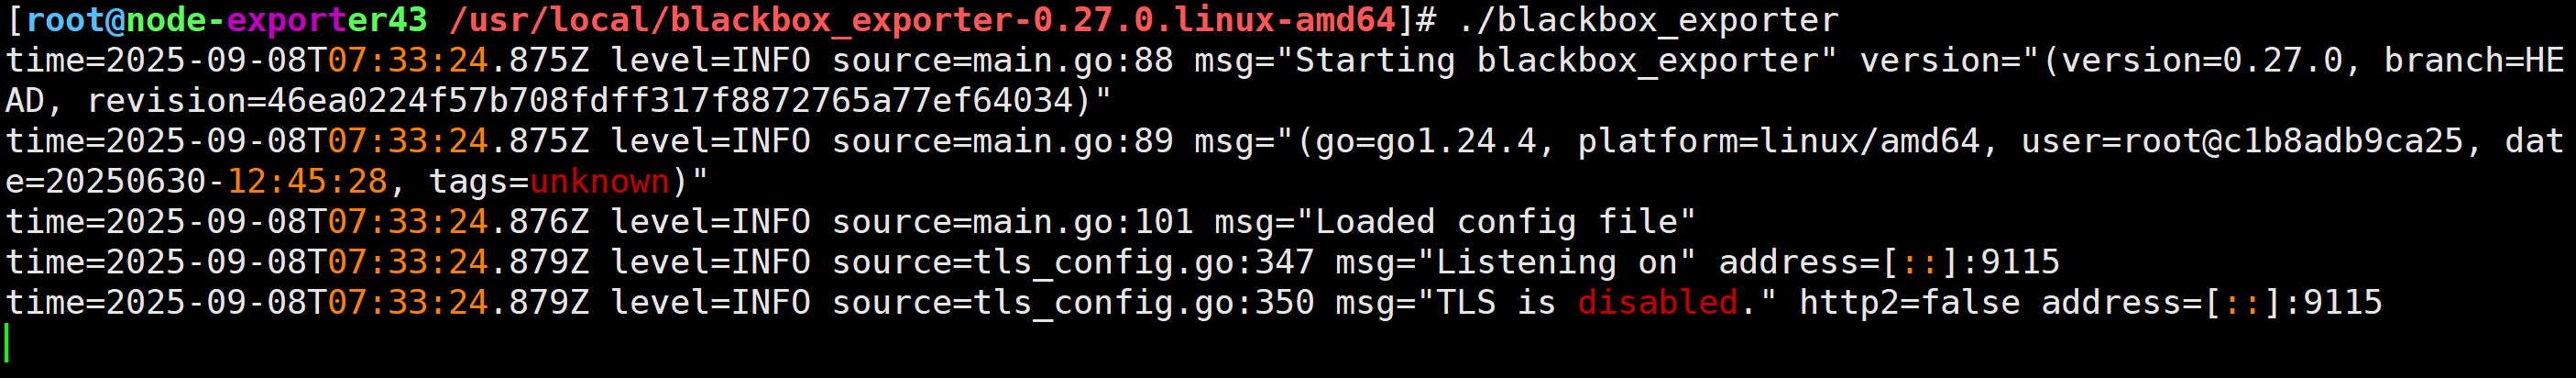
启动blackbox服务
[root@node-exporter43 blackbox_exporter-0.27.0.linux-amd64]# ./blackbox_exporter
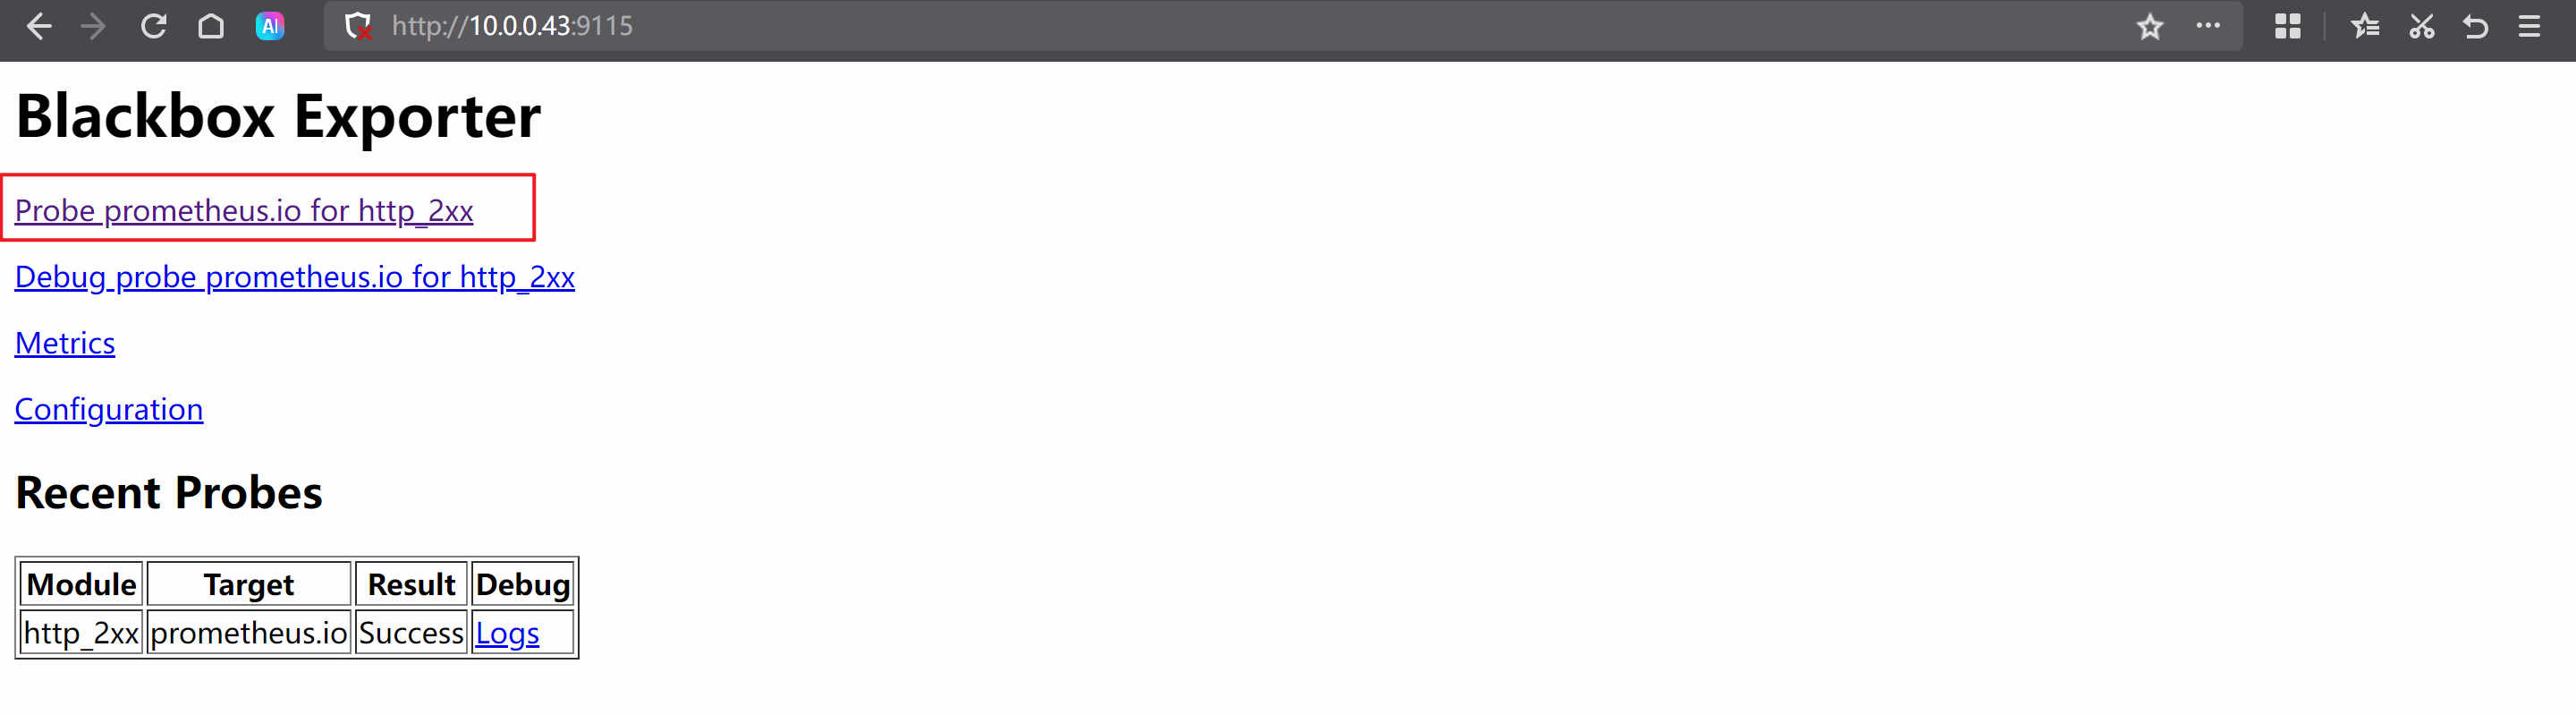
访问blackbox的WebUI
http://10.0.0.43:9115/
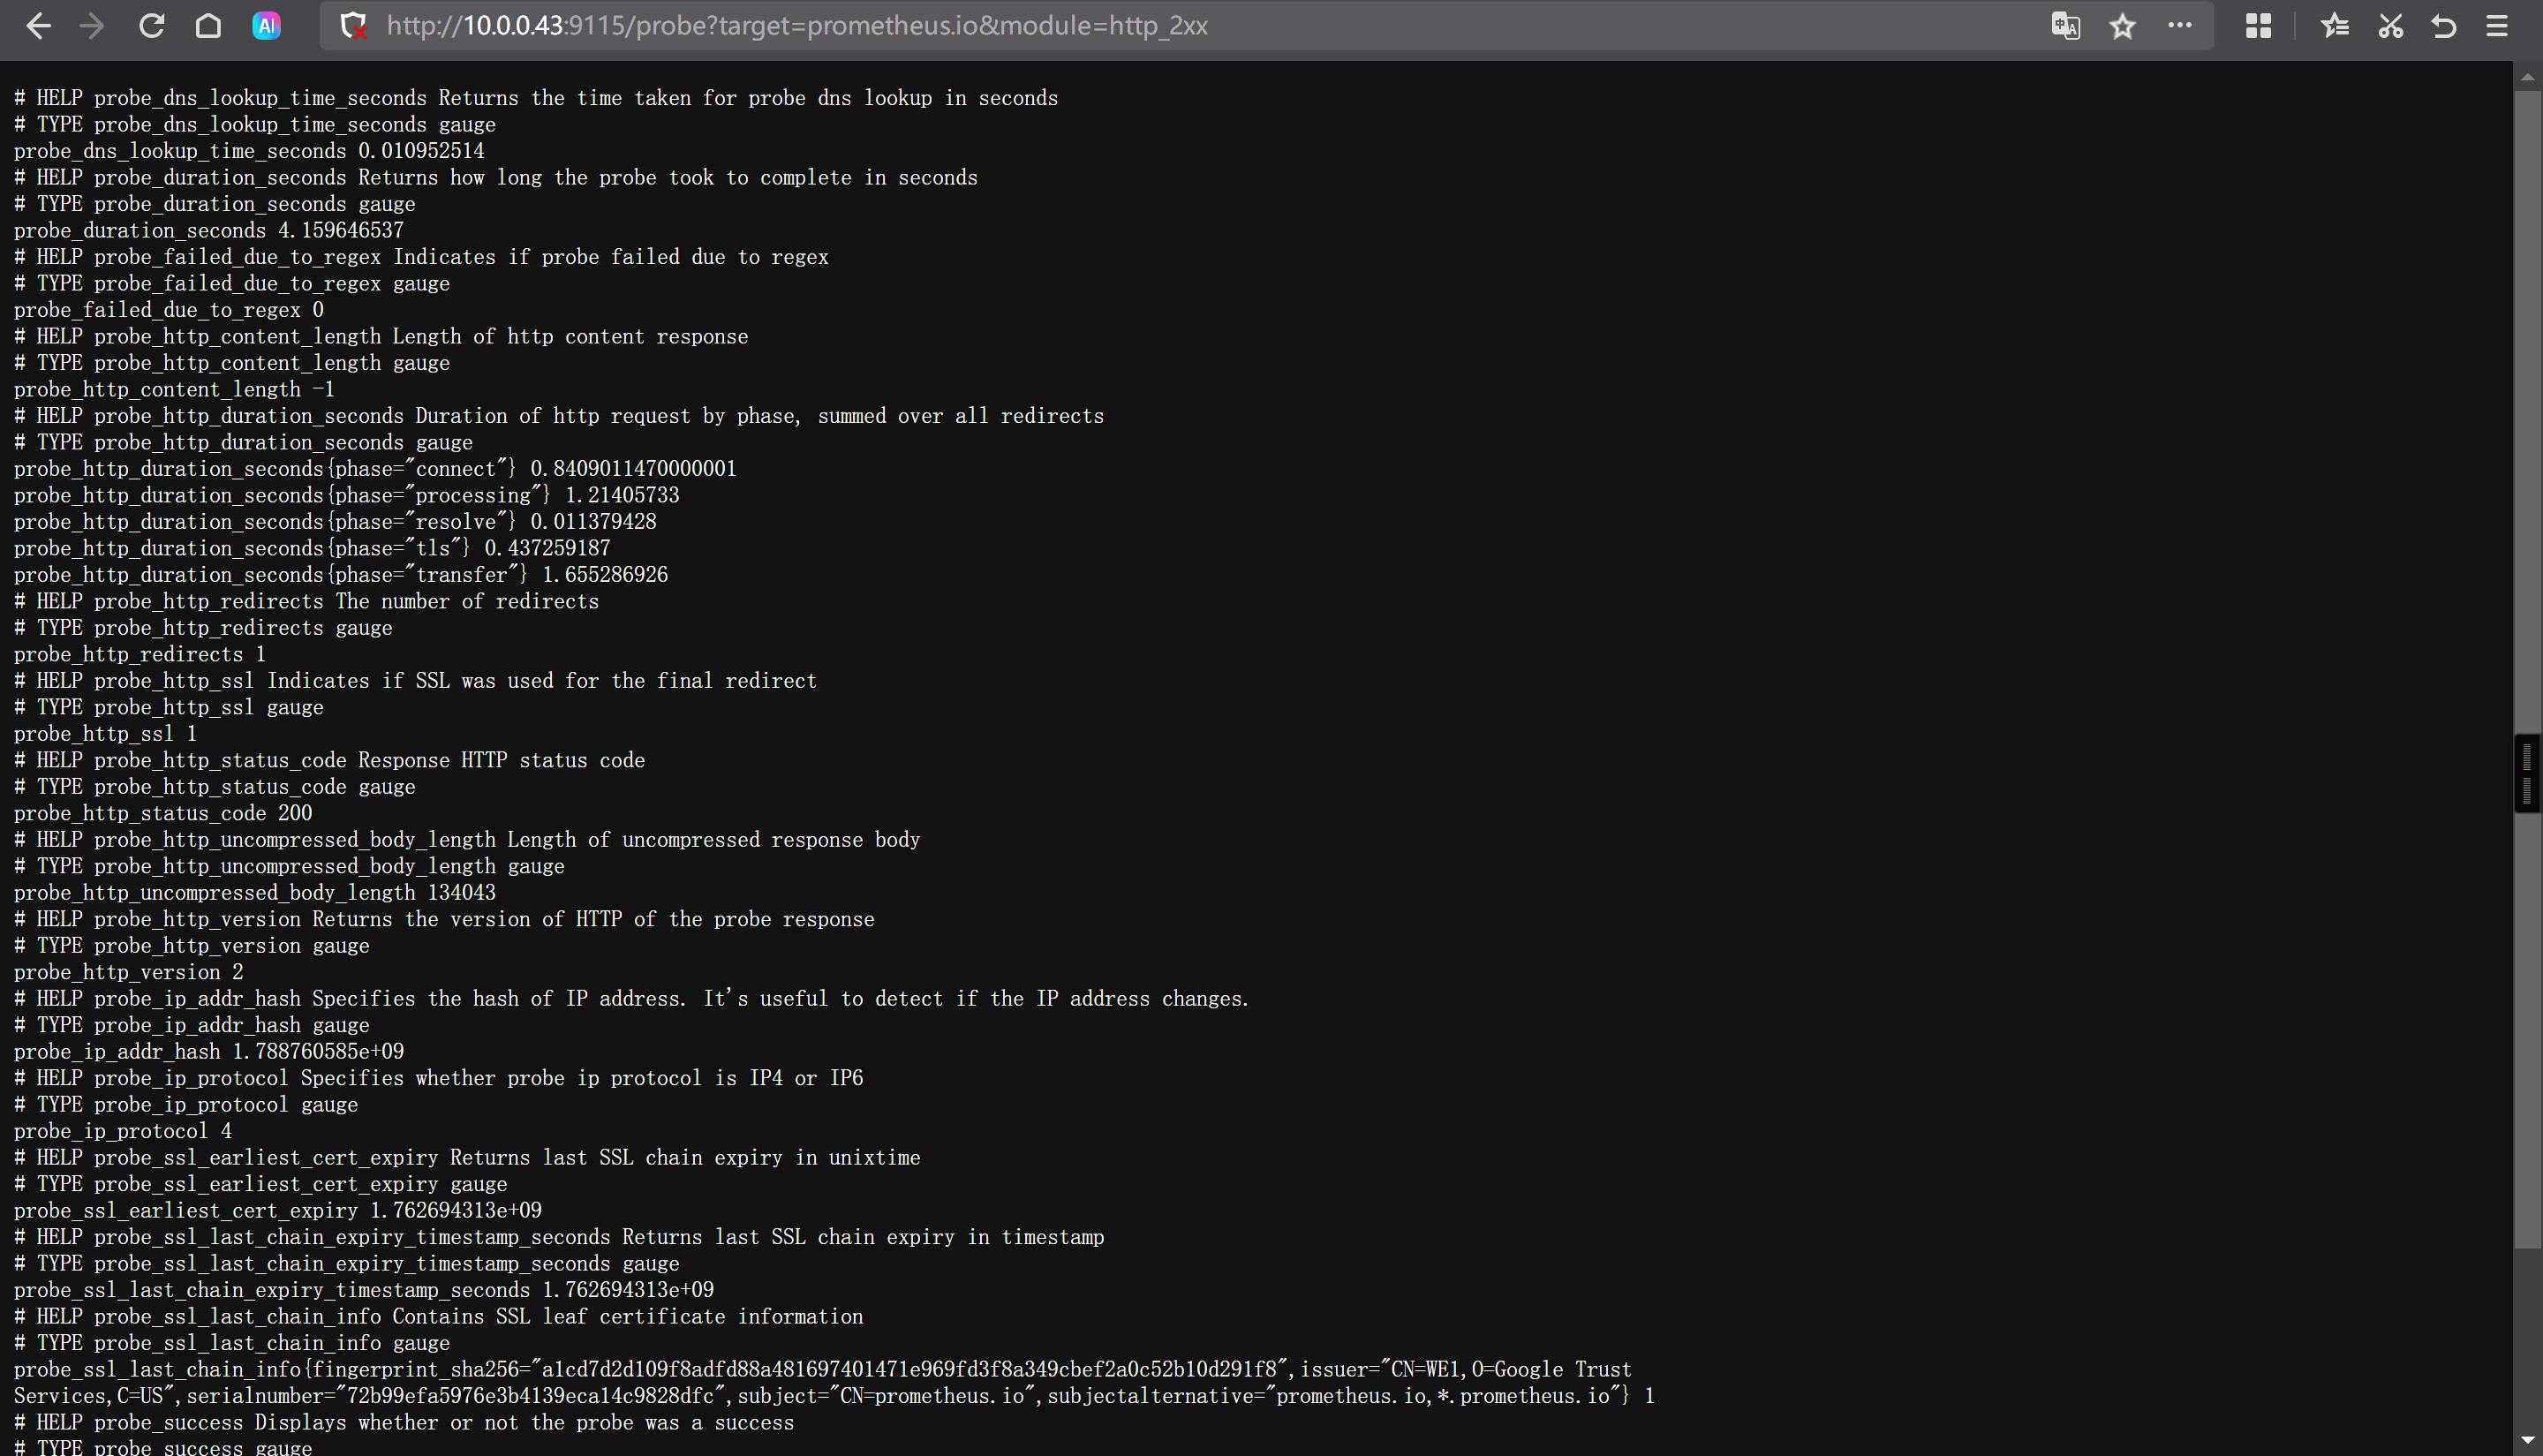
http://10.0.0.43:9115/probe?target=prometheus.io&module=http_2xx
🌟Prometheus server整合blackbox实现网站监控
修改Prometheus的配置文件
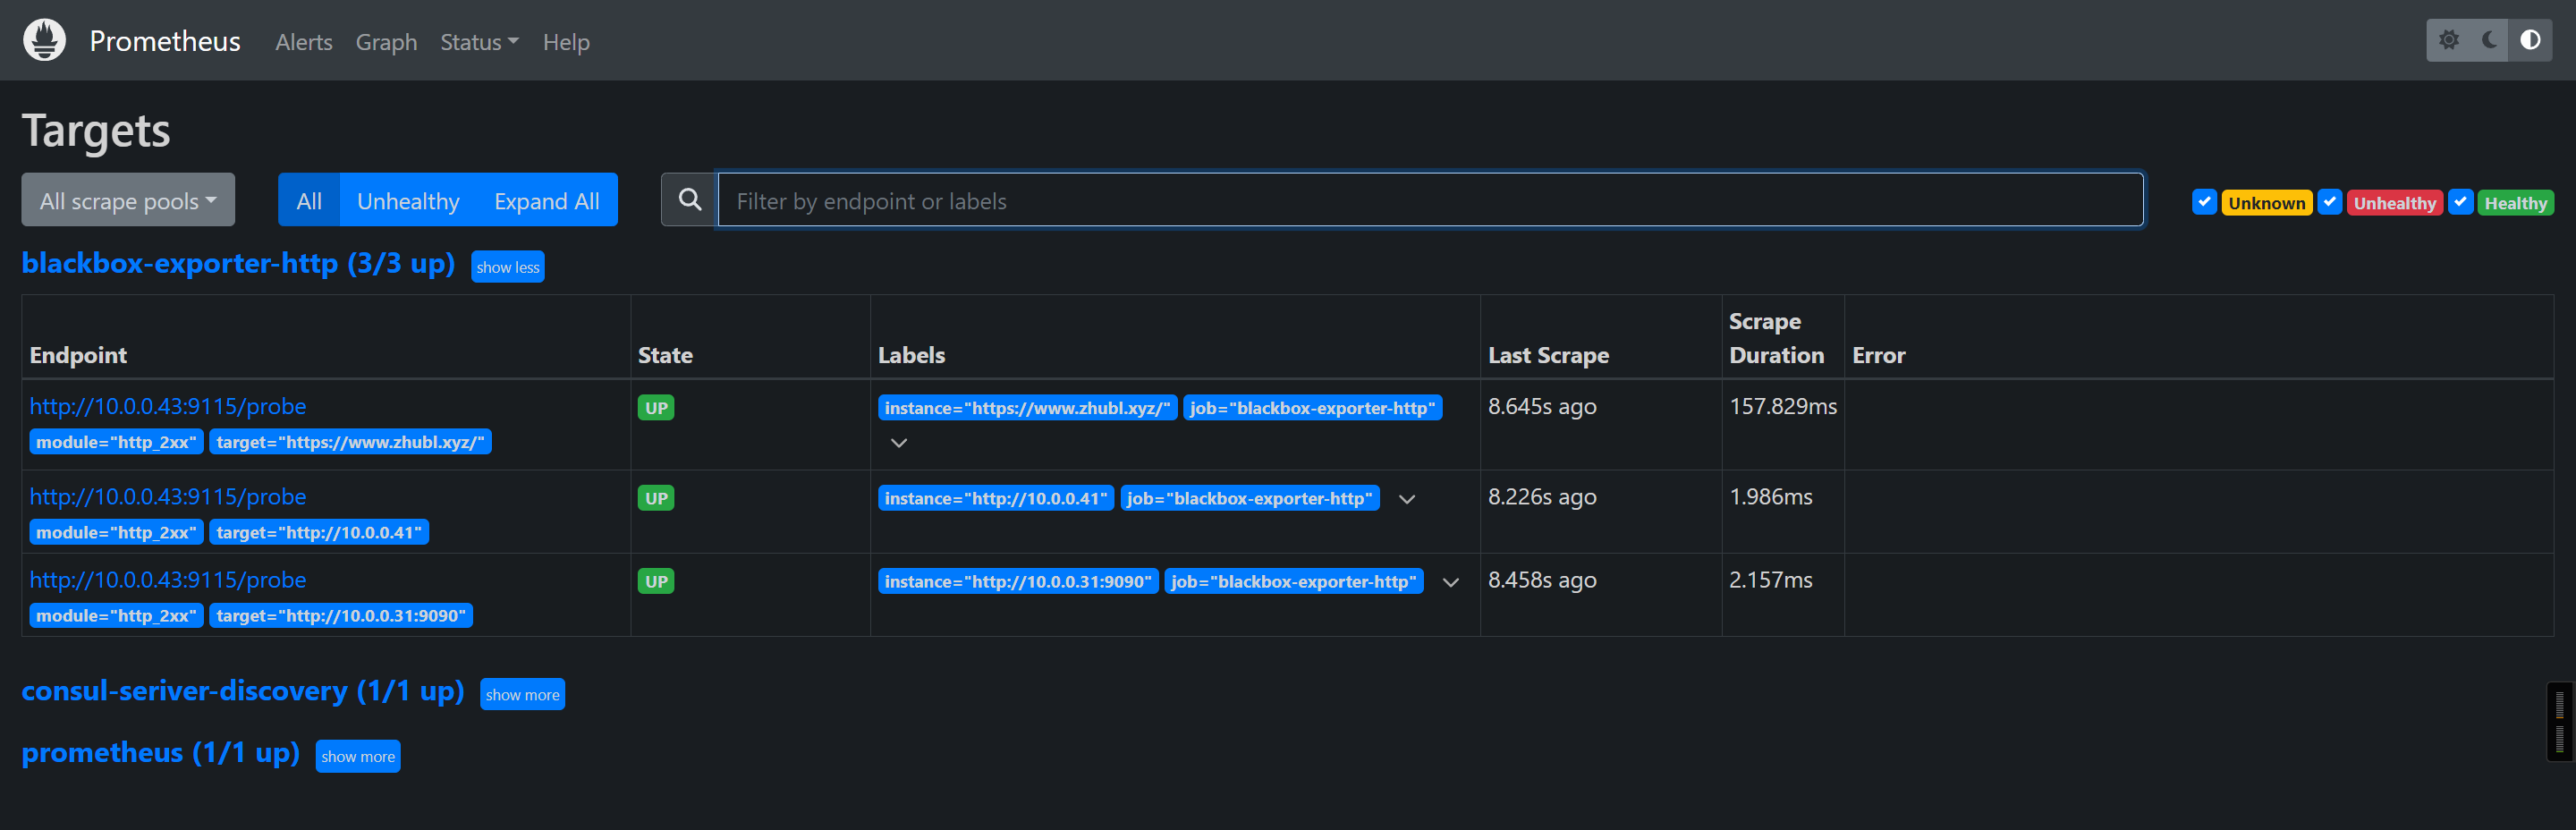
vim /app/tools/prometheus-2.53.4.linux-amd64/prometheus.yml# 指定作业的名称,生成环境中,通常是指一类业务的分组配置。- job_name: 'blackbox-exporter-http'# 修改访问路径,若不修改,默认值为"/metrics"metrics_path: /probe# 配置URL的相关参数params:# 此处表示使用的是blackbox的http模块,从而判断相应的返回状态码是否为200module: [http_2xx]# 静态配置,需要手动指定监控目标static_configs:# 需要监控的目标- targets:# 支持https协议- https://www.zhubl.xyz/# 支持http协议- http://10.0.0.41# 支持http协议和自定义端口- http://10.0.0.31:9090# 对目标节点进行重新打标签配置relabel_configs:# 指定源标签,此处的"__address__"表示内置的标签,存储的是被监控目标的IP地址- source_labels: [__address__]# 指定目标标签,其实就是在"Endpoint"中加了一个target字段(用于指定监控目标),target_label: __param_target# 指定需要执行的动作,默认值为"replace",常用的动作有: replace, keep, and drop。# 但官方支持十几种动作: https://prometheus.io/docs/prometheus/2.45/configuration/configuration/# 将"__address__"传递给target字段。action: replace- source_labels: [__param_target]target_label: instance- target_label: __address__# 指定要替换的值,此处我指定为blackbox exporter的主机地址replacement: 10.0.0.43:9115
热加载配置
curl -X POST https://10.0.0.31:9090/-/reload -k -u k8s:zhubl
验证webUI
https://10.0.0.31:9090/targets?search=
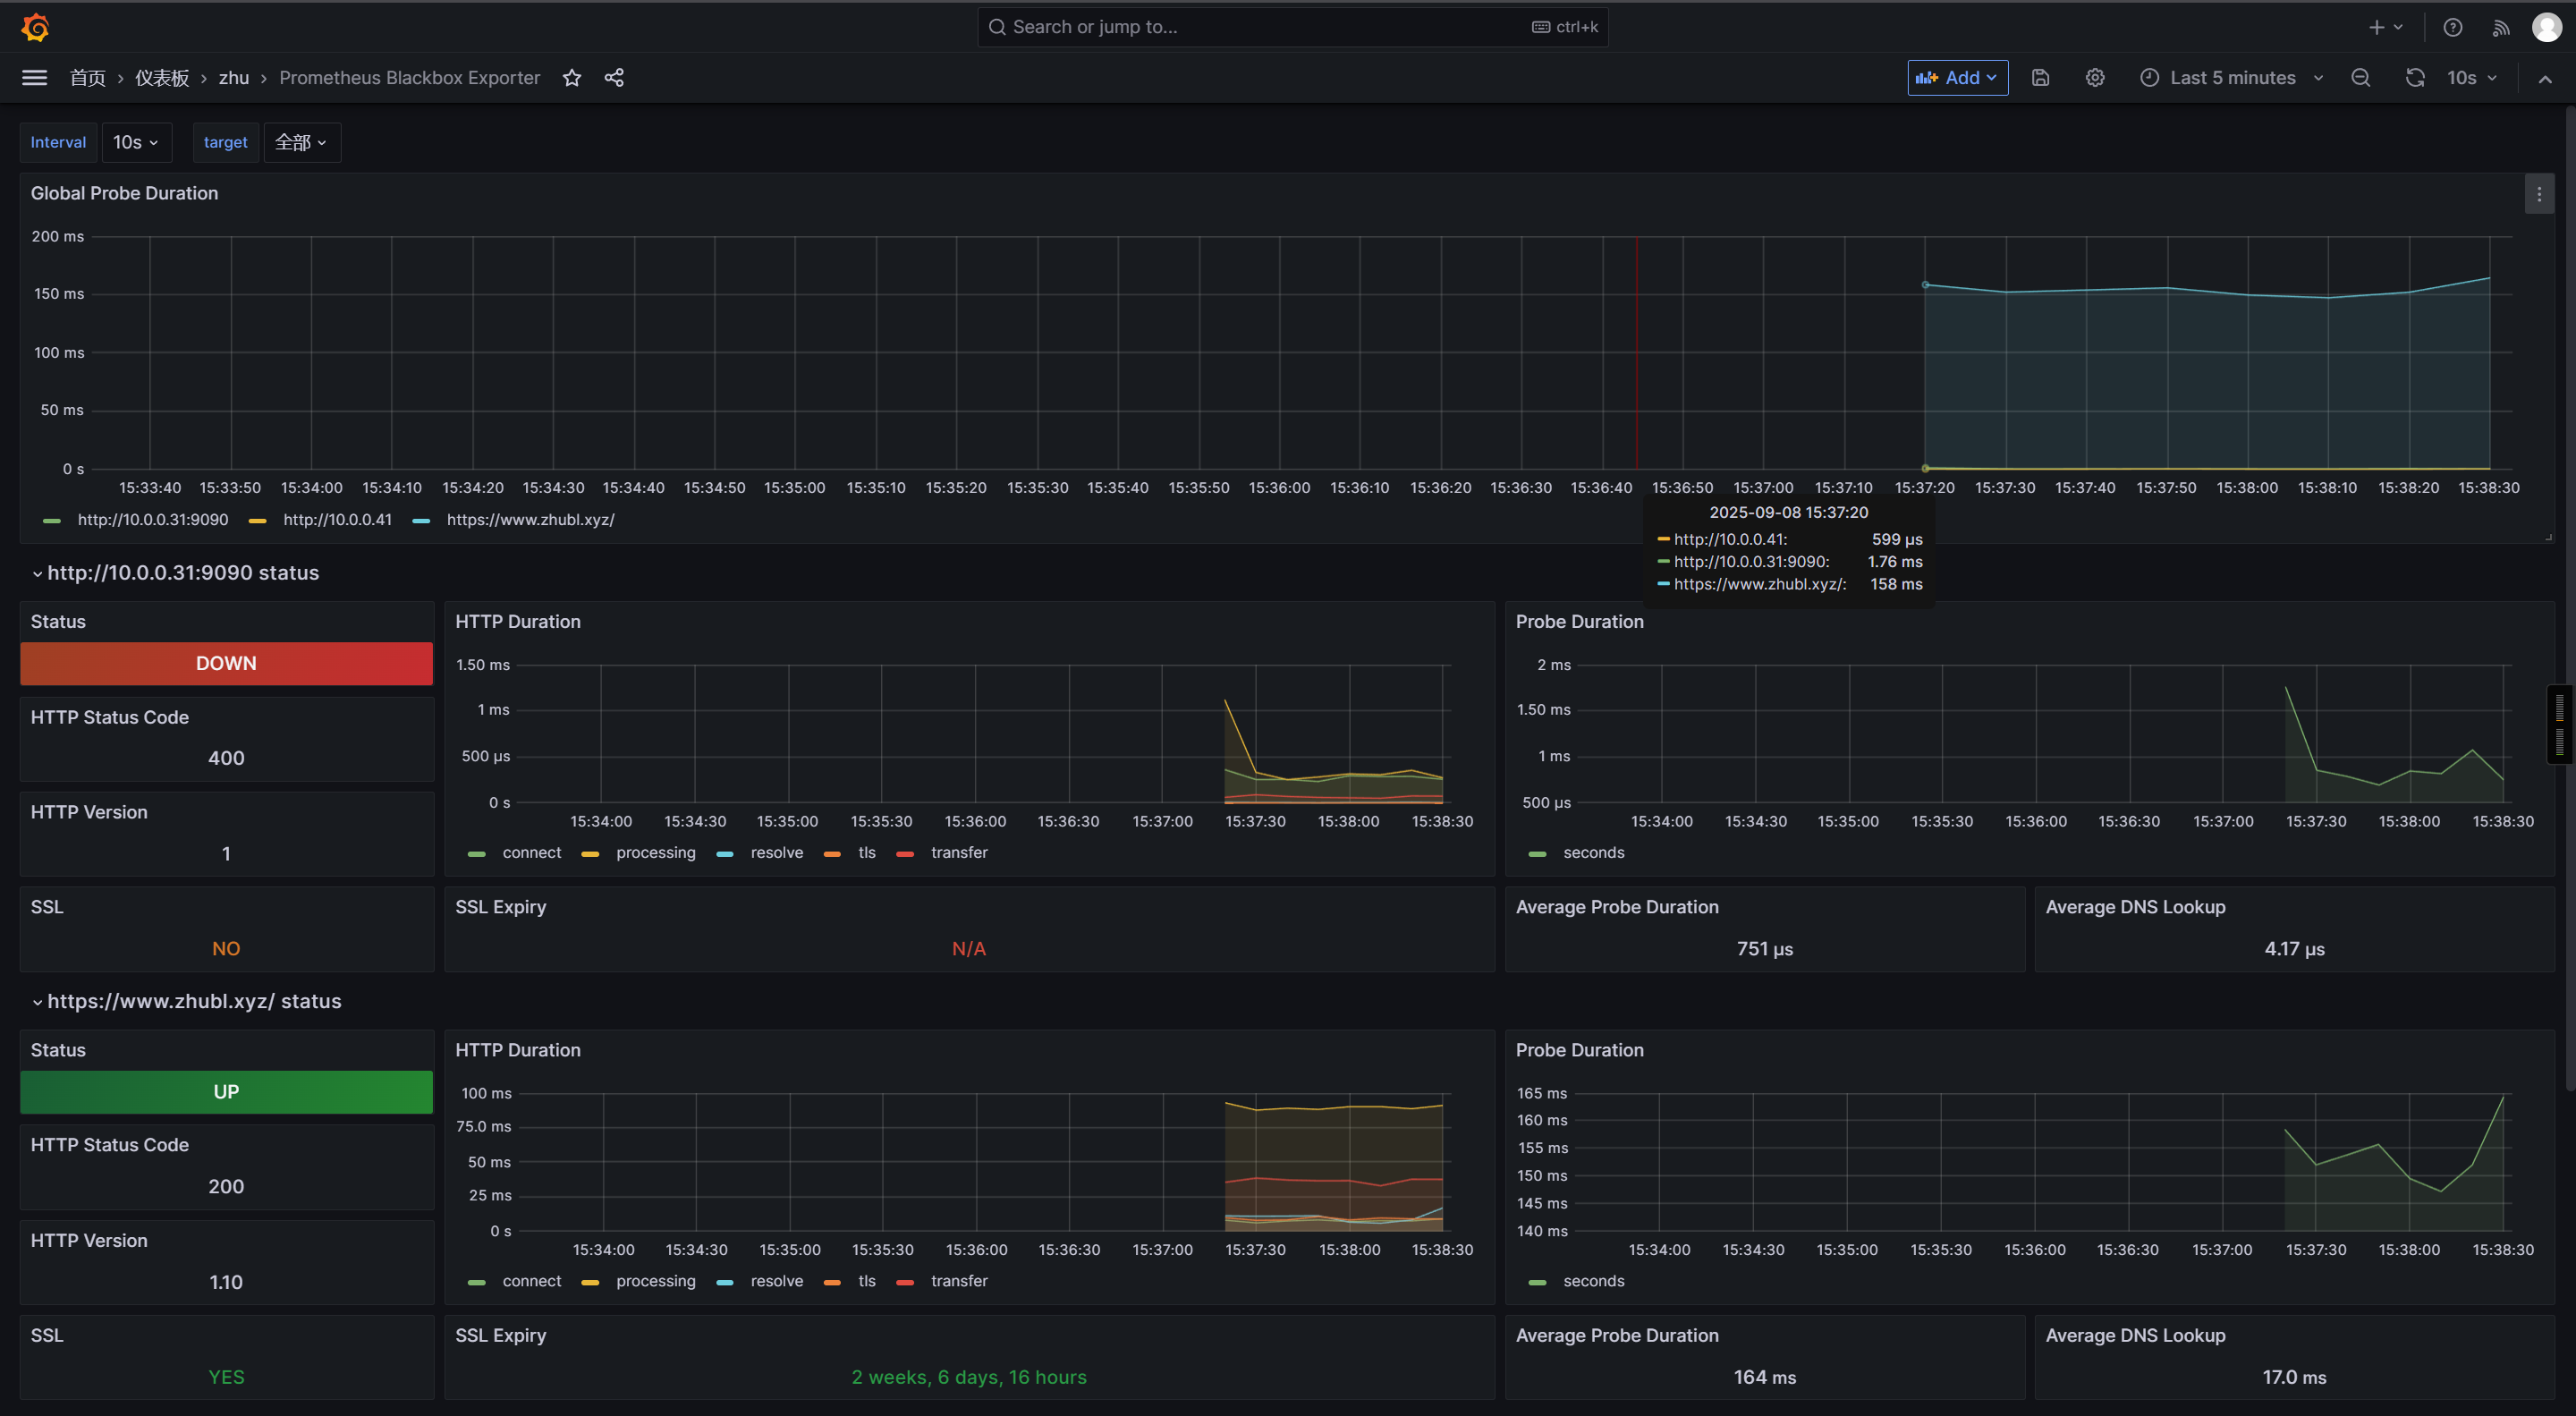
导入grafana的模板ID
7587
13659
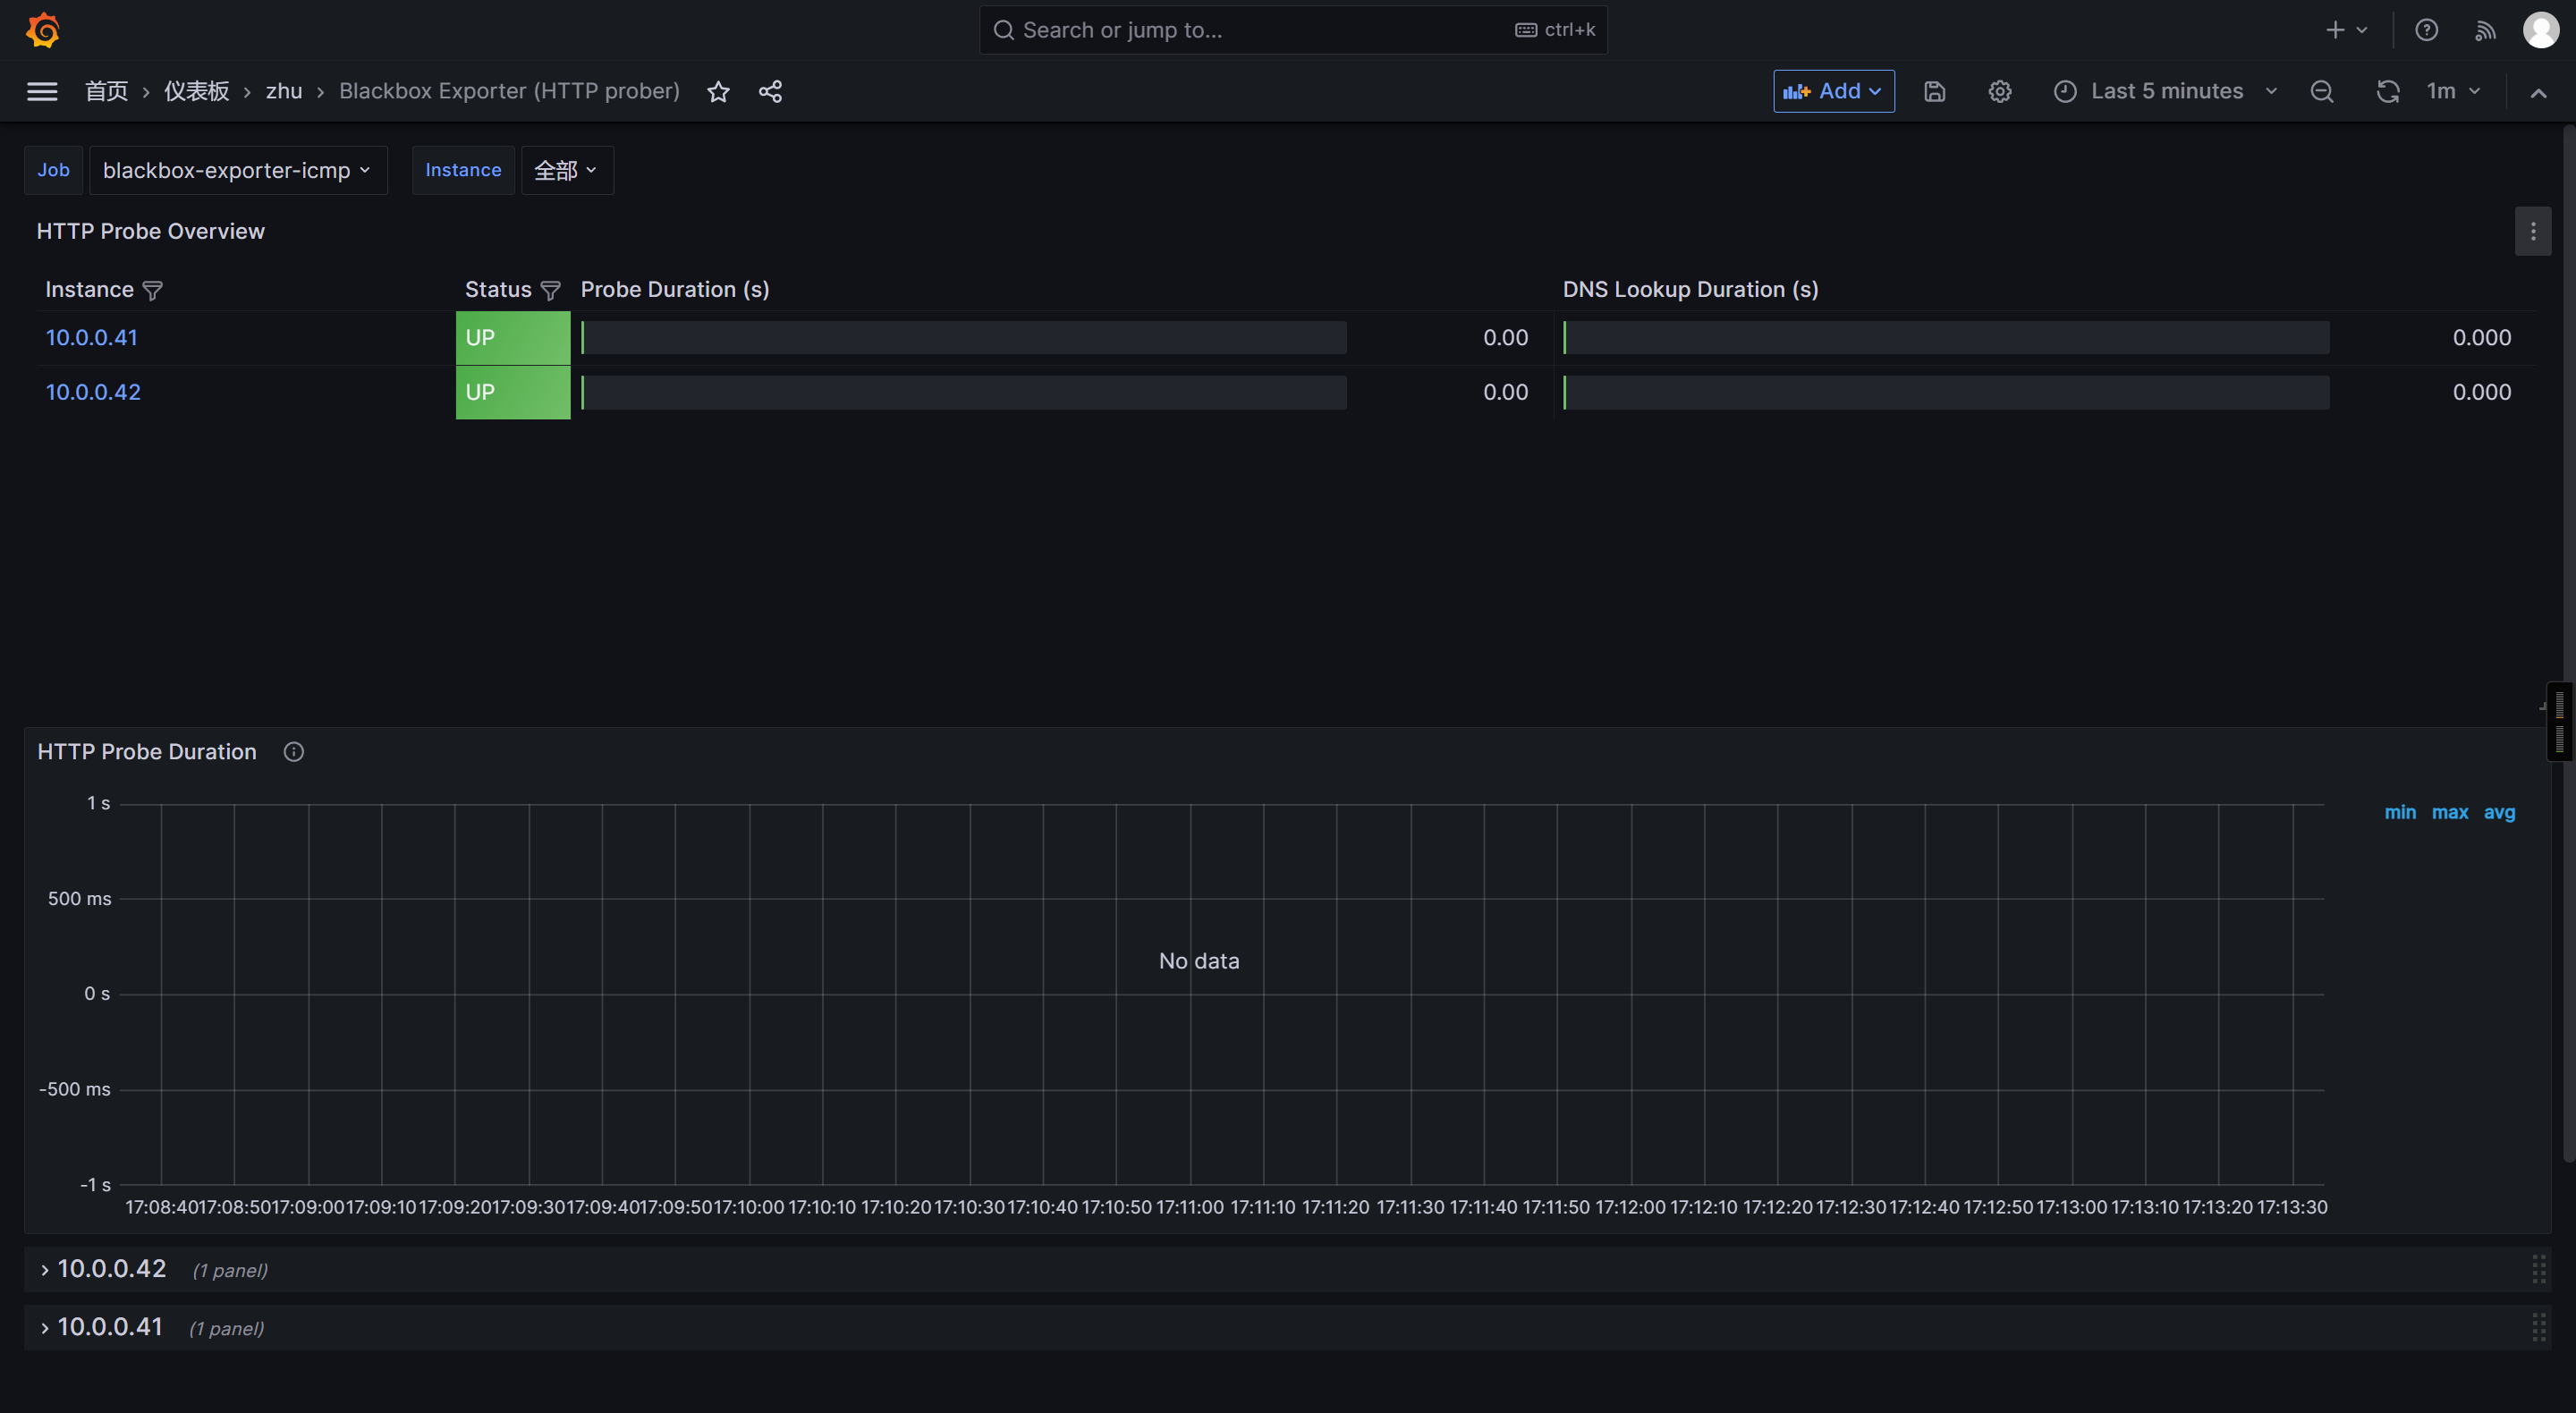
🌟prometheus基于blackbox的ICMP监控目标主机是否存活
修改Prometheus配置文件
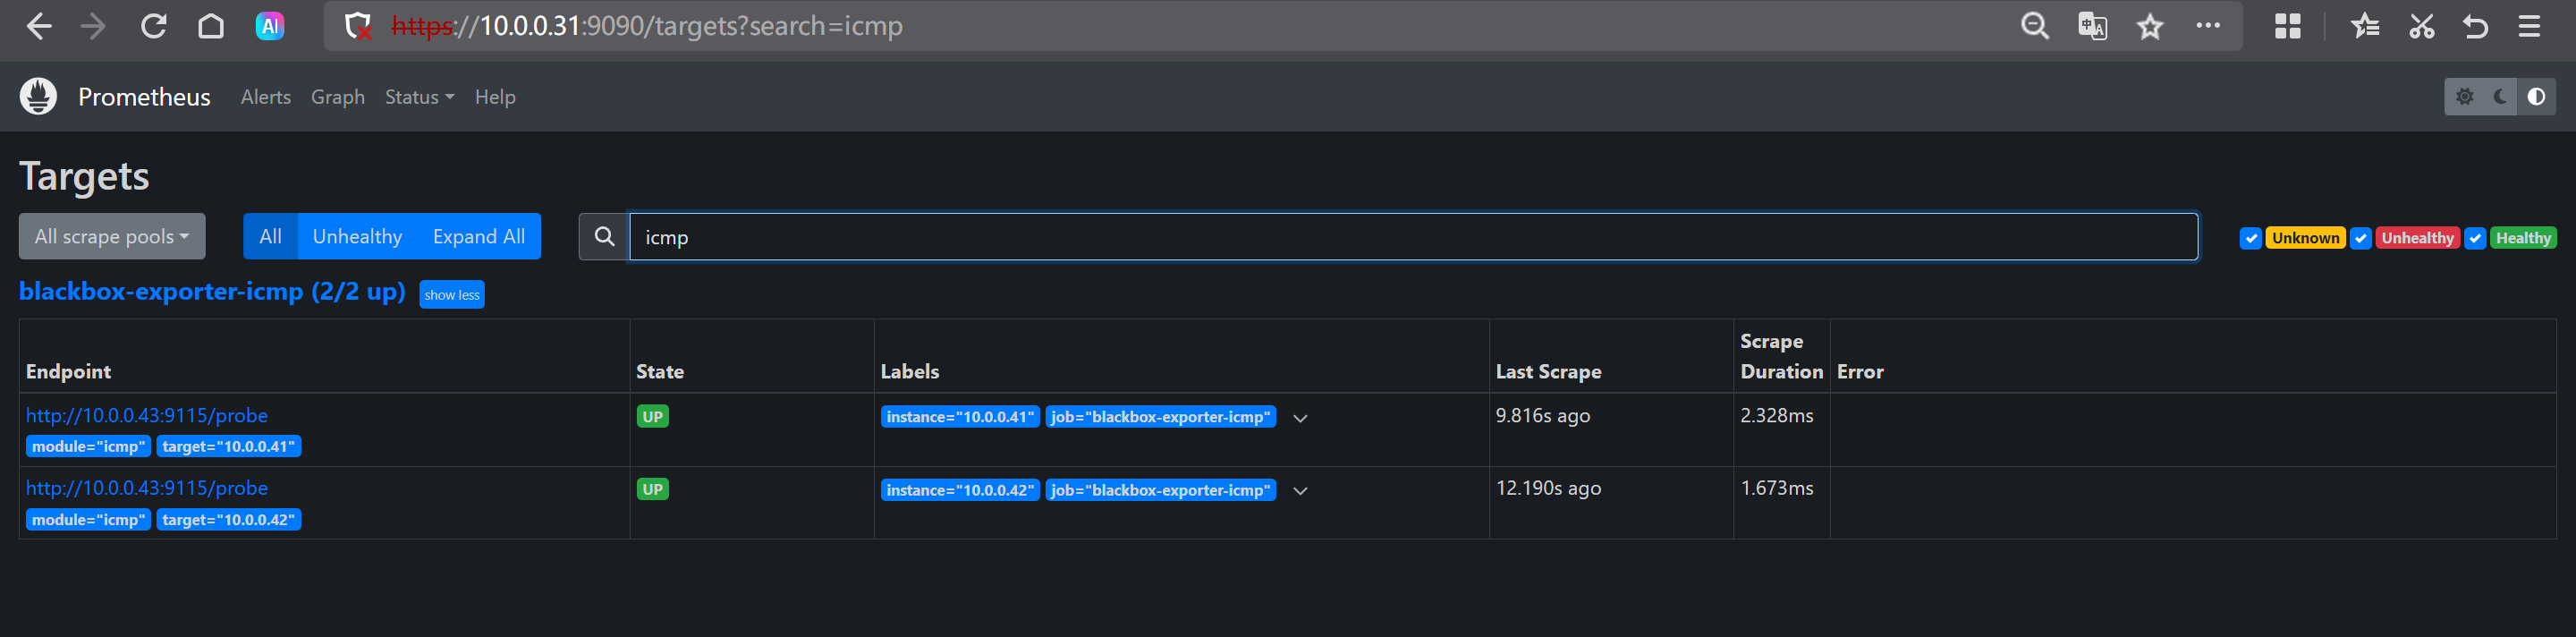
vim /app/tools/prometheus-2.53.4.linux-amd64/prometheus.yml- job_name: 'blackbox-exporter-icmp'metrics_path: /probeparams:# 如果不指定模块,则默认类型为"http_2xx",不能乱写!乱写监控不到服务啦!module: [icmp]static_configs:- targets:- 10.0.0.41- 10.0.0.42relabel_configs:- source_labels: [__address__]target_label: __param_target- source_labels: [__param_target]# 指定注意的是,如果instance不修改,则instance和"__address__"的值相同# target_label: iptarget_label: instance- target_label: __address__replacement: 10.0.0.43:9115
检查配置文件是否正确
cd /app/tools/prometheus-2.53.4.linux-amd64/
./promtool check config prometheus.yml
热加载配置
curl -X POST https://10.0.0.31:9090/-/reload -k -u k8s:zhubl
访问prometheus的WebUI
http://10.0.0.31:9090/targets
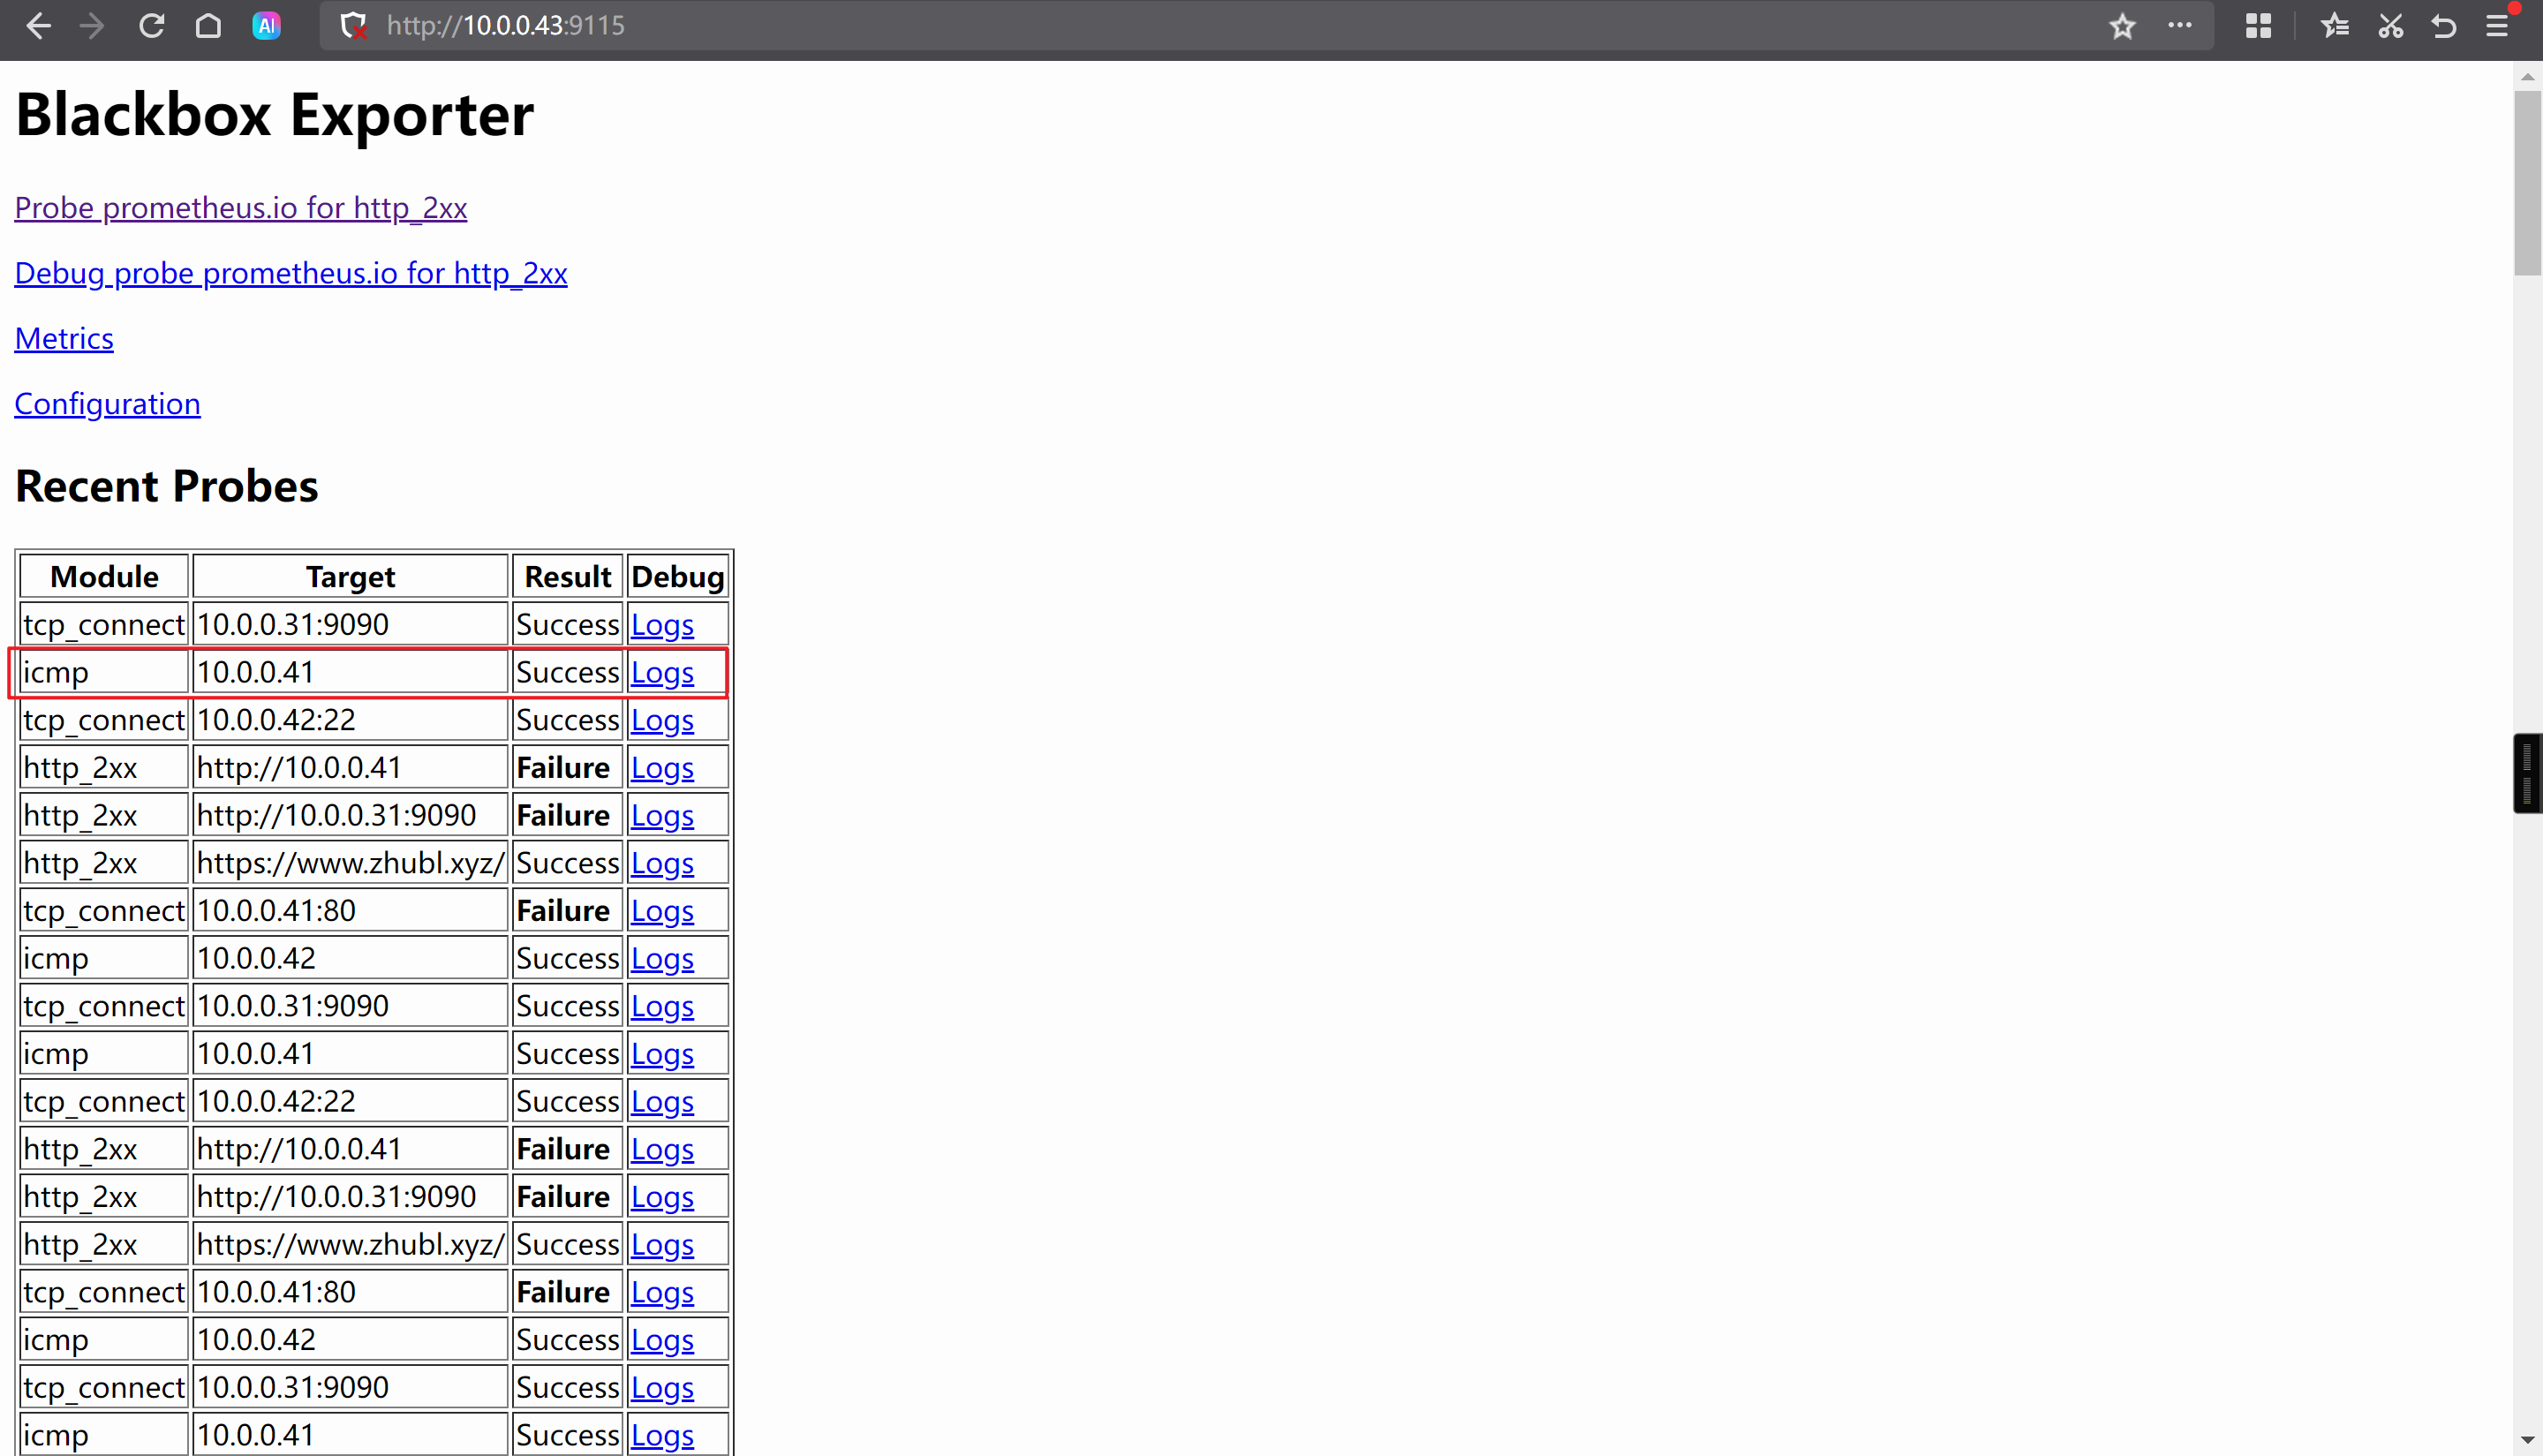
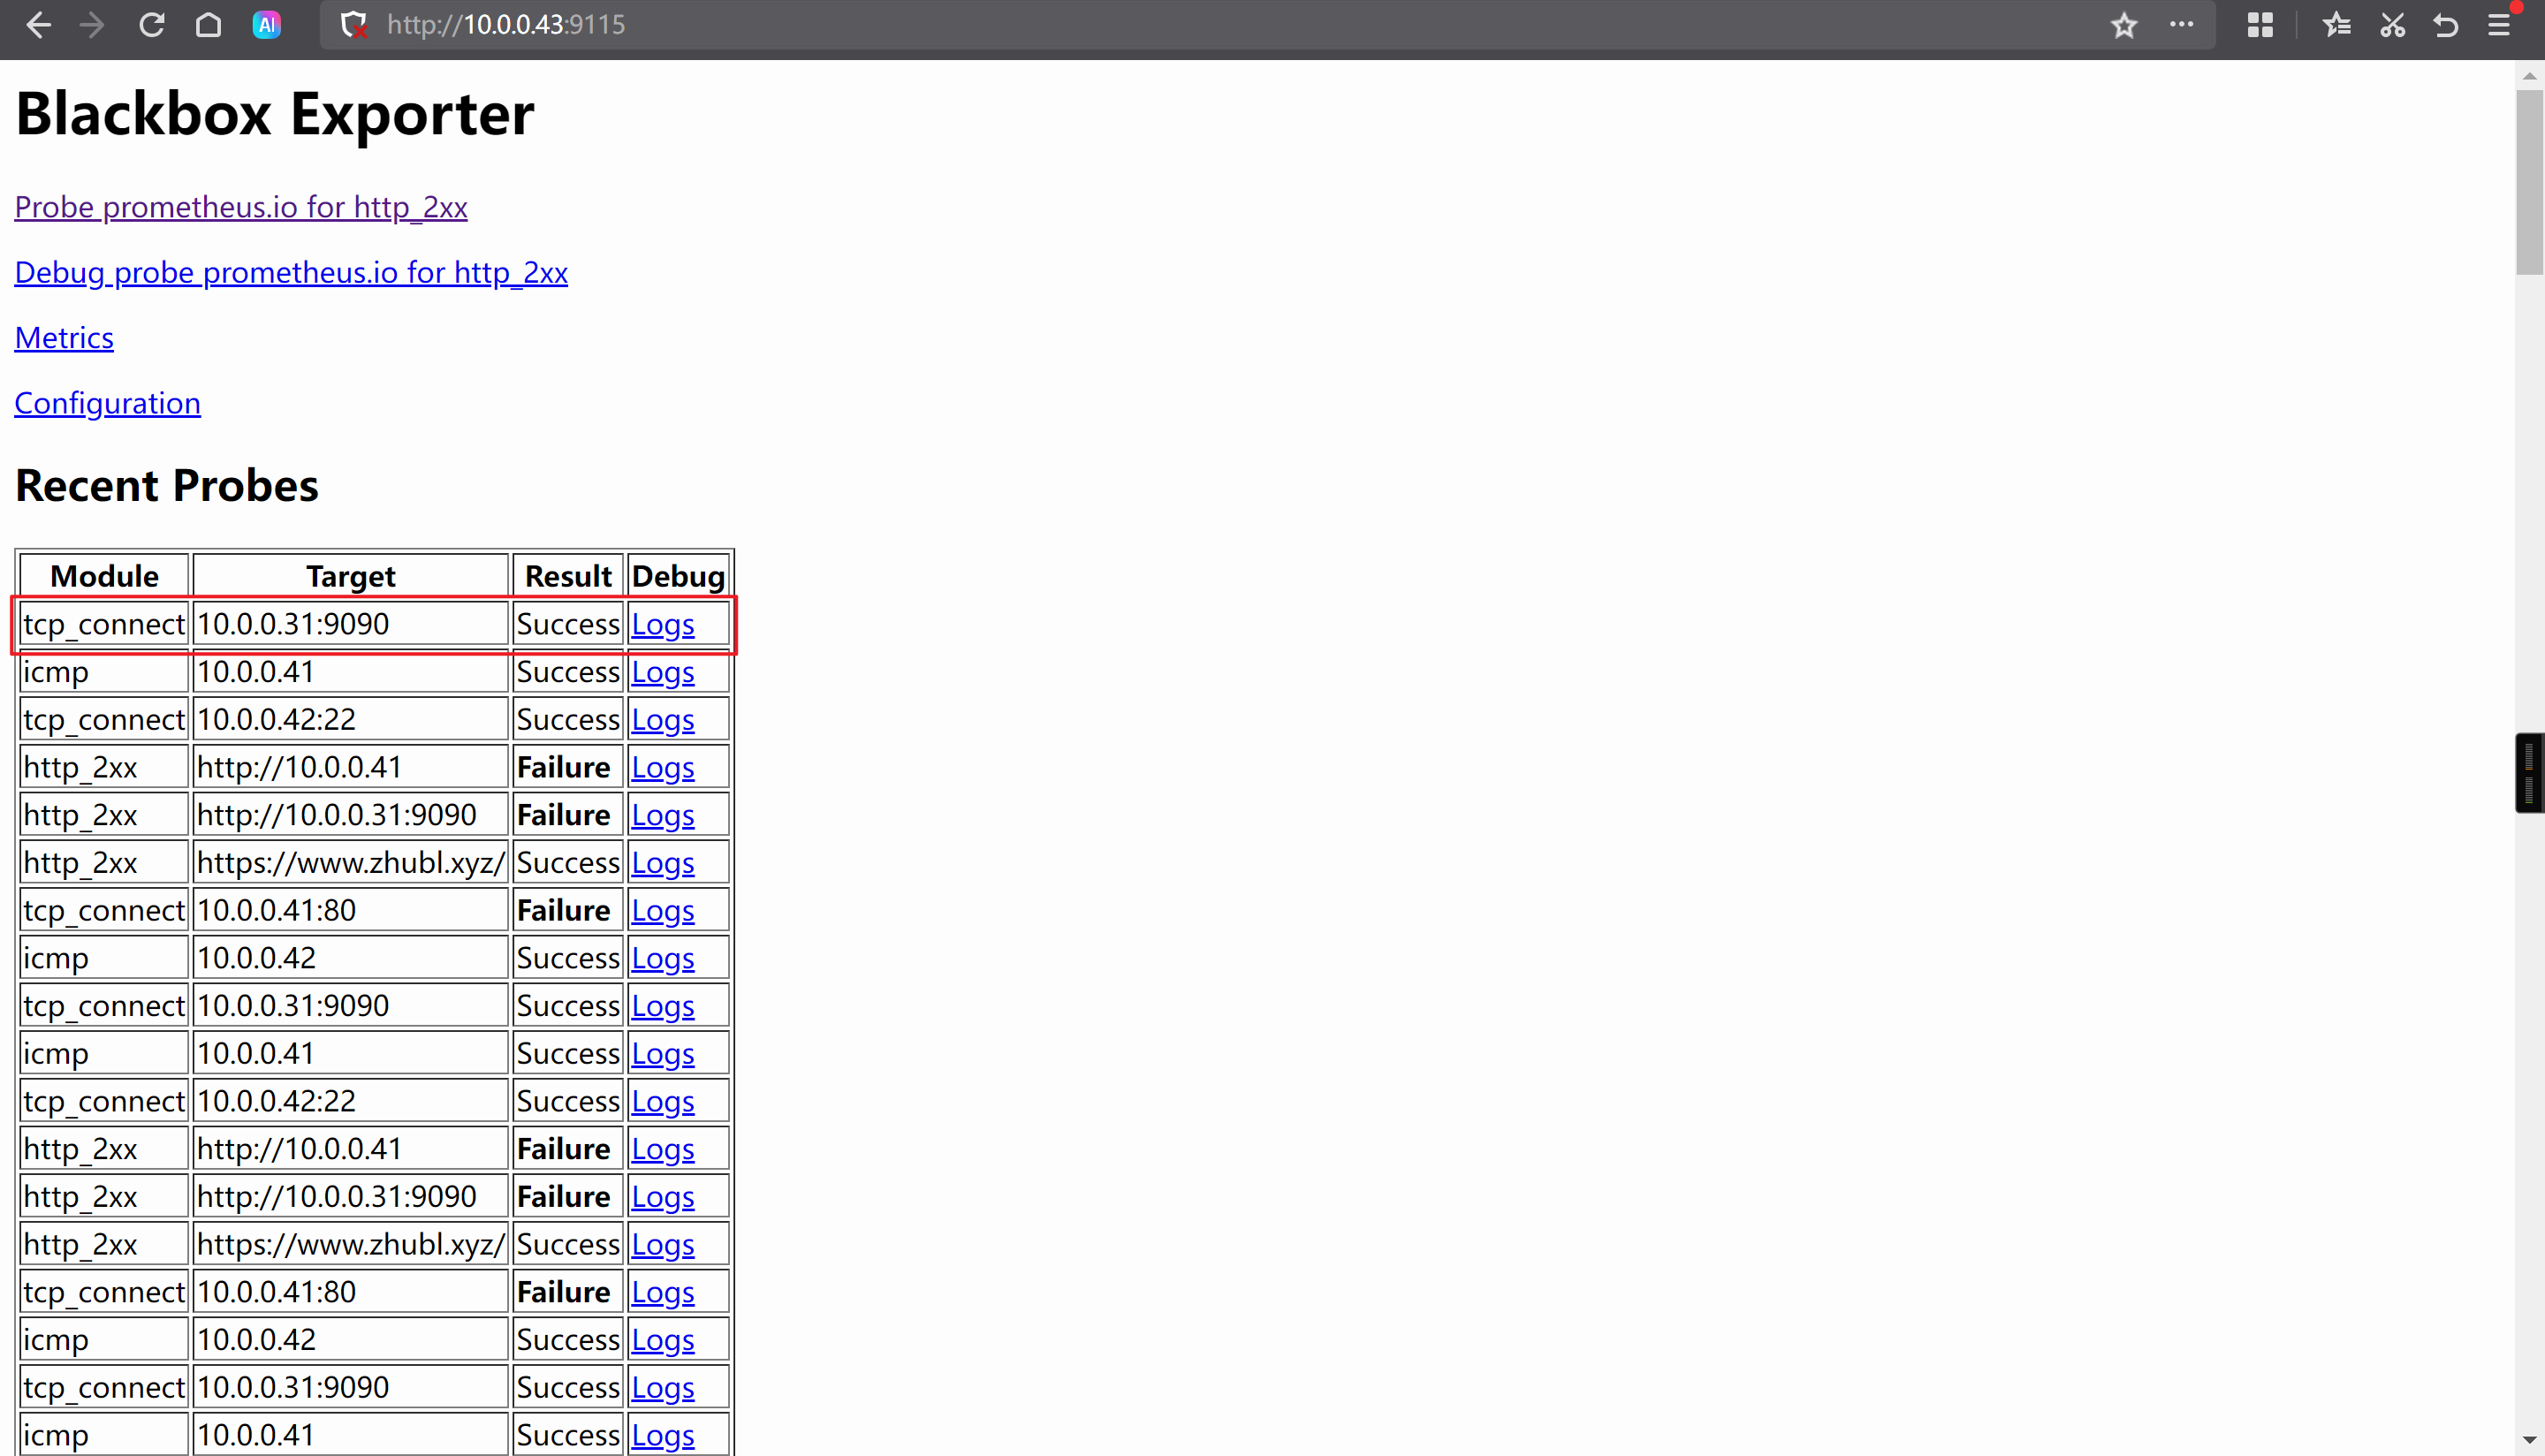
访问blackbox的WebUI
http://10.0.0.41:9115/
grafana过滤jobs数据
基于"blackbox-exporter-icmp"标签进行过滤。
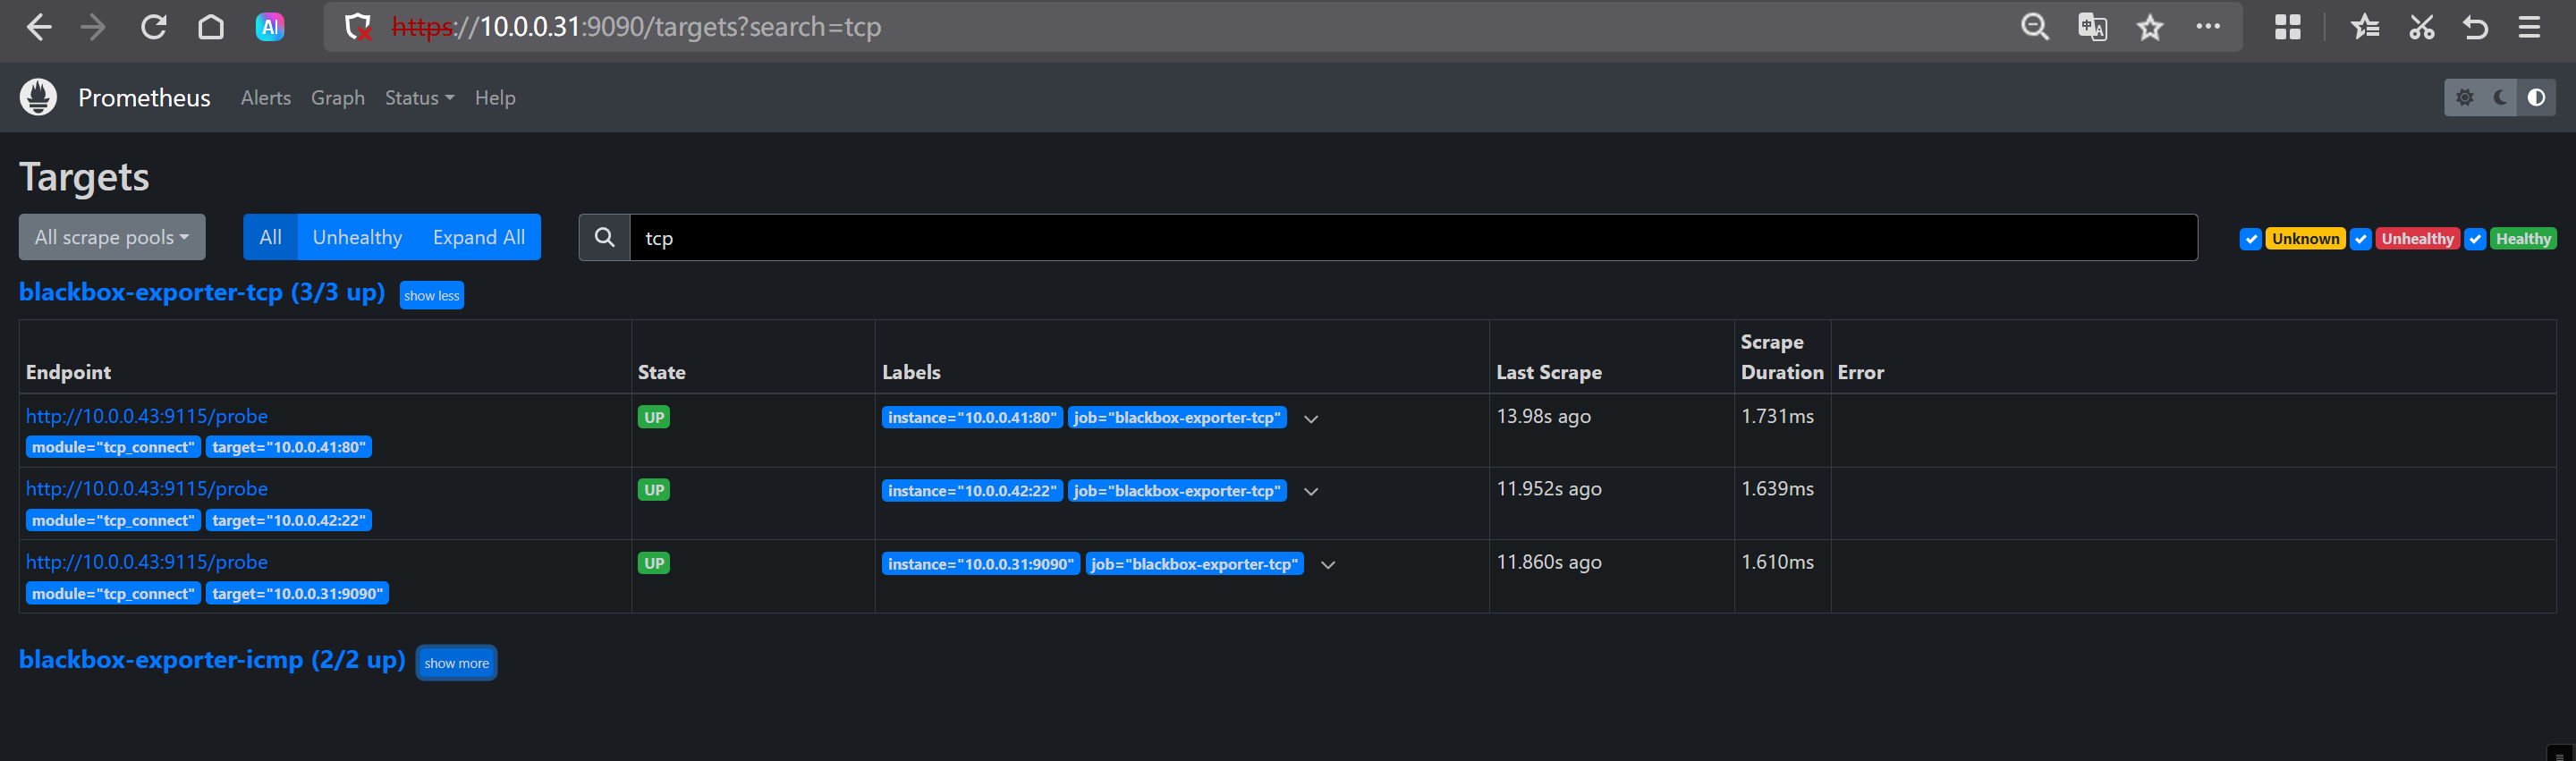
🌟prometheus基于blackbox的TCP案例监控端口是否存活
修改Prometheus配置文件
vim /app/tools/prometheus-2.53.4.linux-amd64/prometheus.yml- job_name: 'blackbox-exporter-tcp'metrics_path: /probeparams:module: [tcp_connect]static_configs:- targets:- 10.0.0.41:80- 10.0.0.42:22- 10.0.0.31:9090relabel_configs:- source_labels: [__address__]target_label: __param_target- source_labels: [__param_target]target_label: instance- target_label: __address__replacement: 10.0.0.43:9115
检查配置文件是否正确
./promtool check config prometheus.yml
热加载配置
curl -X POST https://10.0.0.31:9090/-/reload -k -u k8s:zhubl
访问prometheus的WebUI
http://10.0.0.31:9090/targets
访问blackbox exporter的WebUI
http://10.0.0.41:9115/
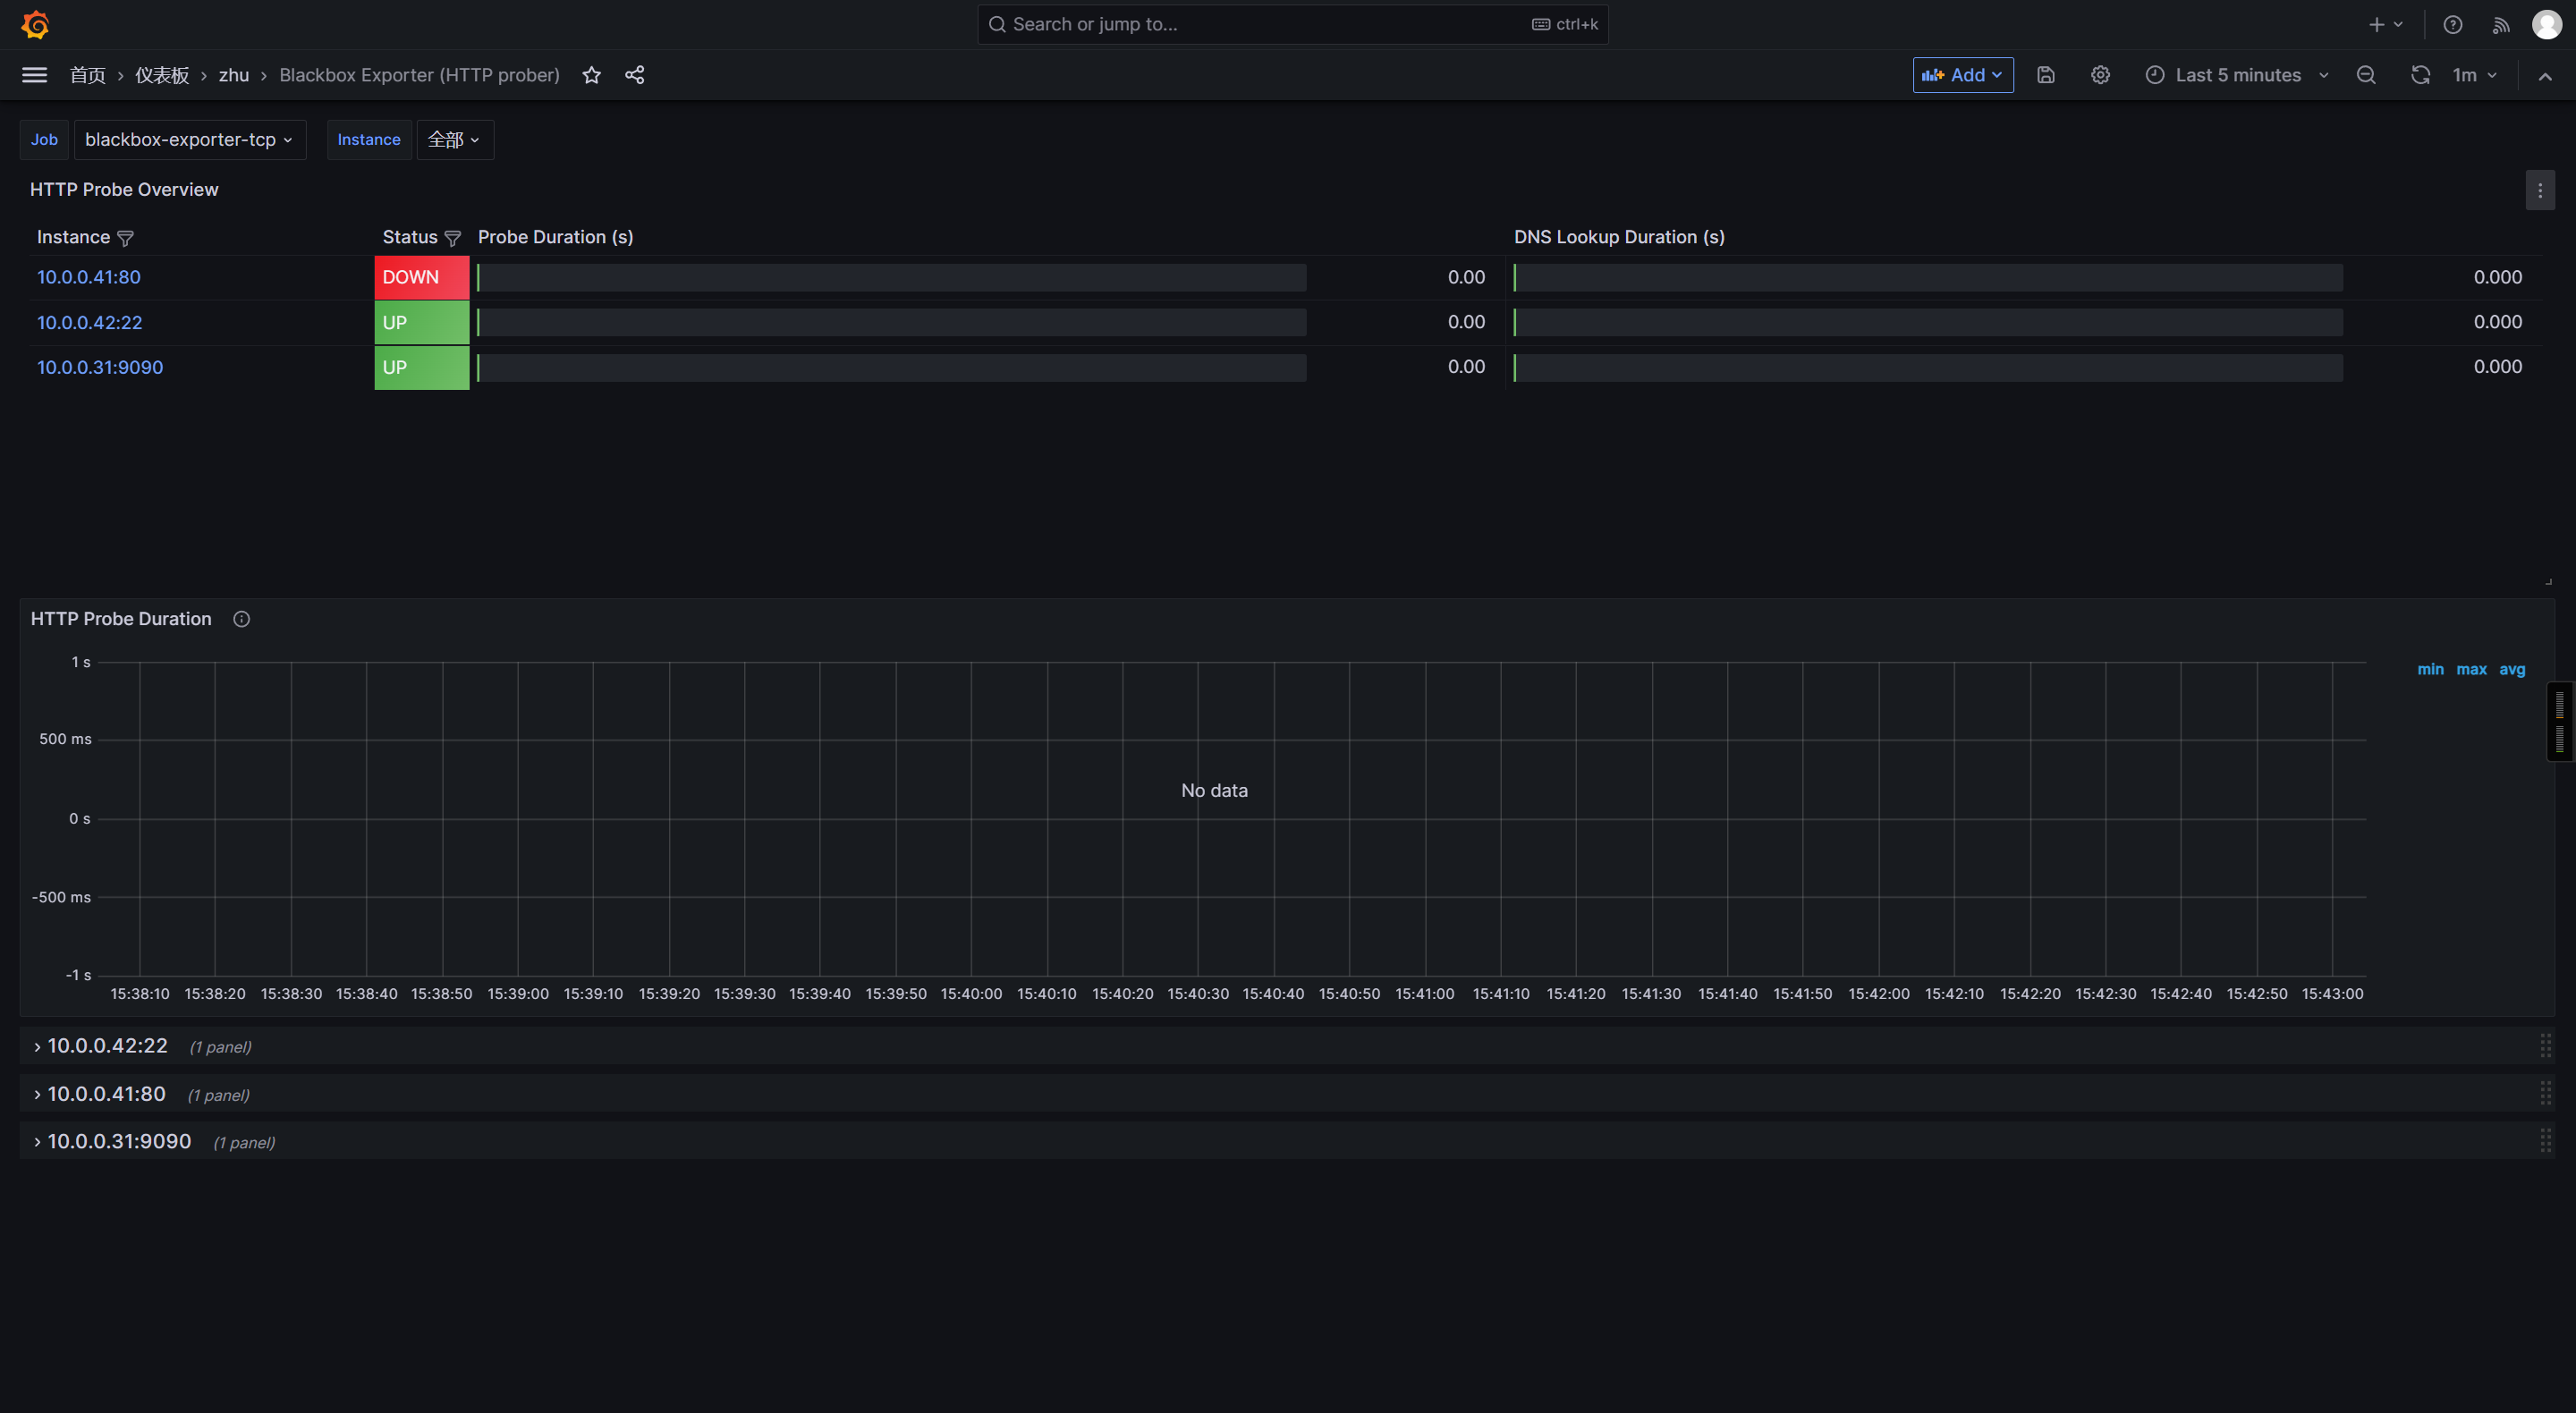
使用grafana查看数据
基于"blackbox-exporter-tcp"标签进行过滤。
🌟pushgateway组件实现自定义监控直播人数案例
什么是pushgateway
说白了,就是Prometheus官方用来短期自定义监控指标。
如果长期监控的组件建议运维开发人员编写相应的exporters。
部署pushgateway
wget https://github.com/prometheus/pushgateway/releases/download/v1.11.1/pushgateway-1.11.1.linux-amd64.tar.gz
解压软件包
[root@node-exporter42 ~]# tar xf pushgateway-1.11.1.linux-amd64.tar.gz -C /usr/local/bin/ pushgateway-1.11.1.linux-amd64/pushgateway --strip-components=1

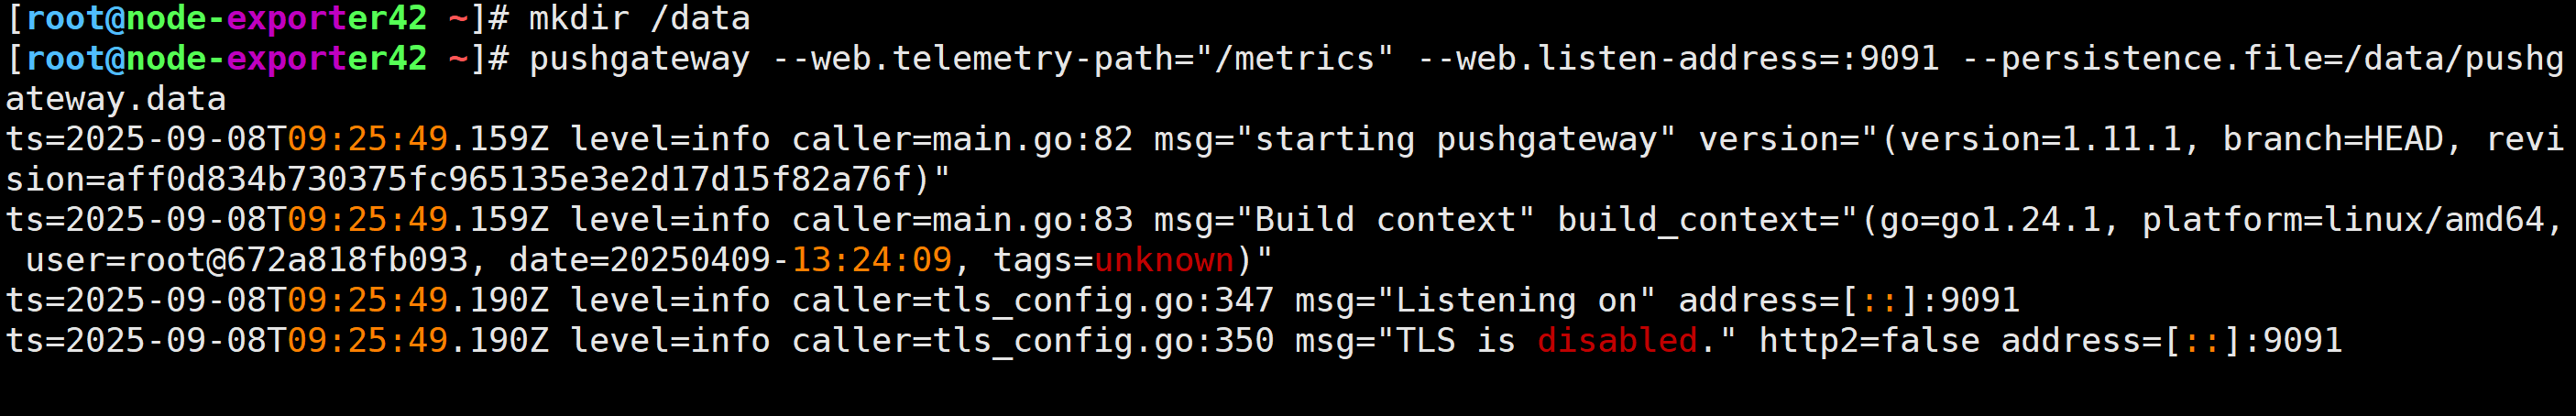
运行pushgateway
[root@node-exporter42 ~]# pushgateway --web.telemetry-path="/metrics" --web.listen-address=:9091 --persistence.file=/data/pushgateway.data
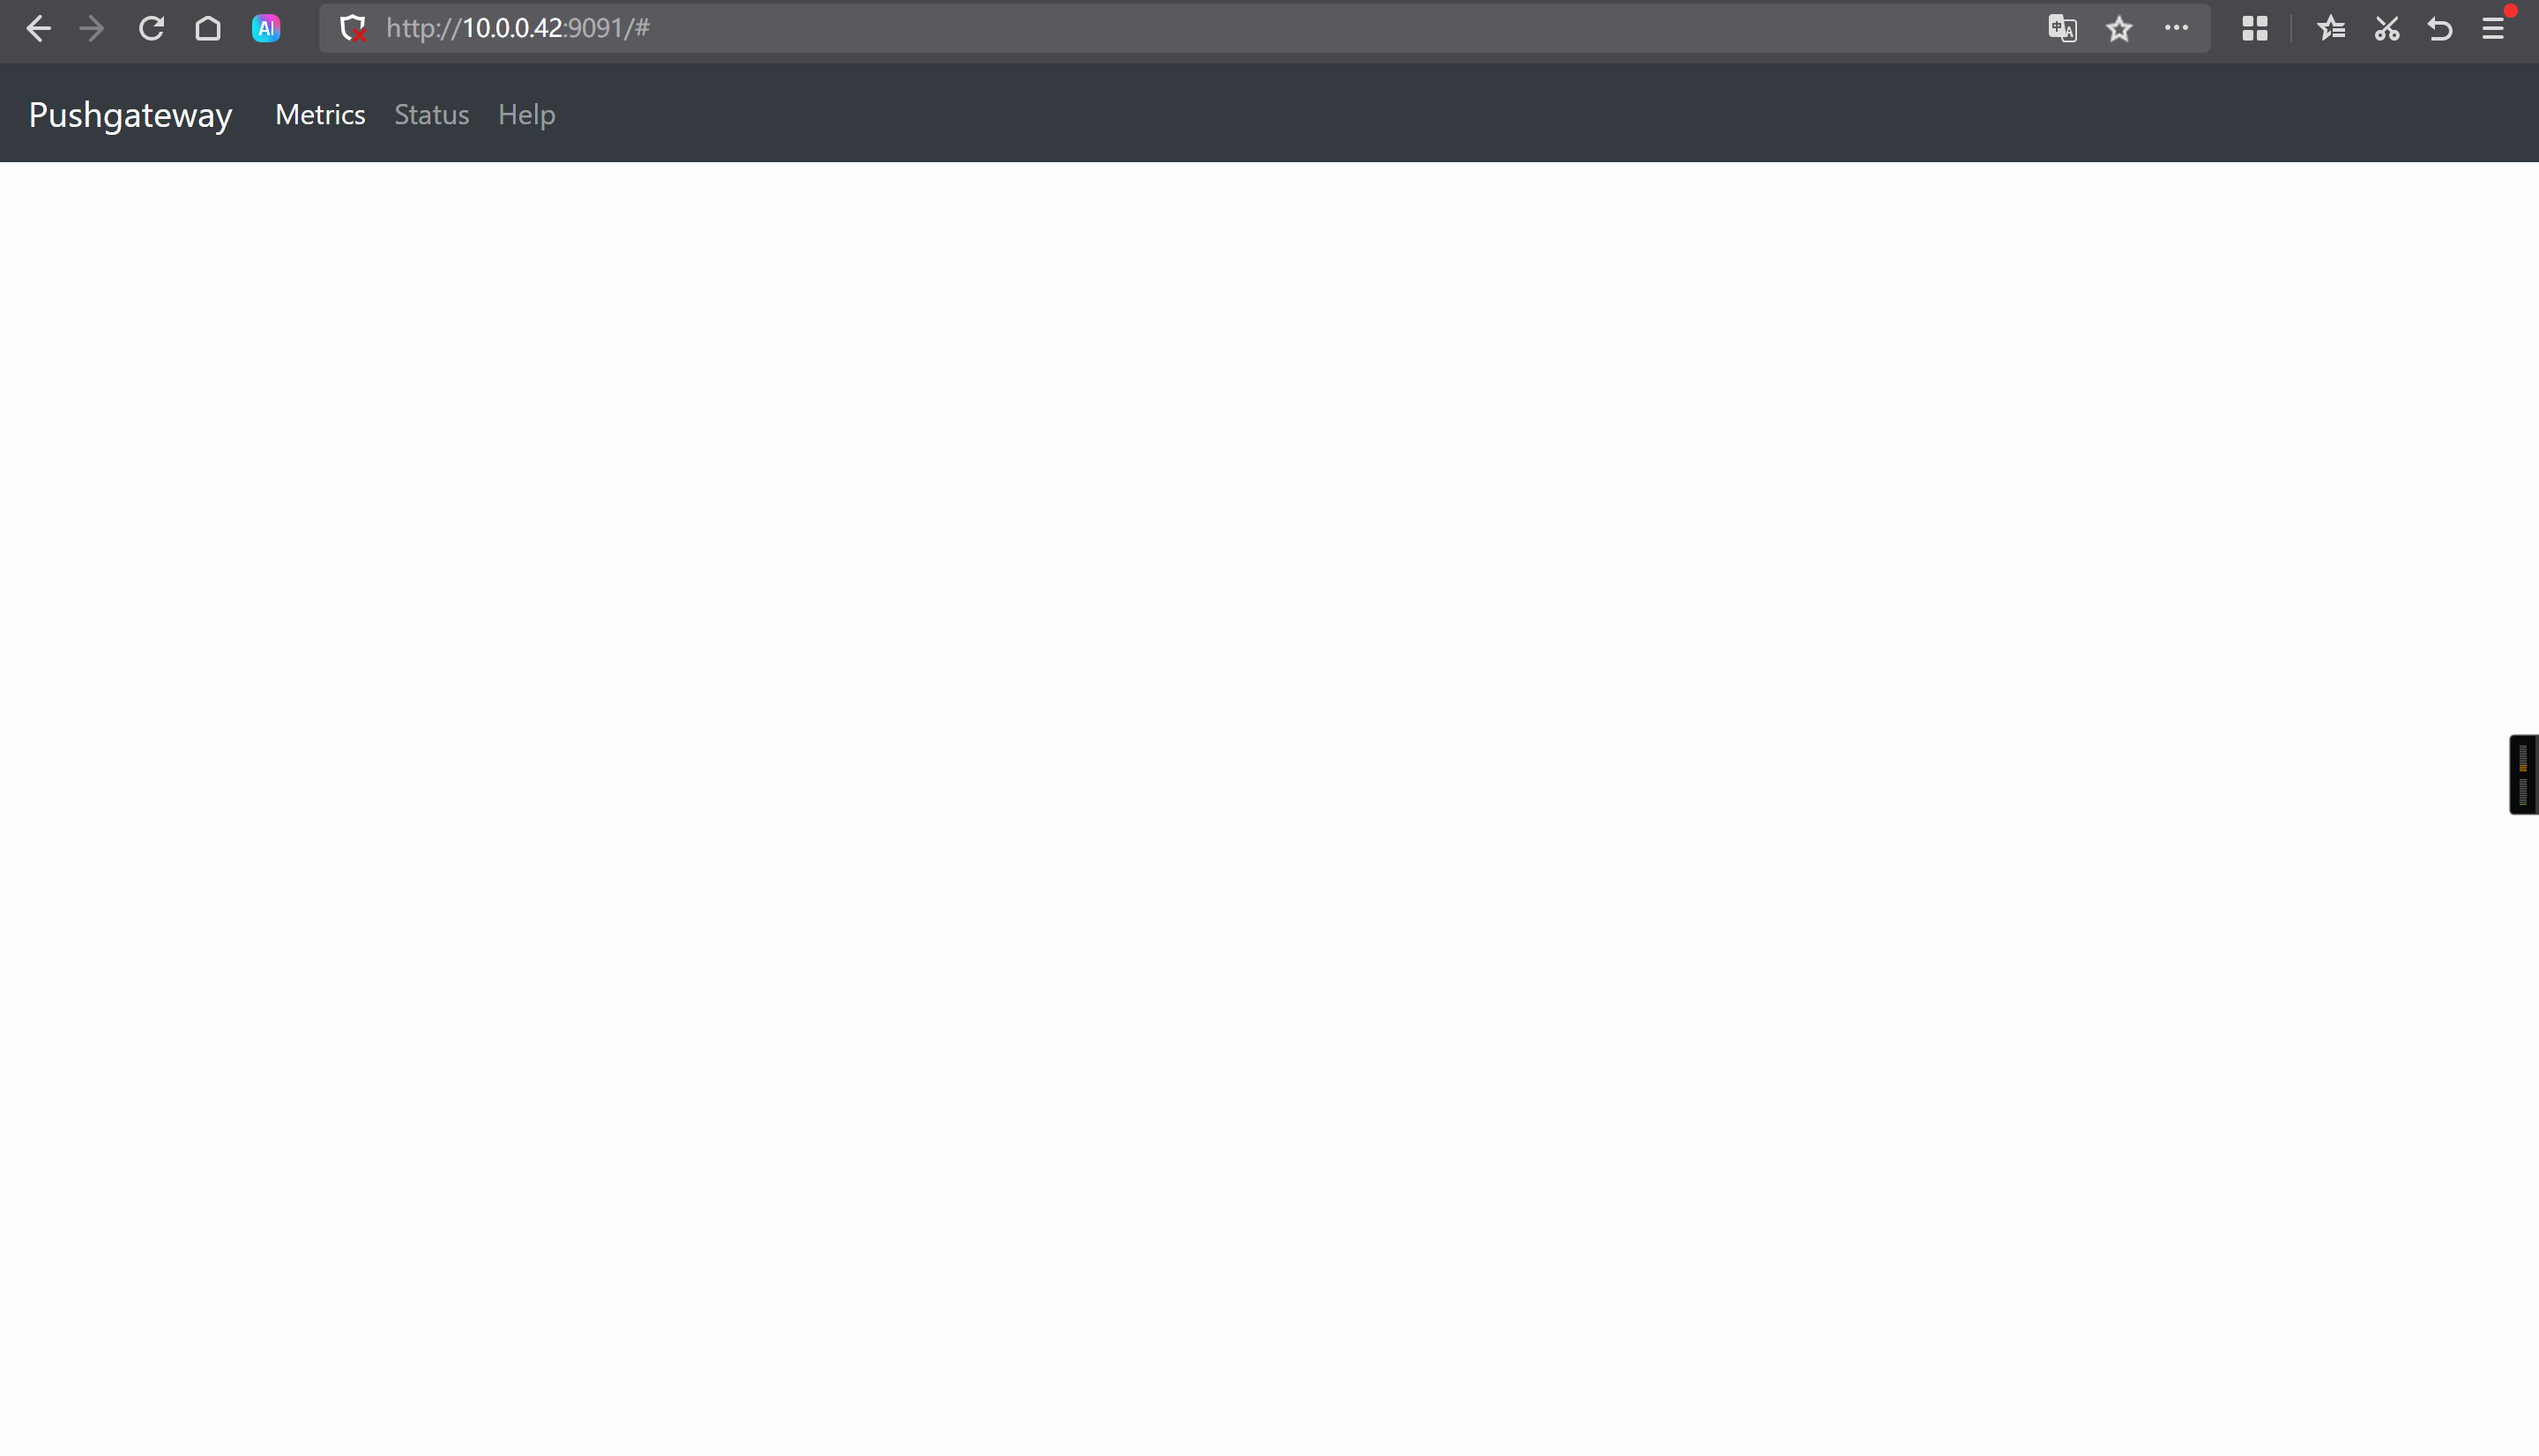
访问pushgateway的WebUI
http://10.0.0.42:9091/#
模拟直播在线人数统计
使用curl工具推送测试数据pushgateway
[root@node-exporter43 ~]# echo "zhibo_online 35" | curl --data-binary @- http://10.0.0.42:9091/metrics/job/zhibo/instance/10.0.0.43
pushgateway查询数据是否上传成功
[root@node-exporter43 ~]# curl -s http://10.0.0.42:9091/metrics | grep zhibo_online

Prometheus server监控pushgateway
修改prometheus的配置文件
vim /app/tools/prometheus-2.53.4.linux-amd64/prometheus.yml- job_name: "pushgateway"# 采集数据标签冲突是,远程的标签会覆盖本地Prometheus server的标签。# 默认值为false,有冲突时,则会使用源标签前加一个"exported_*"的前缀标签。honor_labels: truestatic_configs:- targets: - 10.0.0.42:9091
热加载配置
[root@prometheus-server31 ~]# curl -X POST https://10.0.0.31:9090/-/reload -k -u k8s:zhubl
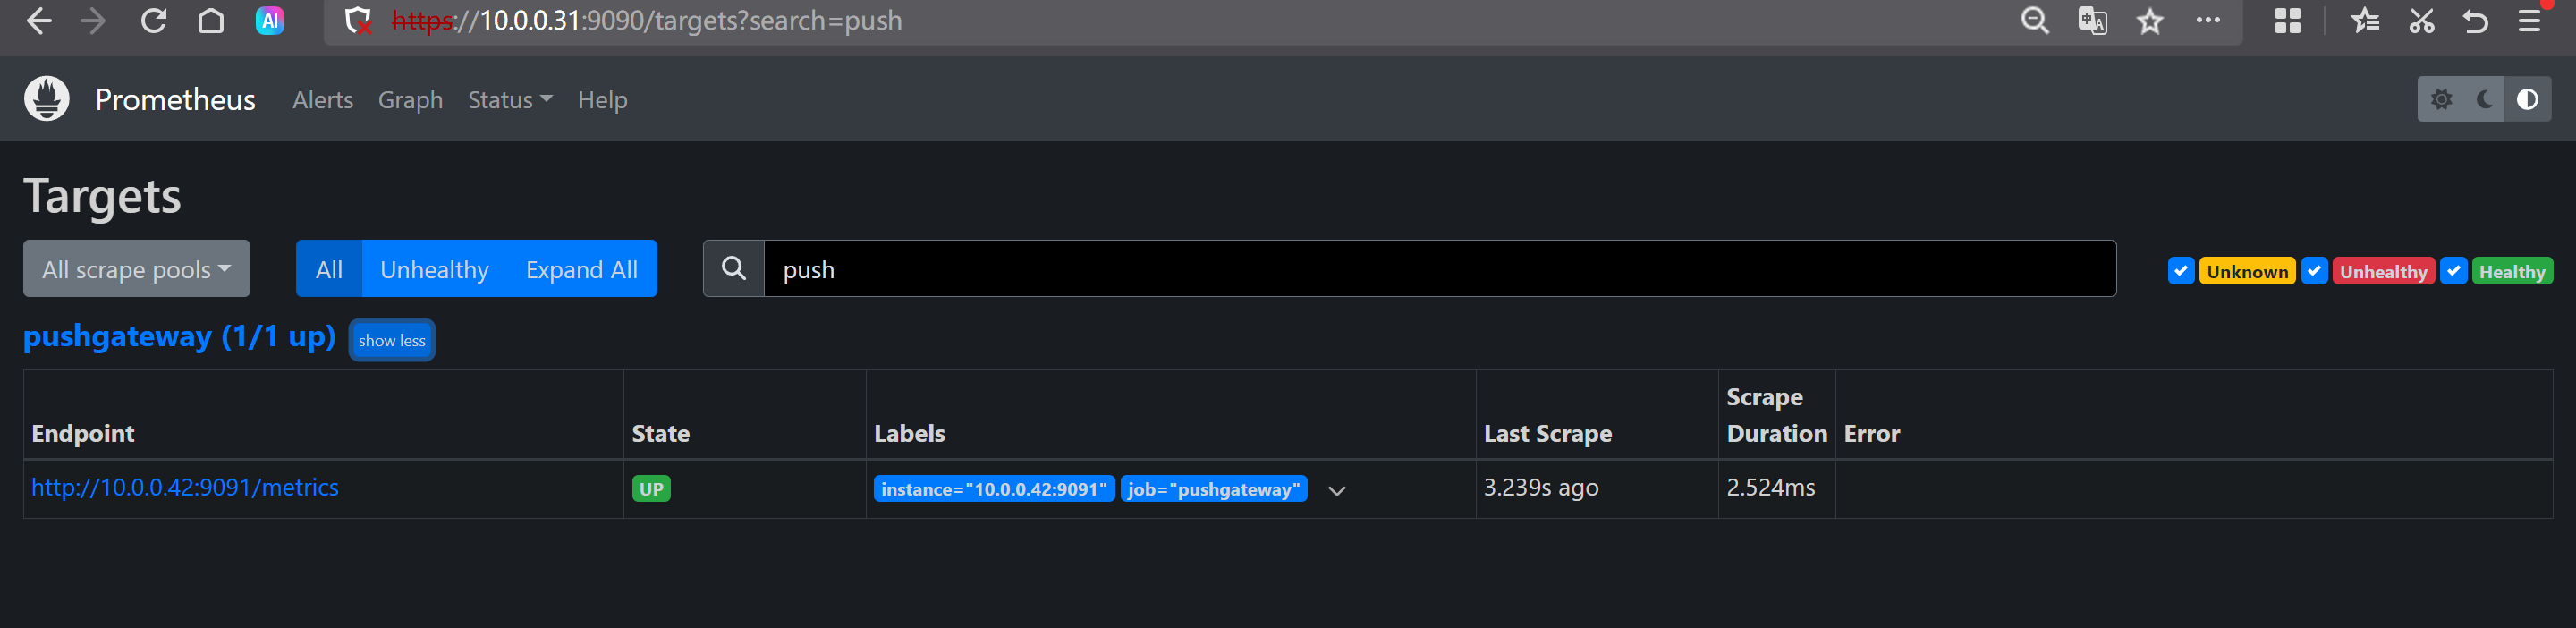
验证配置是否生效
http://10.0.0.31:9090/targets?search=
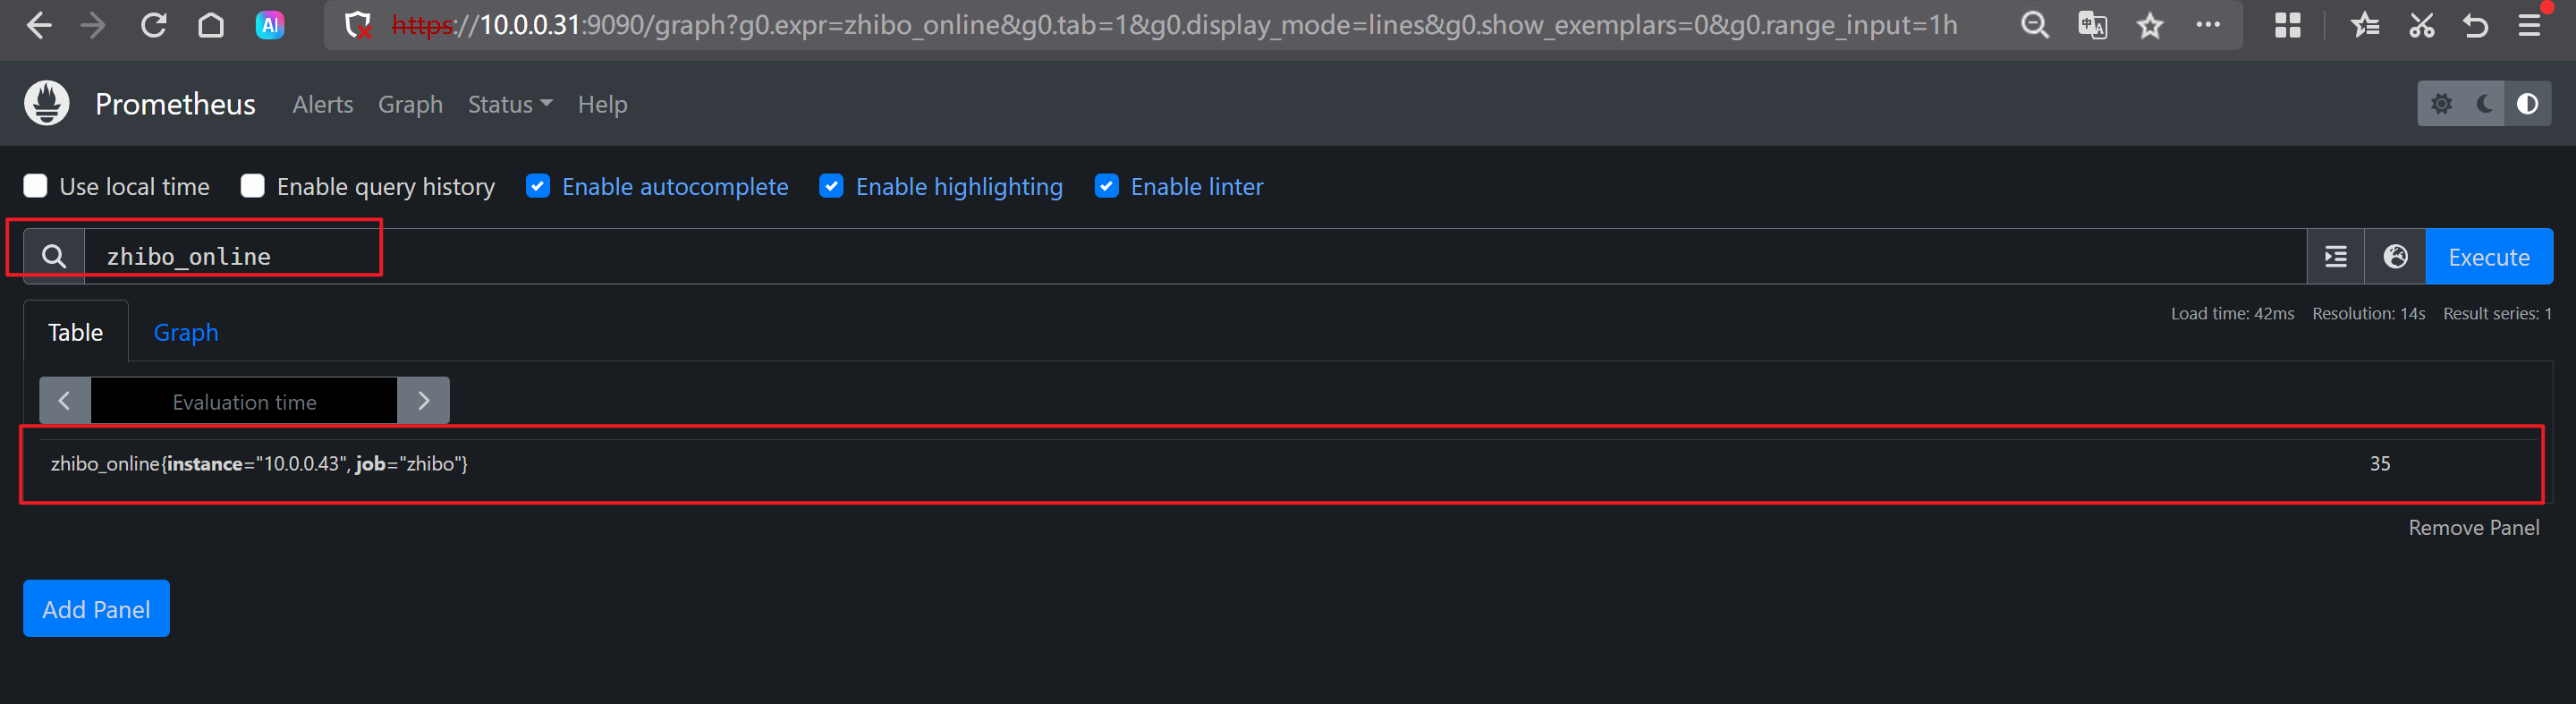
查询特定指标
zhibo_online
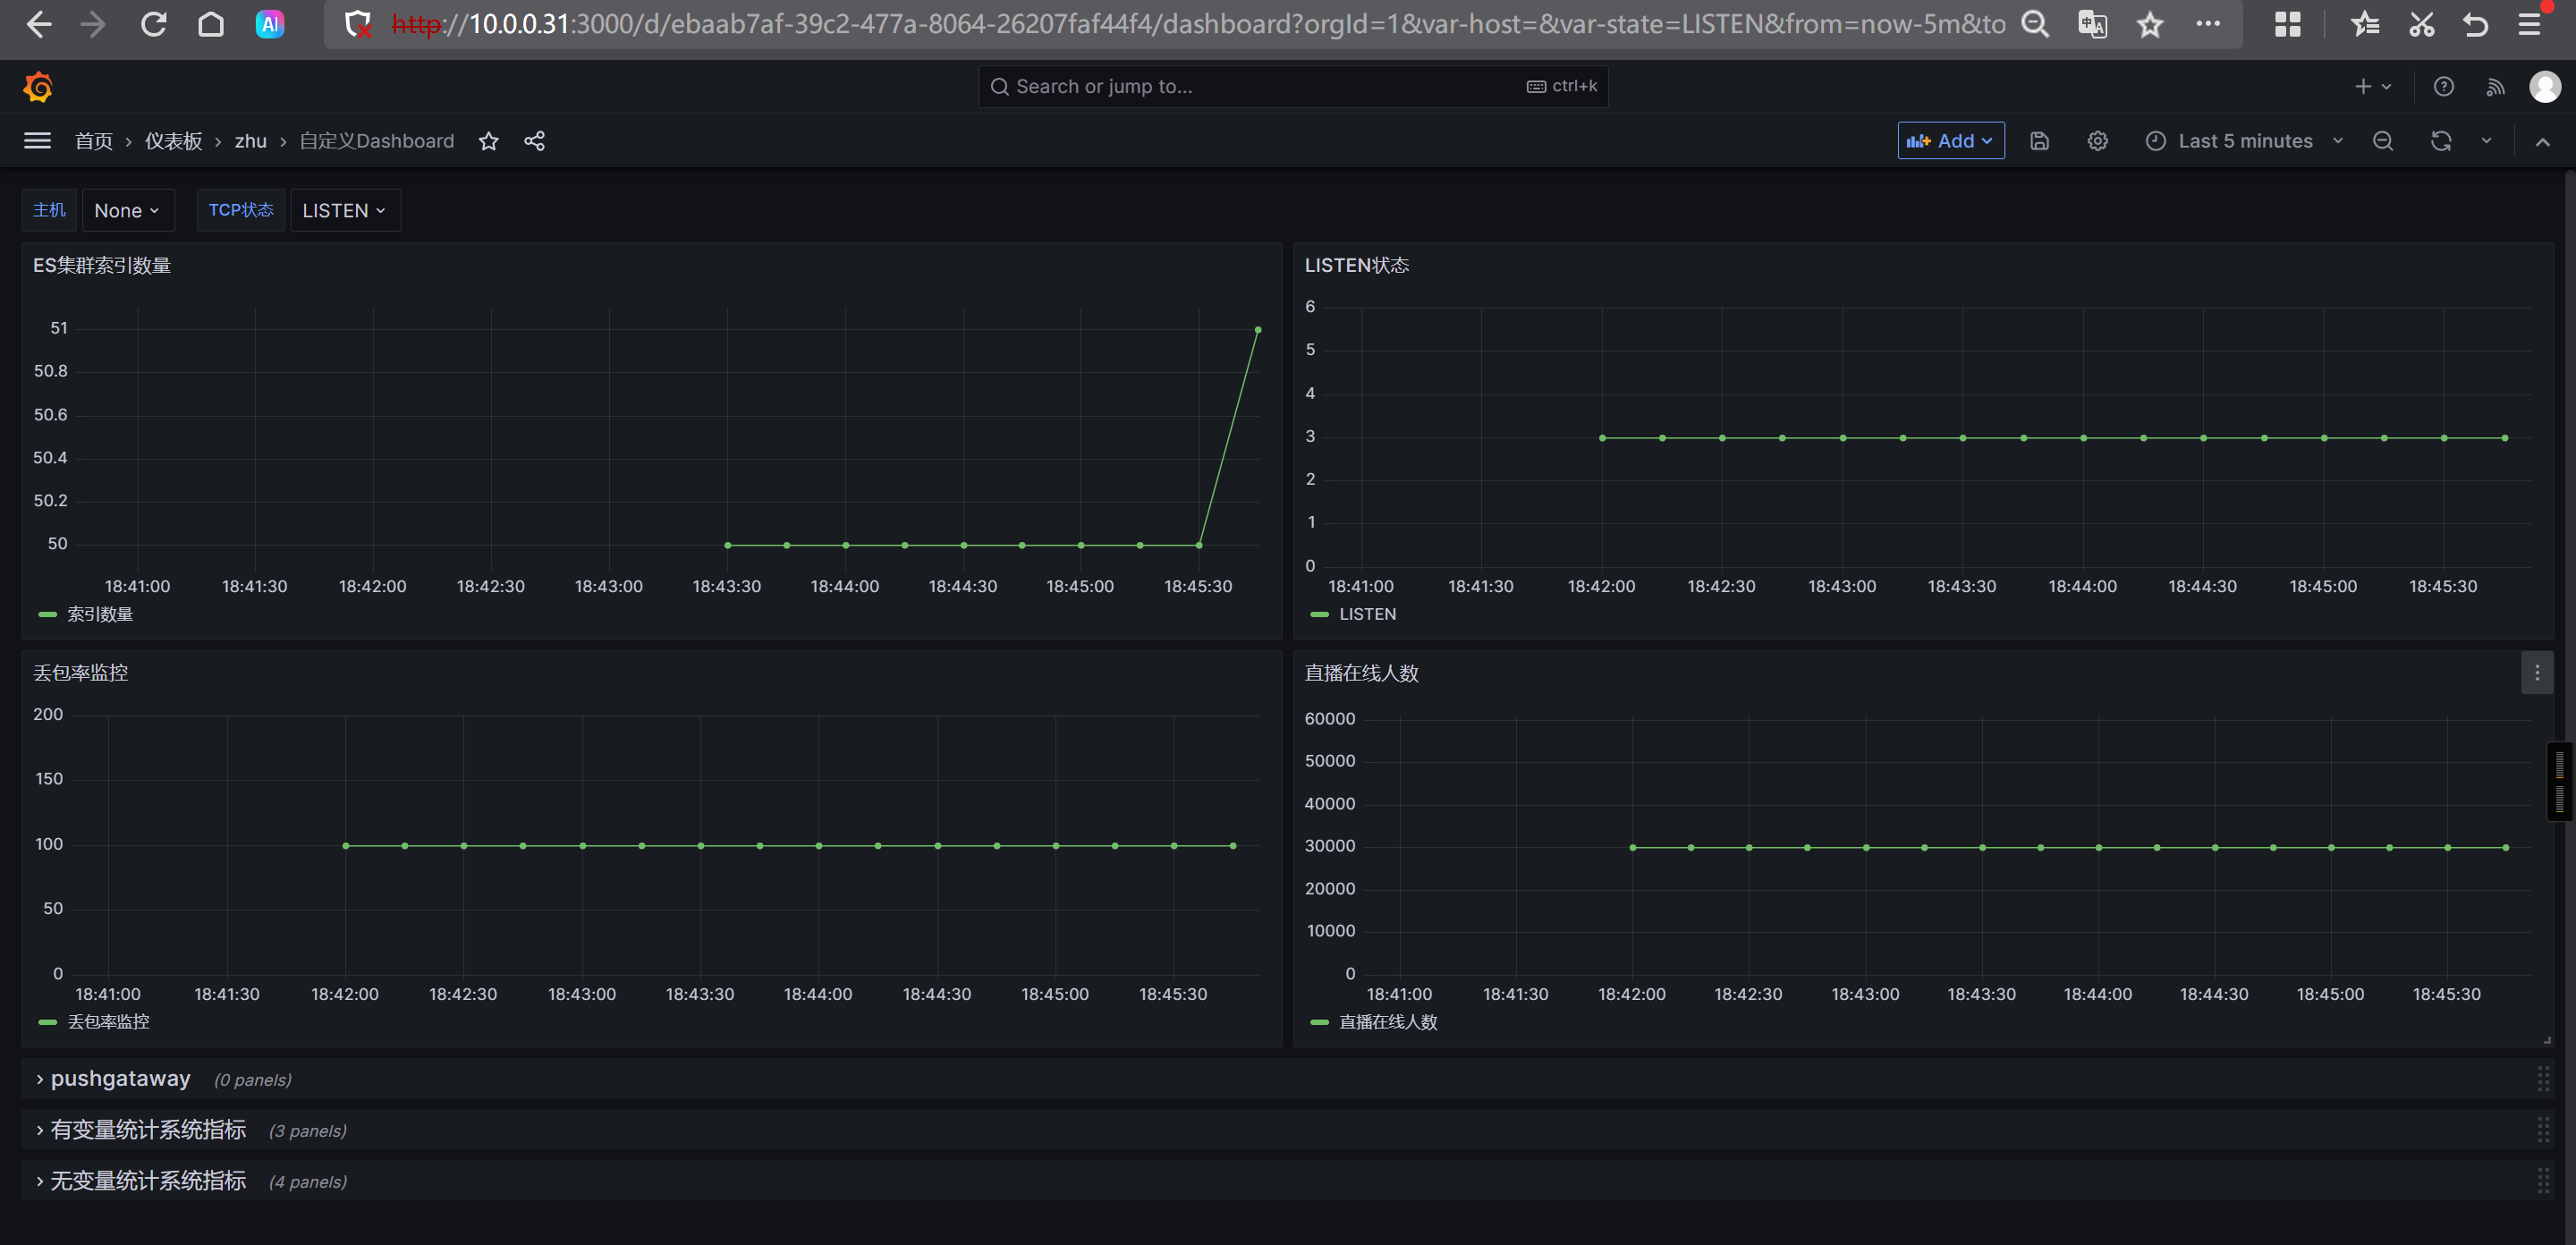
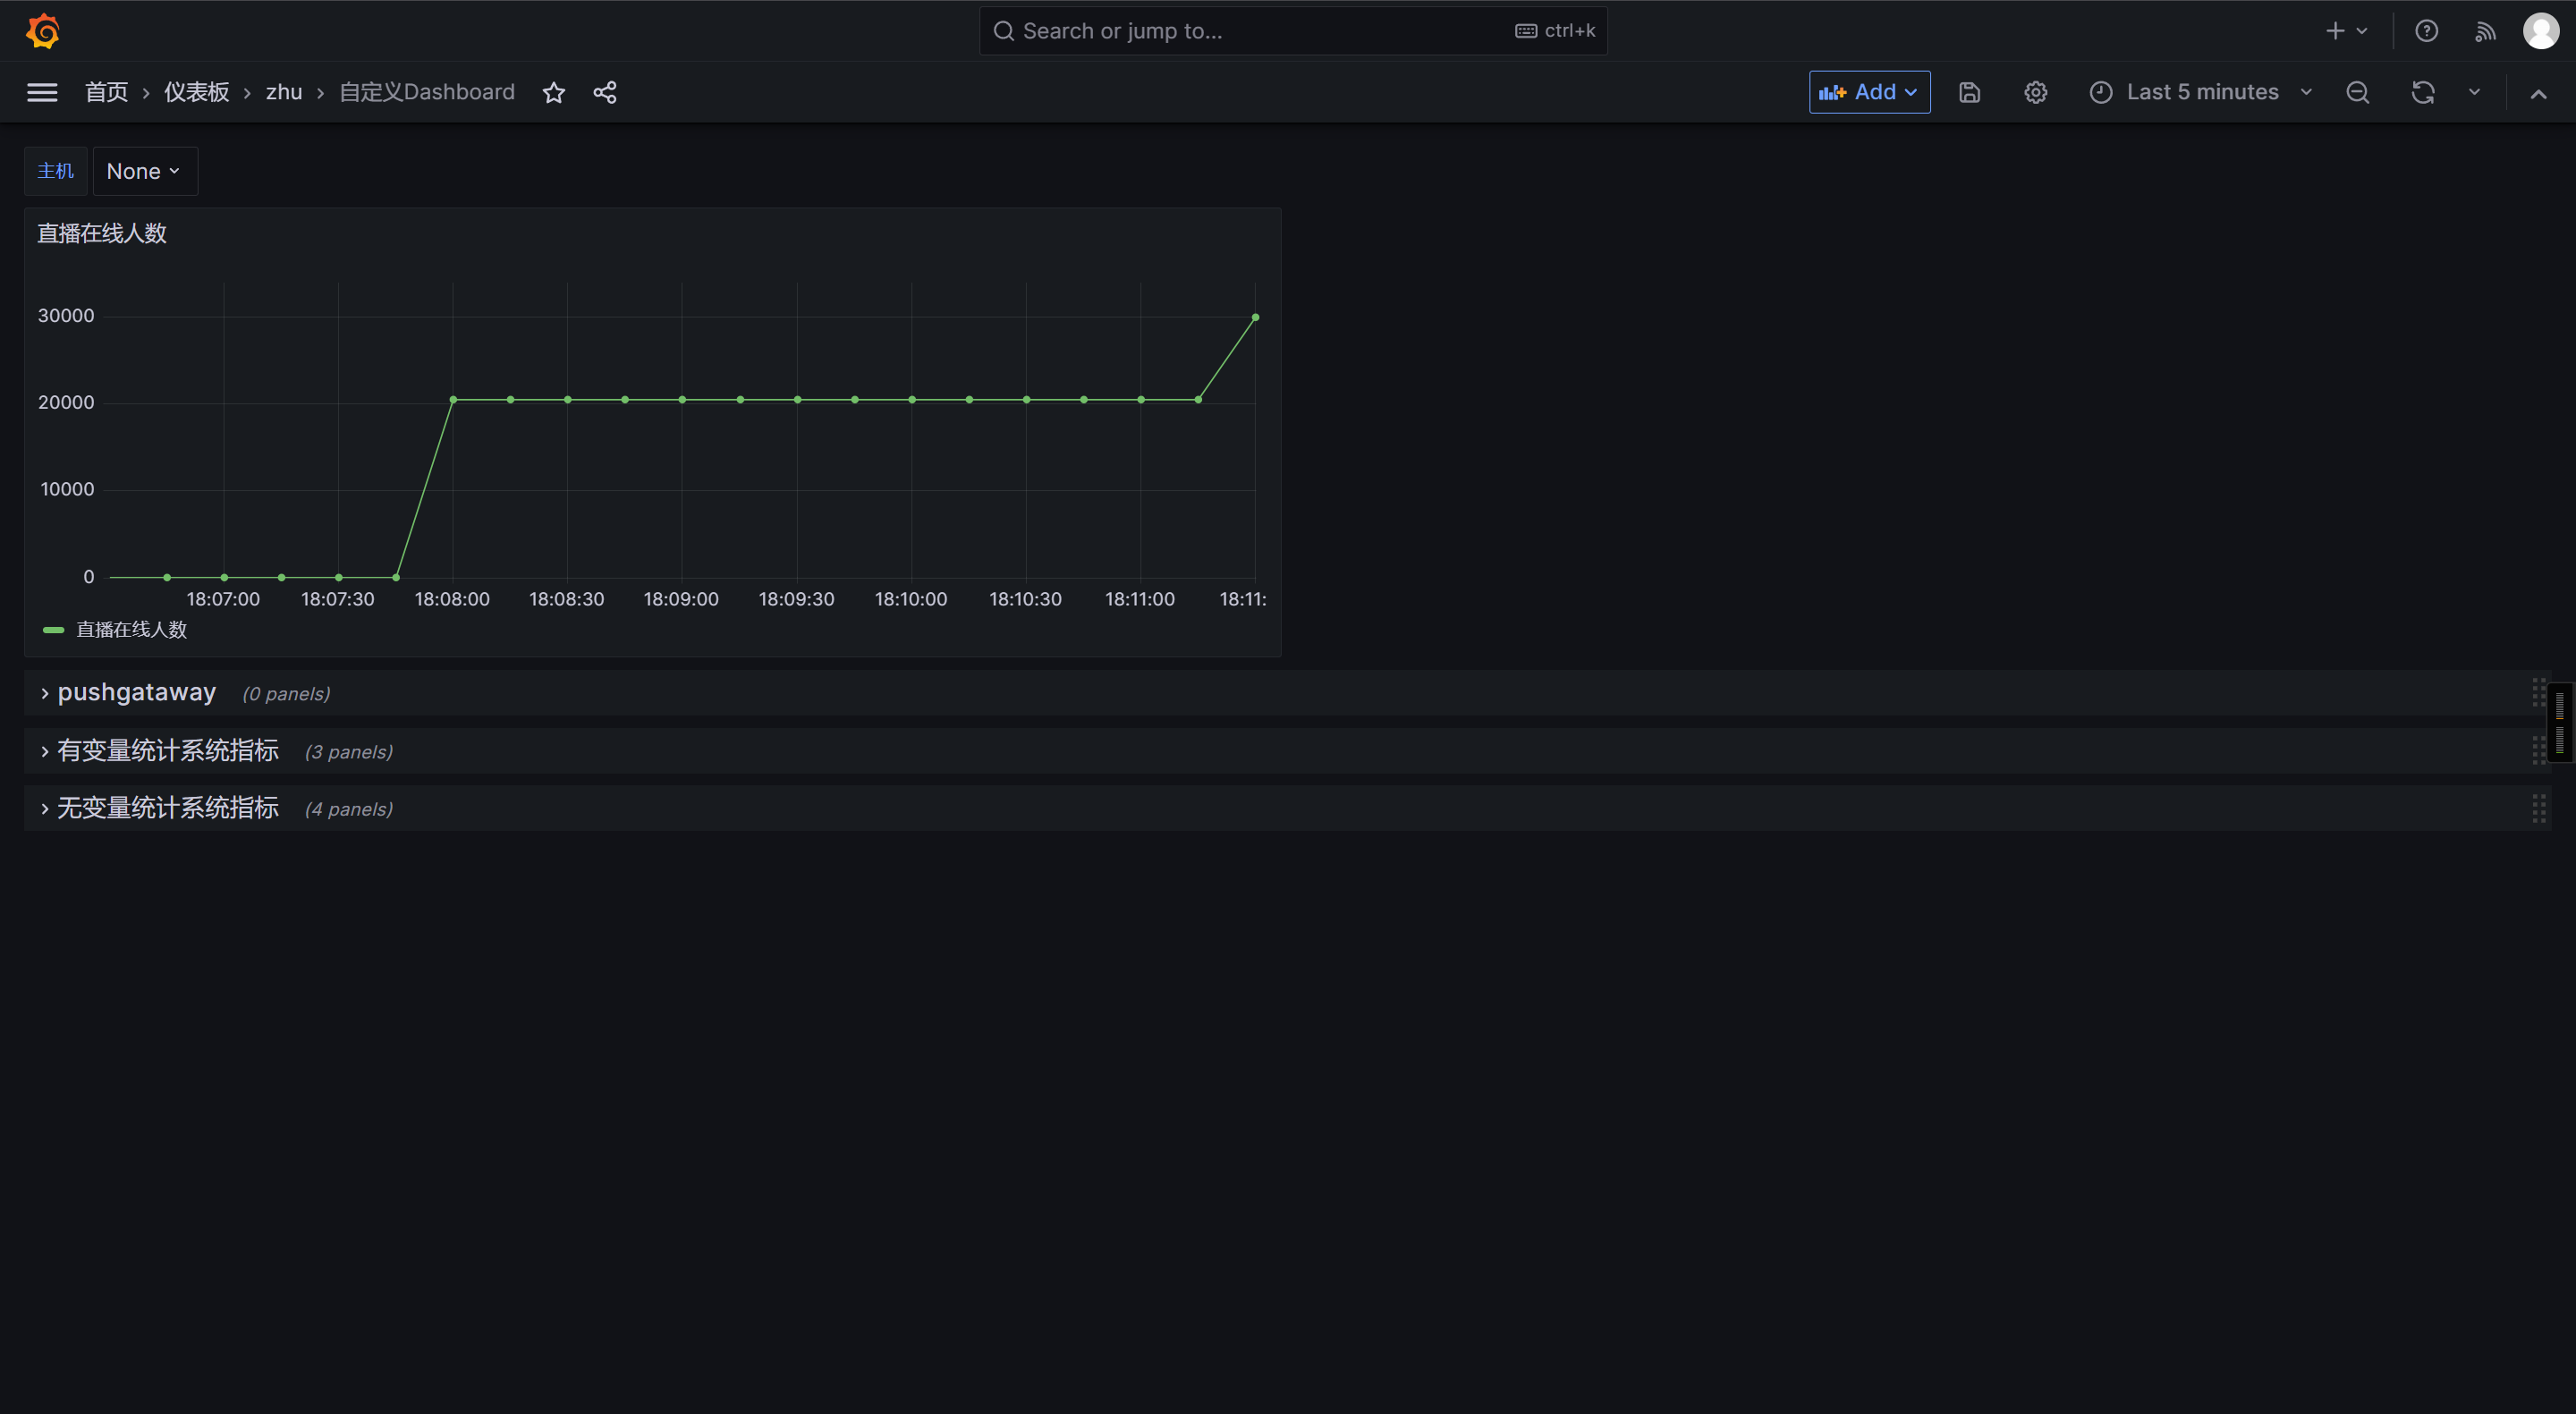
Grafana出图展示
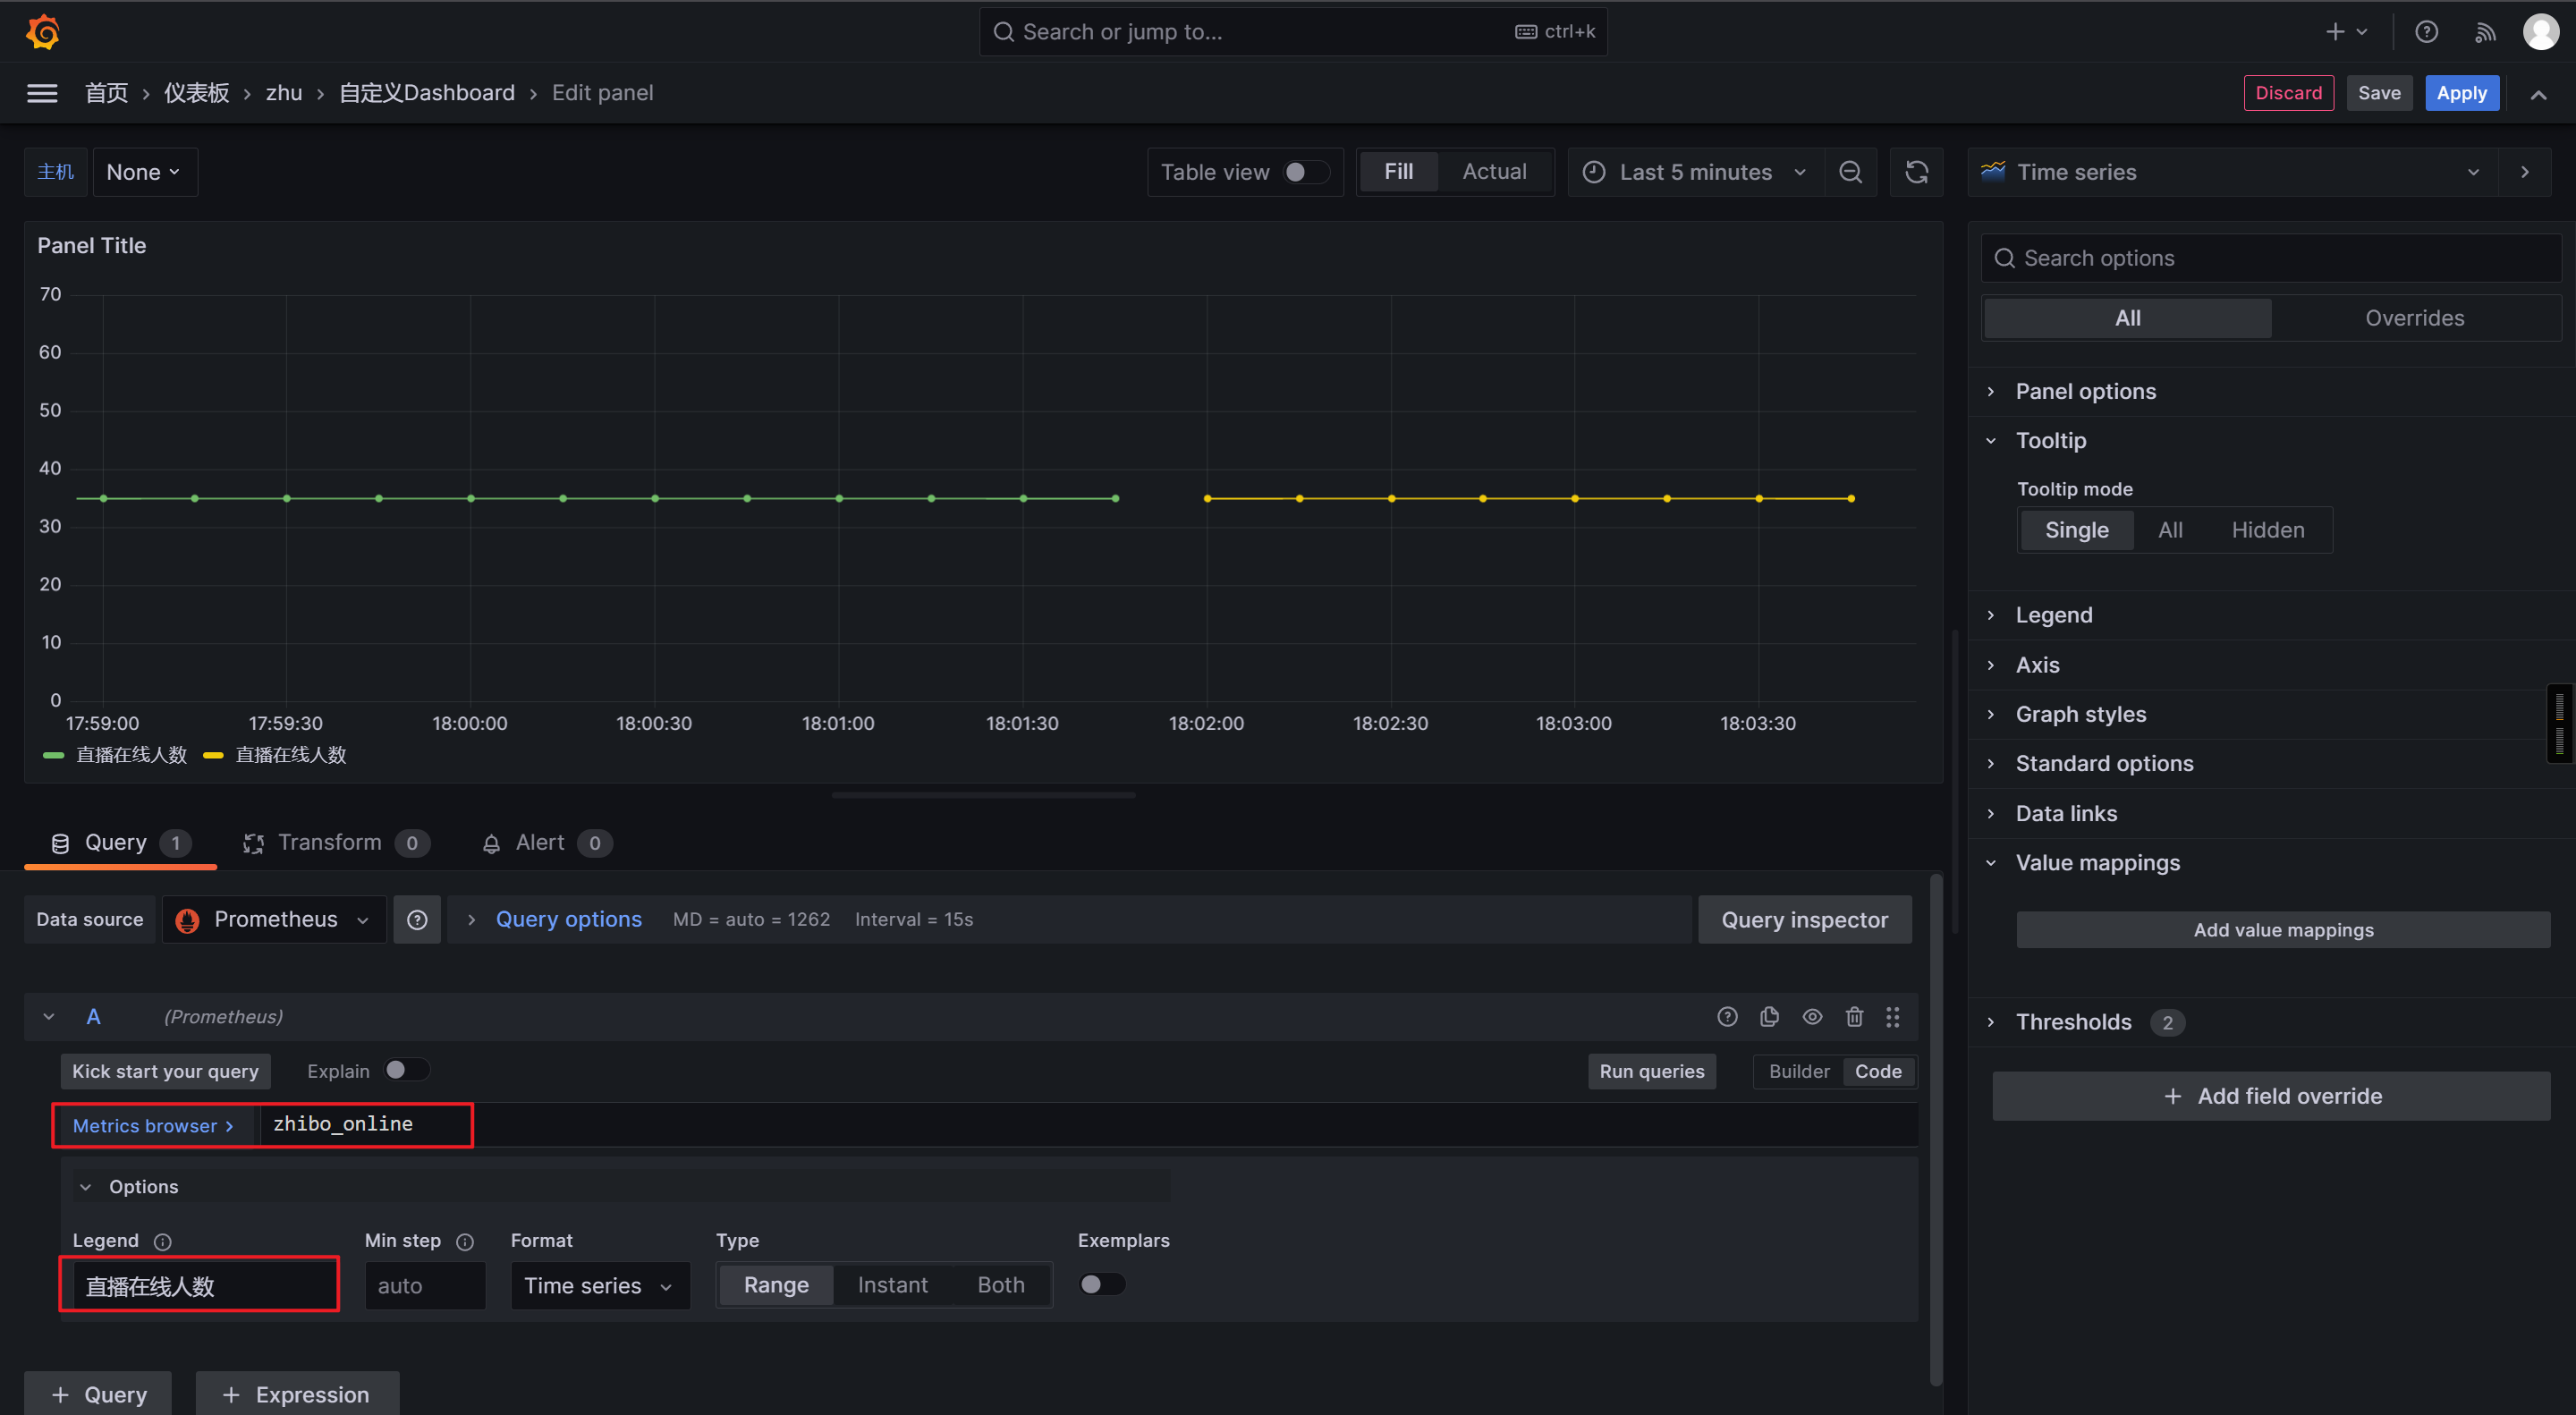
模拟直播间人数的变化
[root@node-exporter41 ~]# echo "zhibo_online $RANDOM" | curl --data-binary @- http://10.0.0.42:9091/metrics/job/zhibo/instance/10.0.0.43[root@node-exporter41 ~]# echo "zhibo_online $RANDOM" | curl --data-binary @- http://10.0.0.42:9091/metrics/job/zhibo/instance/10.0.0.43
🌟使用pushgateway监控TCP的十二种状态
编写监控脚本
#!/bin/bash
pushgateway_url="http://10.0.0.42:9091/metrics/job/tcp_status"state="SYN-SENT SYN-RECV FIN-WAIT-1 FIN-WAIT-2 TIME-WAIT CLOSE CLOSE-WAIT LAST-ACK LISTEN CLOSING ESTAB UNKNOWN"for i in $statedocount=`ss -tan |grep $i |wc -l`echo tcp_connections{state=\""$i"\"} $count >> /tmp/tcp.txt
done;cat /tmp/tcp.txt | curl --data-binary @- $pushgateway_url
rm -rf  /tmp/tcp.txt
调用脚本
bash /usr/local/bin/tcp_status.sh
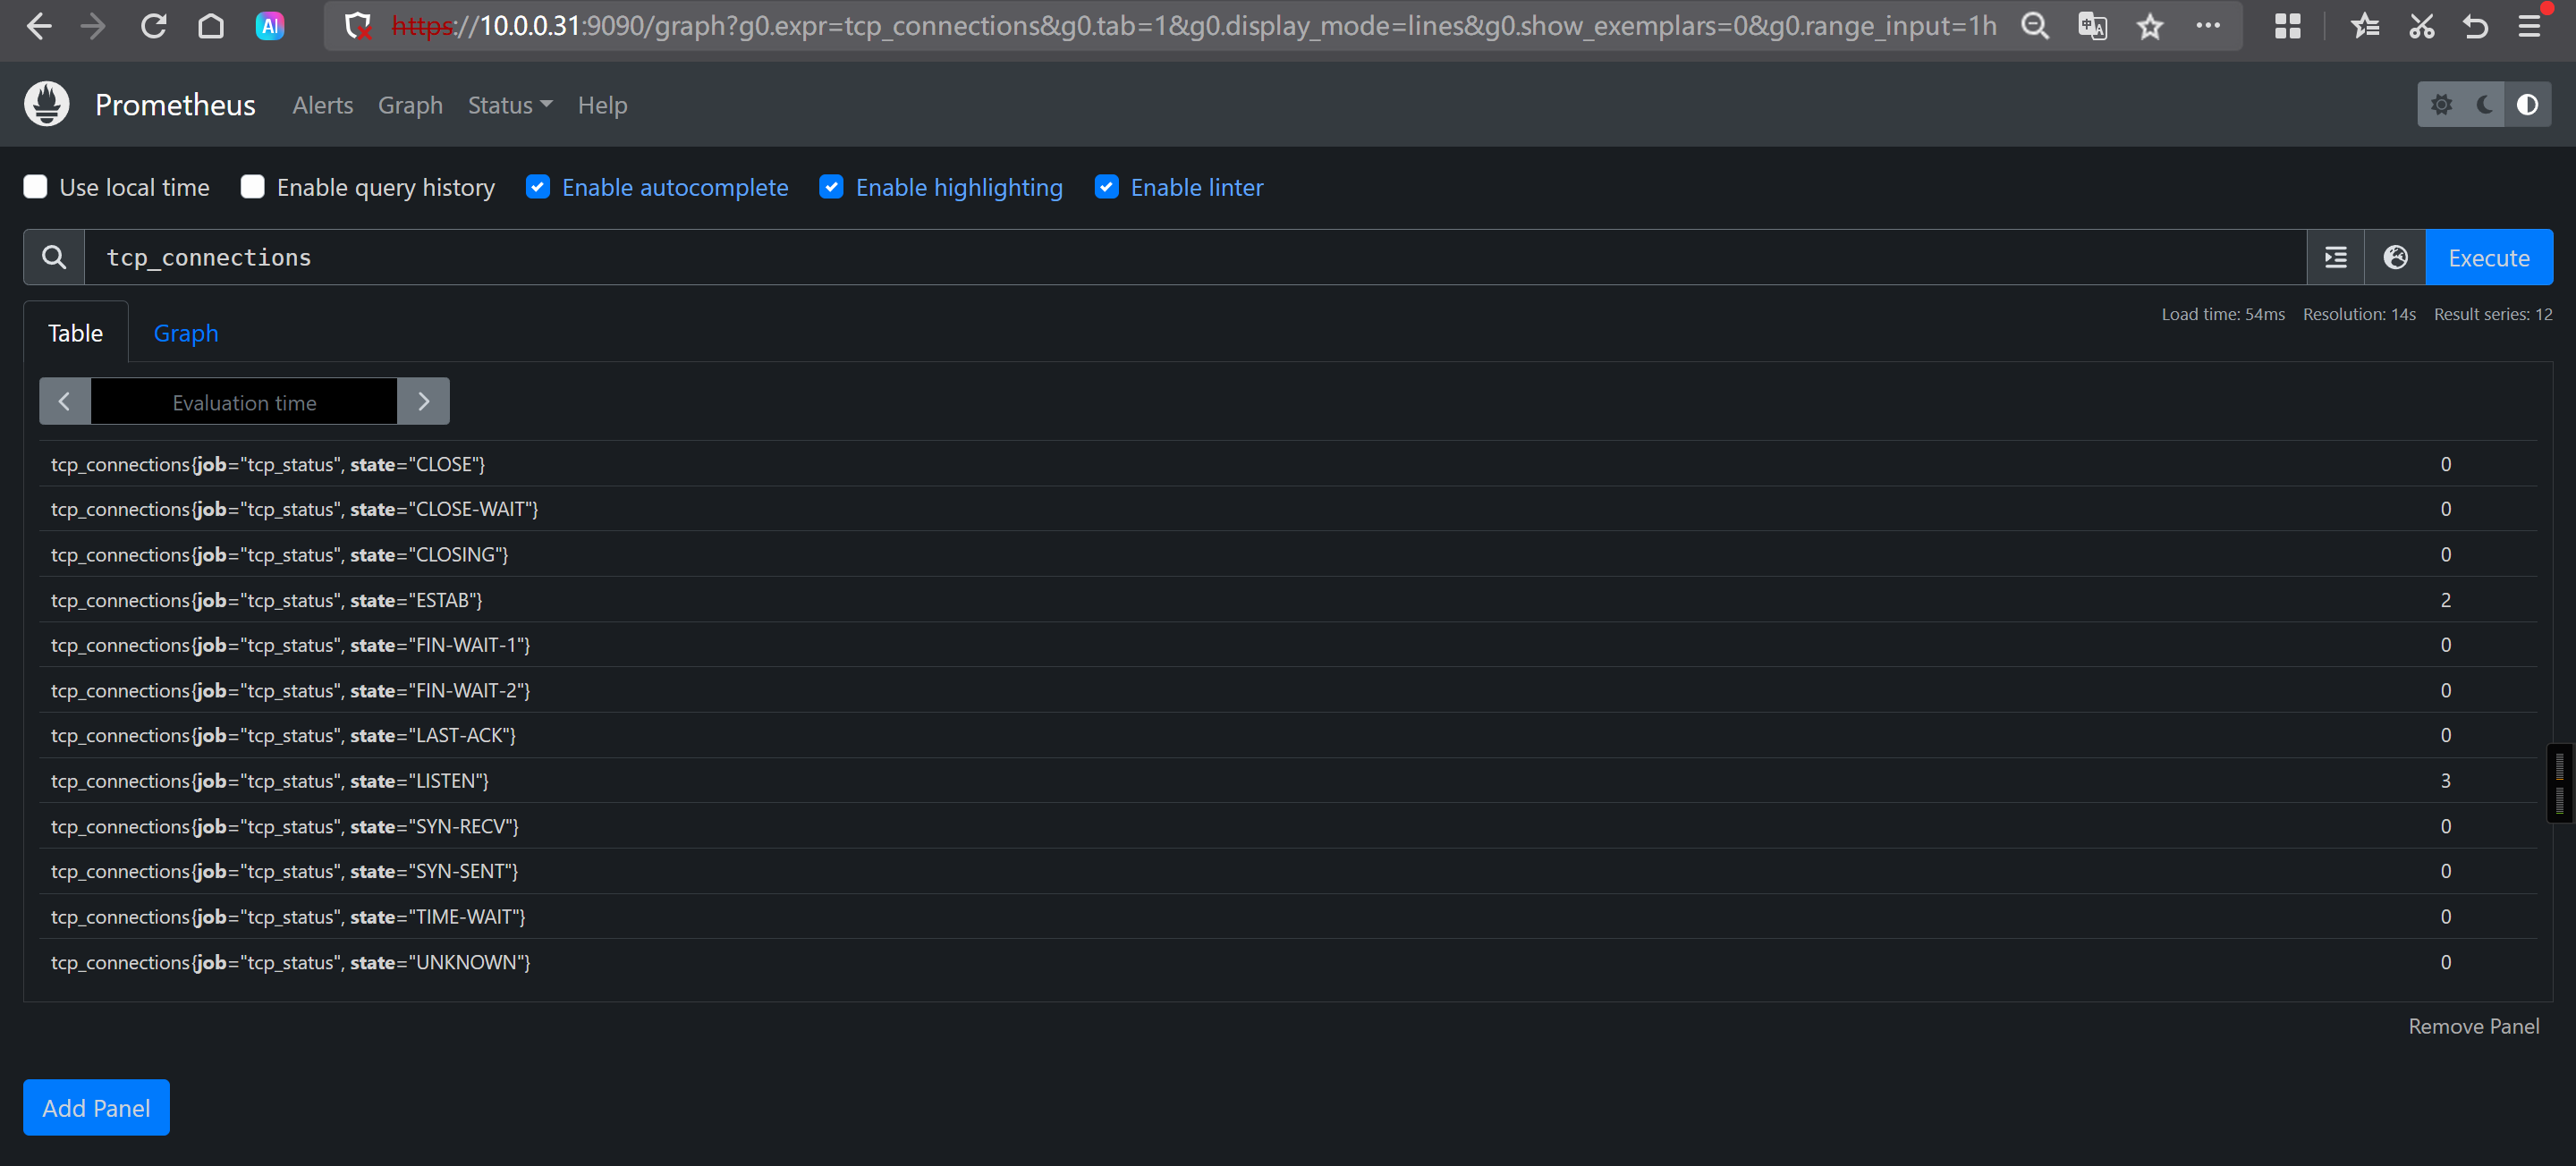
Prometheus查询数据
tcp_connections
Grafana出图展示
自定义变量
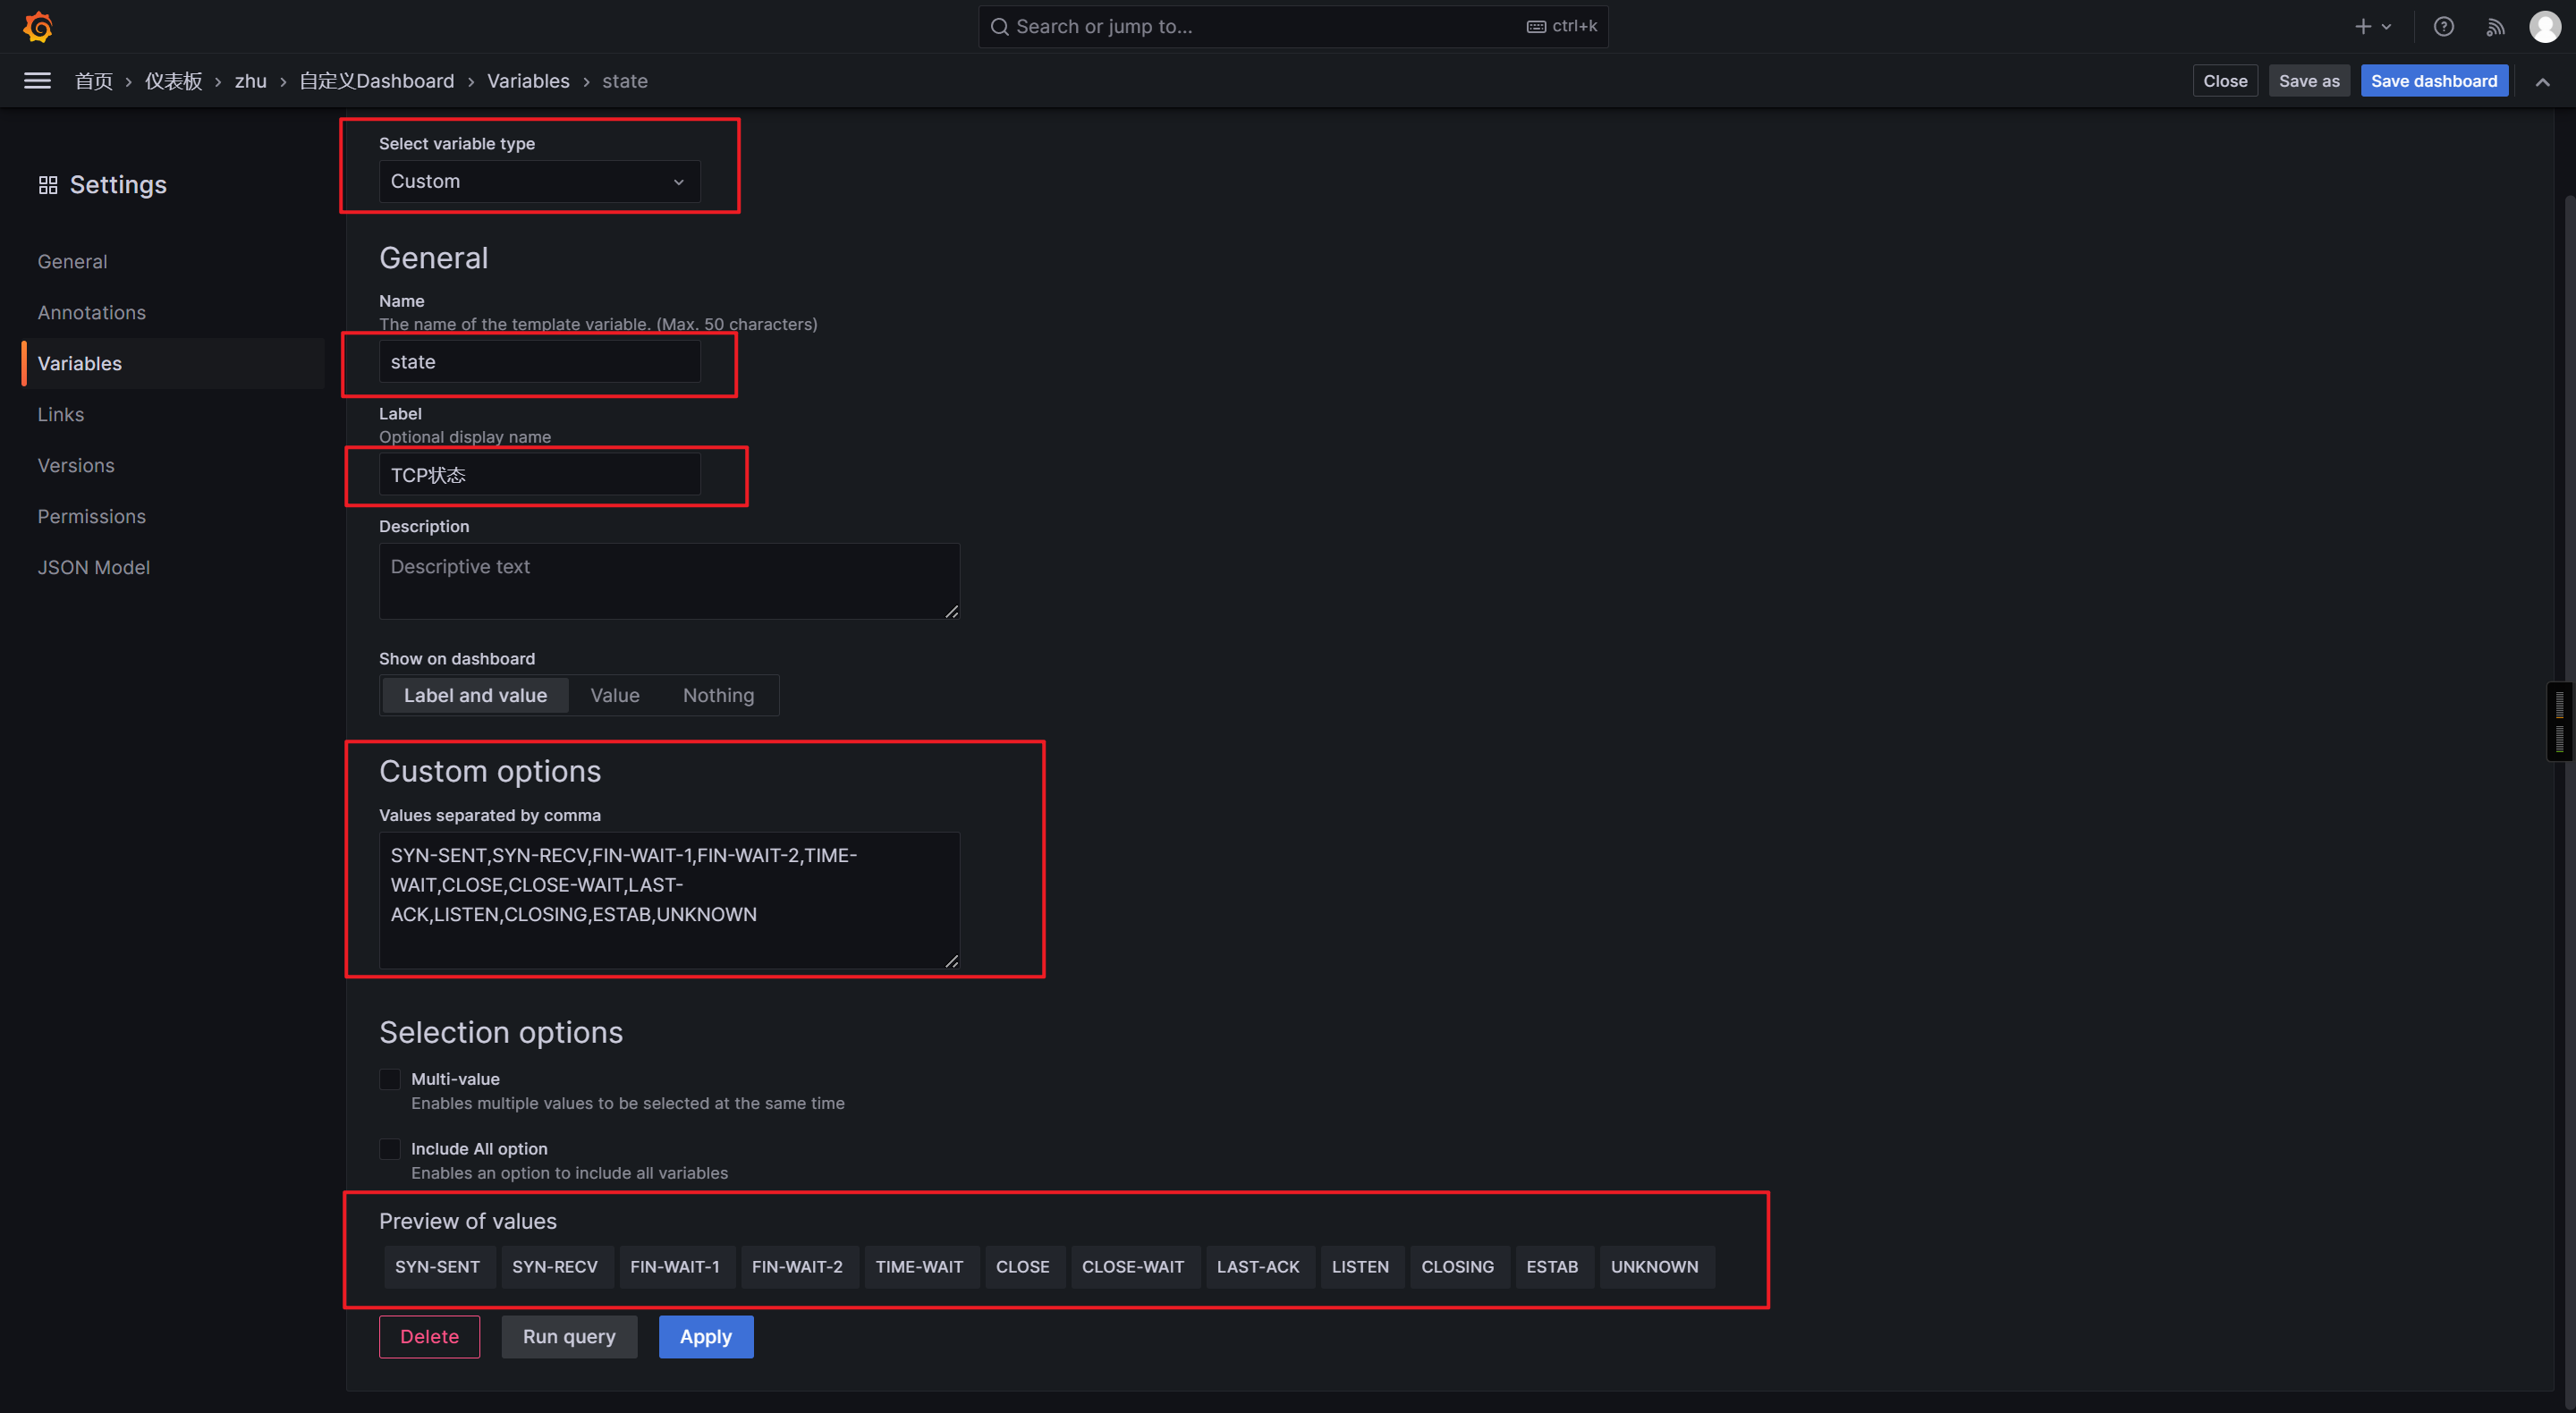
添加仪表盘
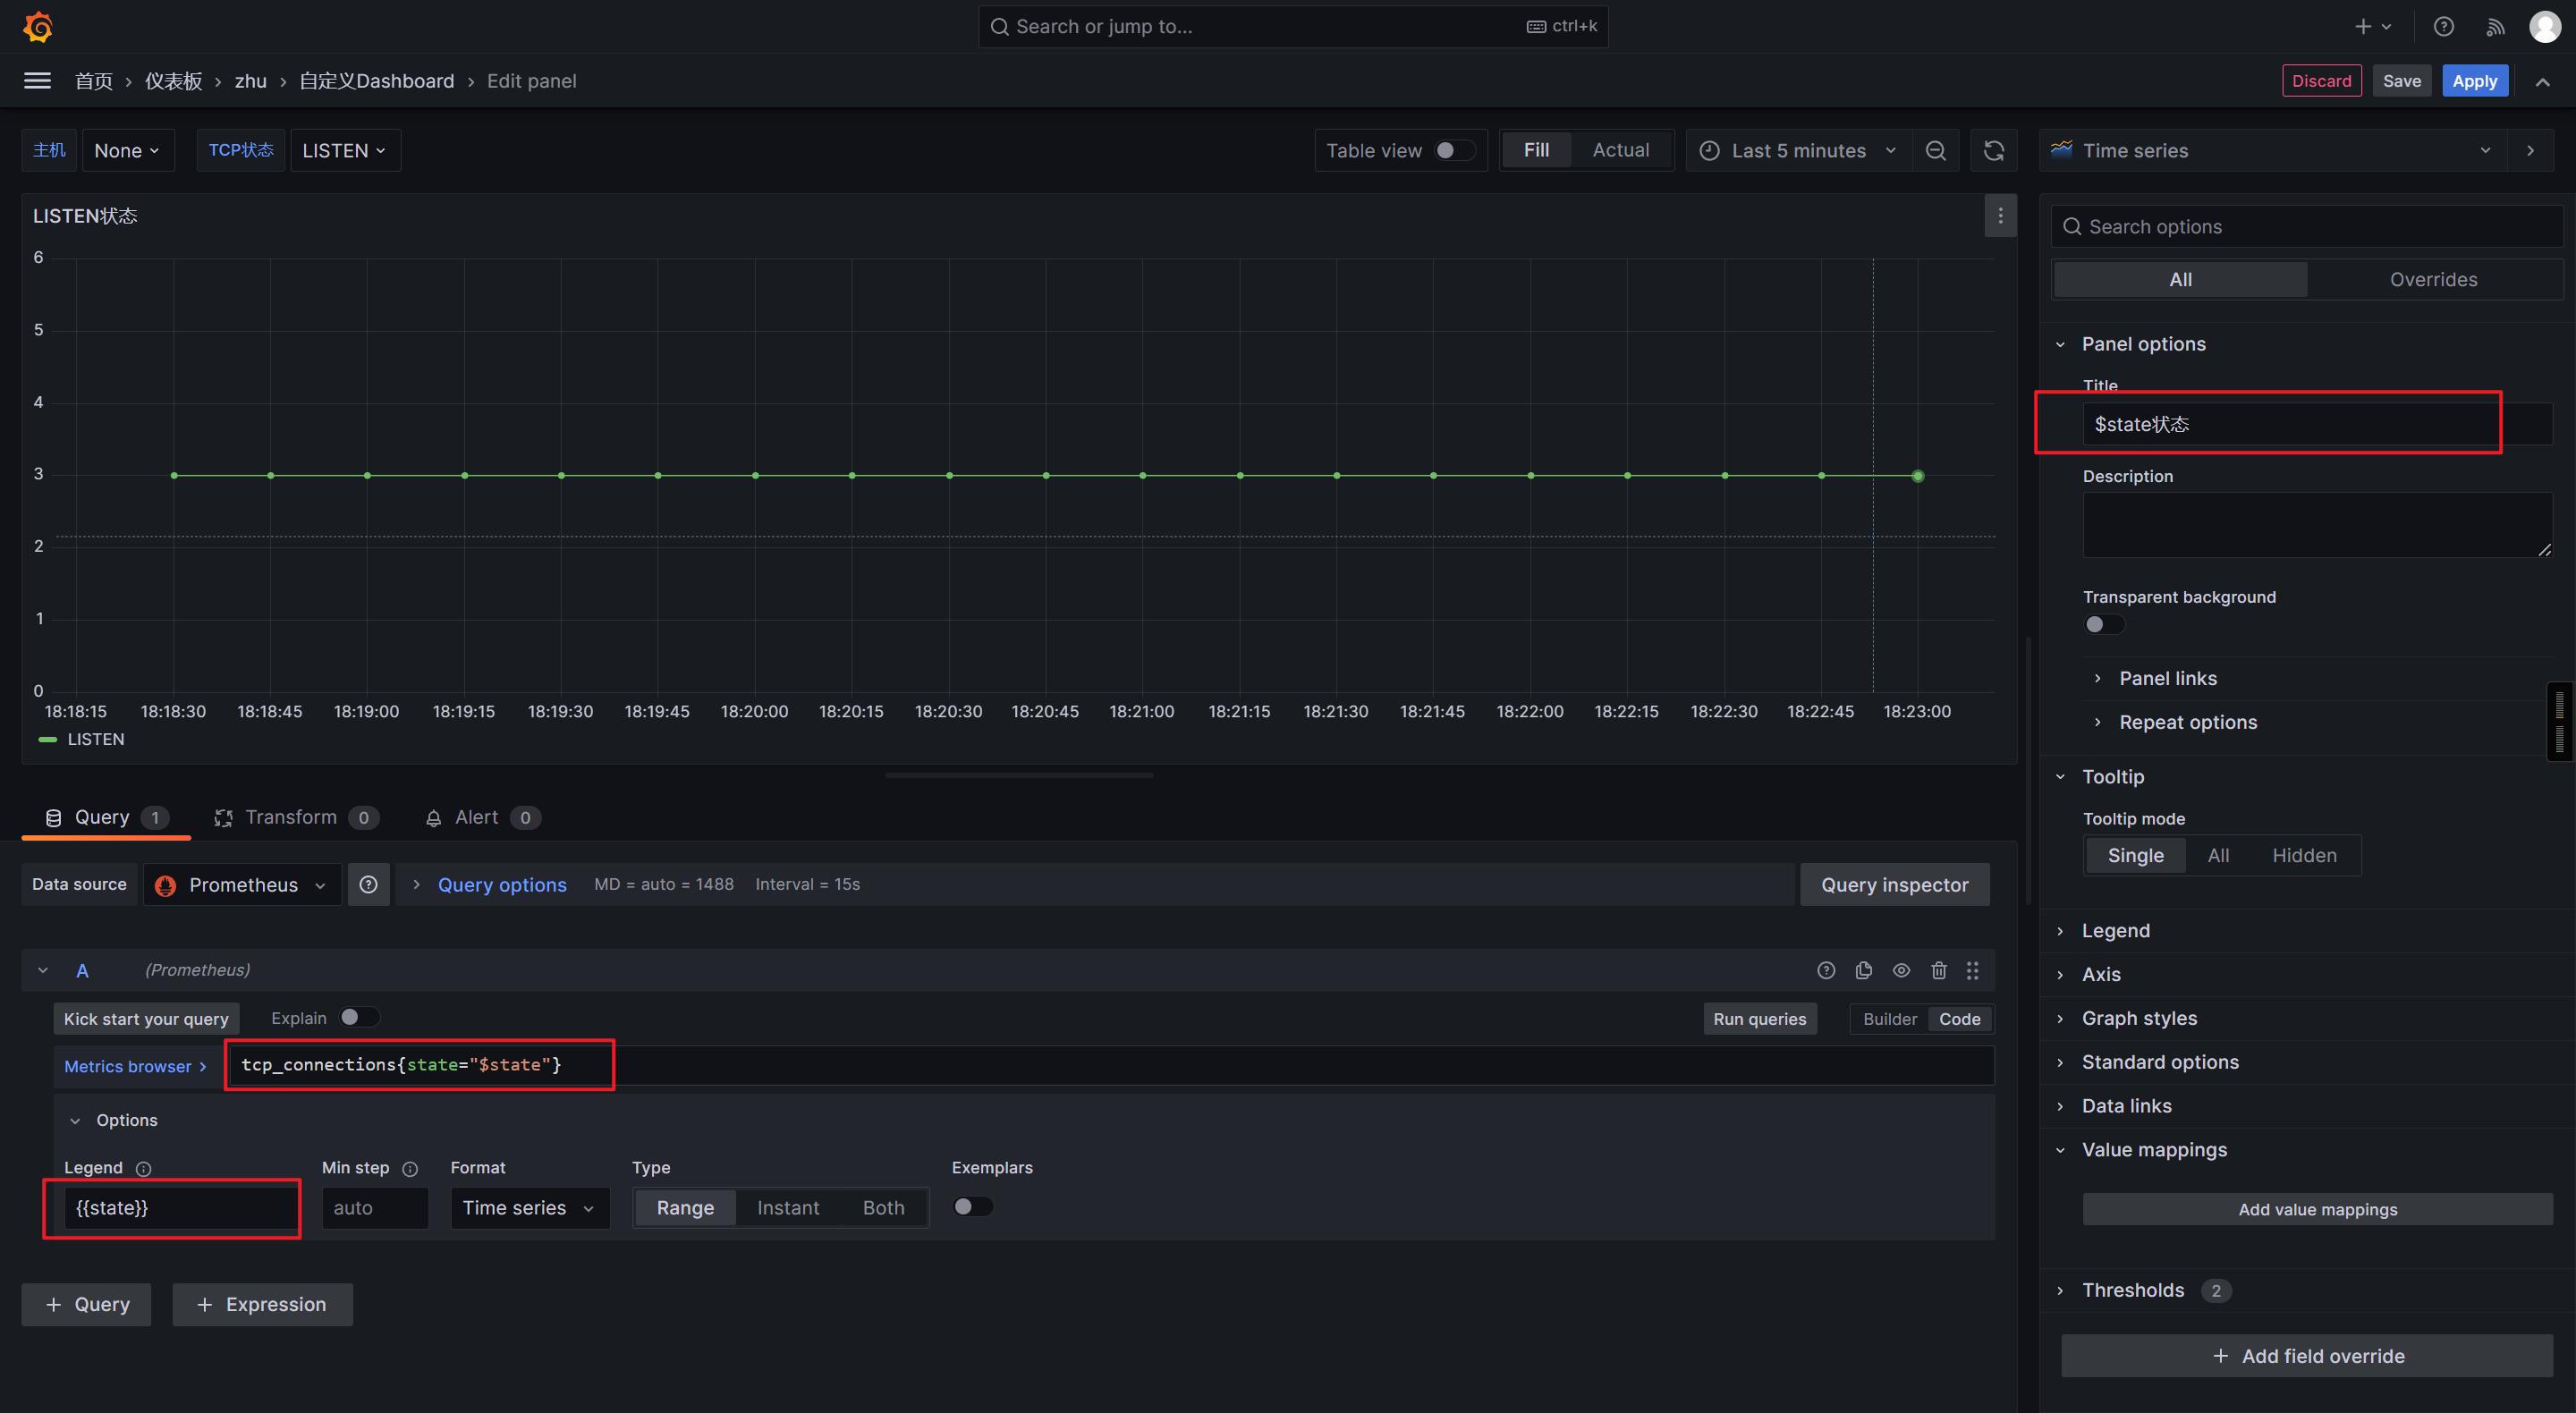
tcp_connections{state="$state"}
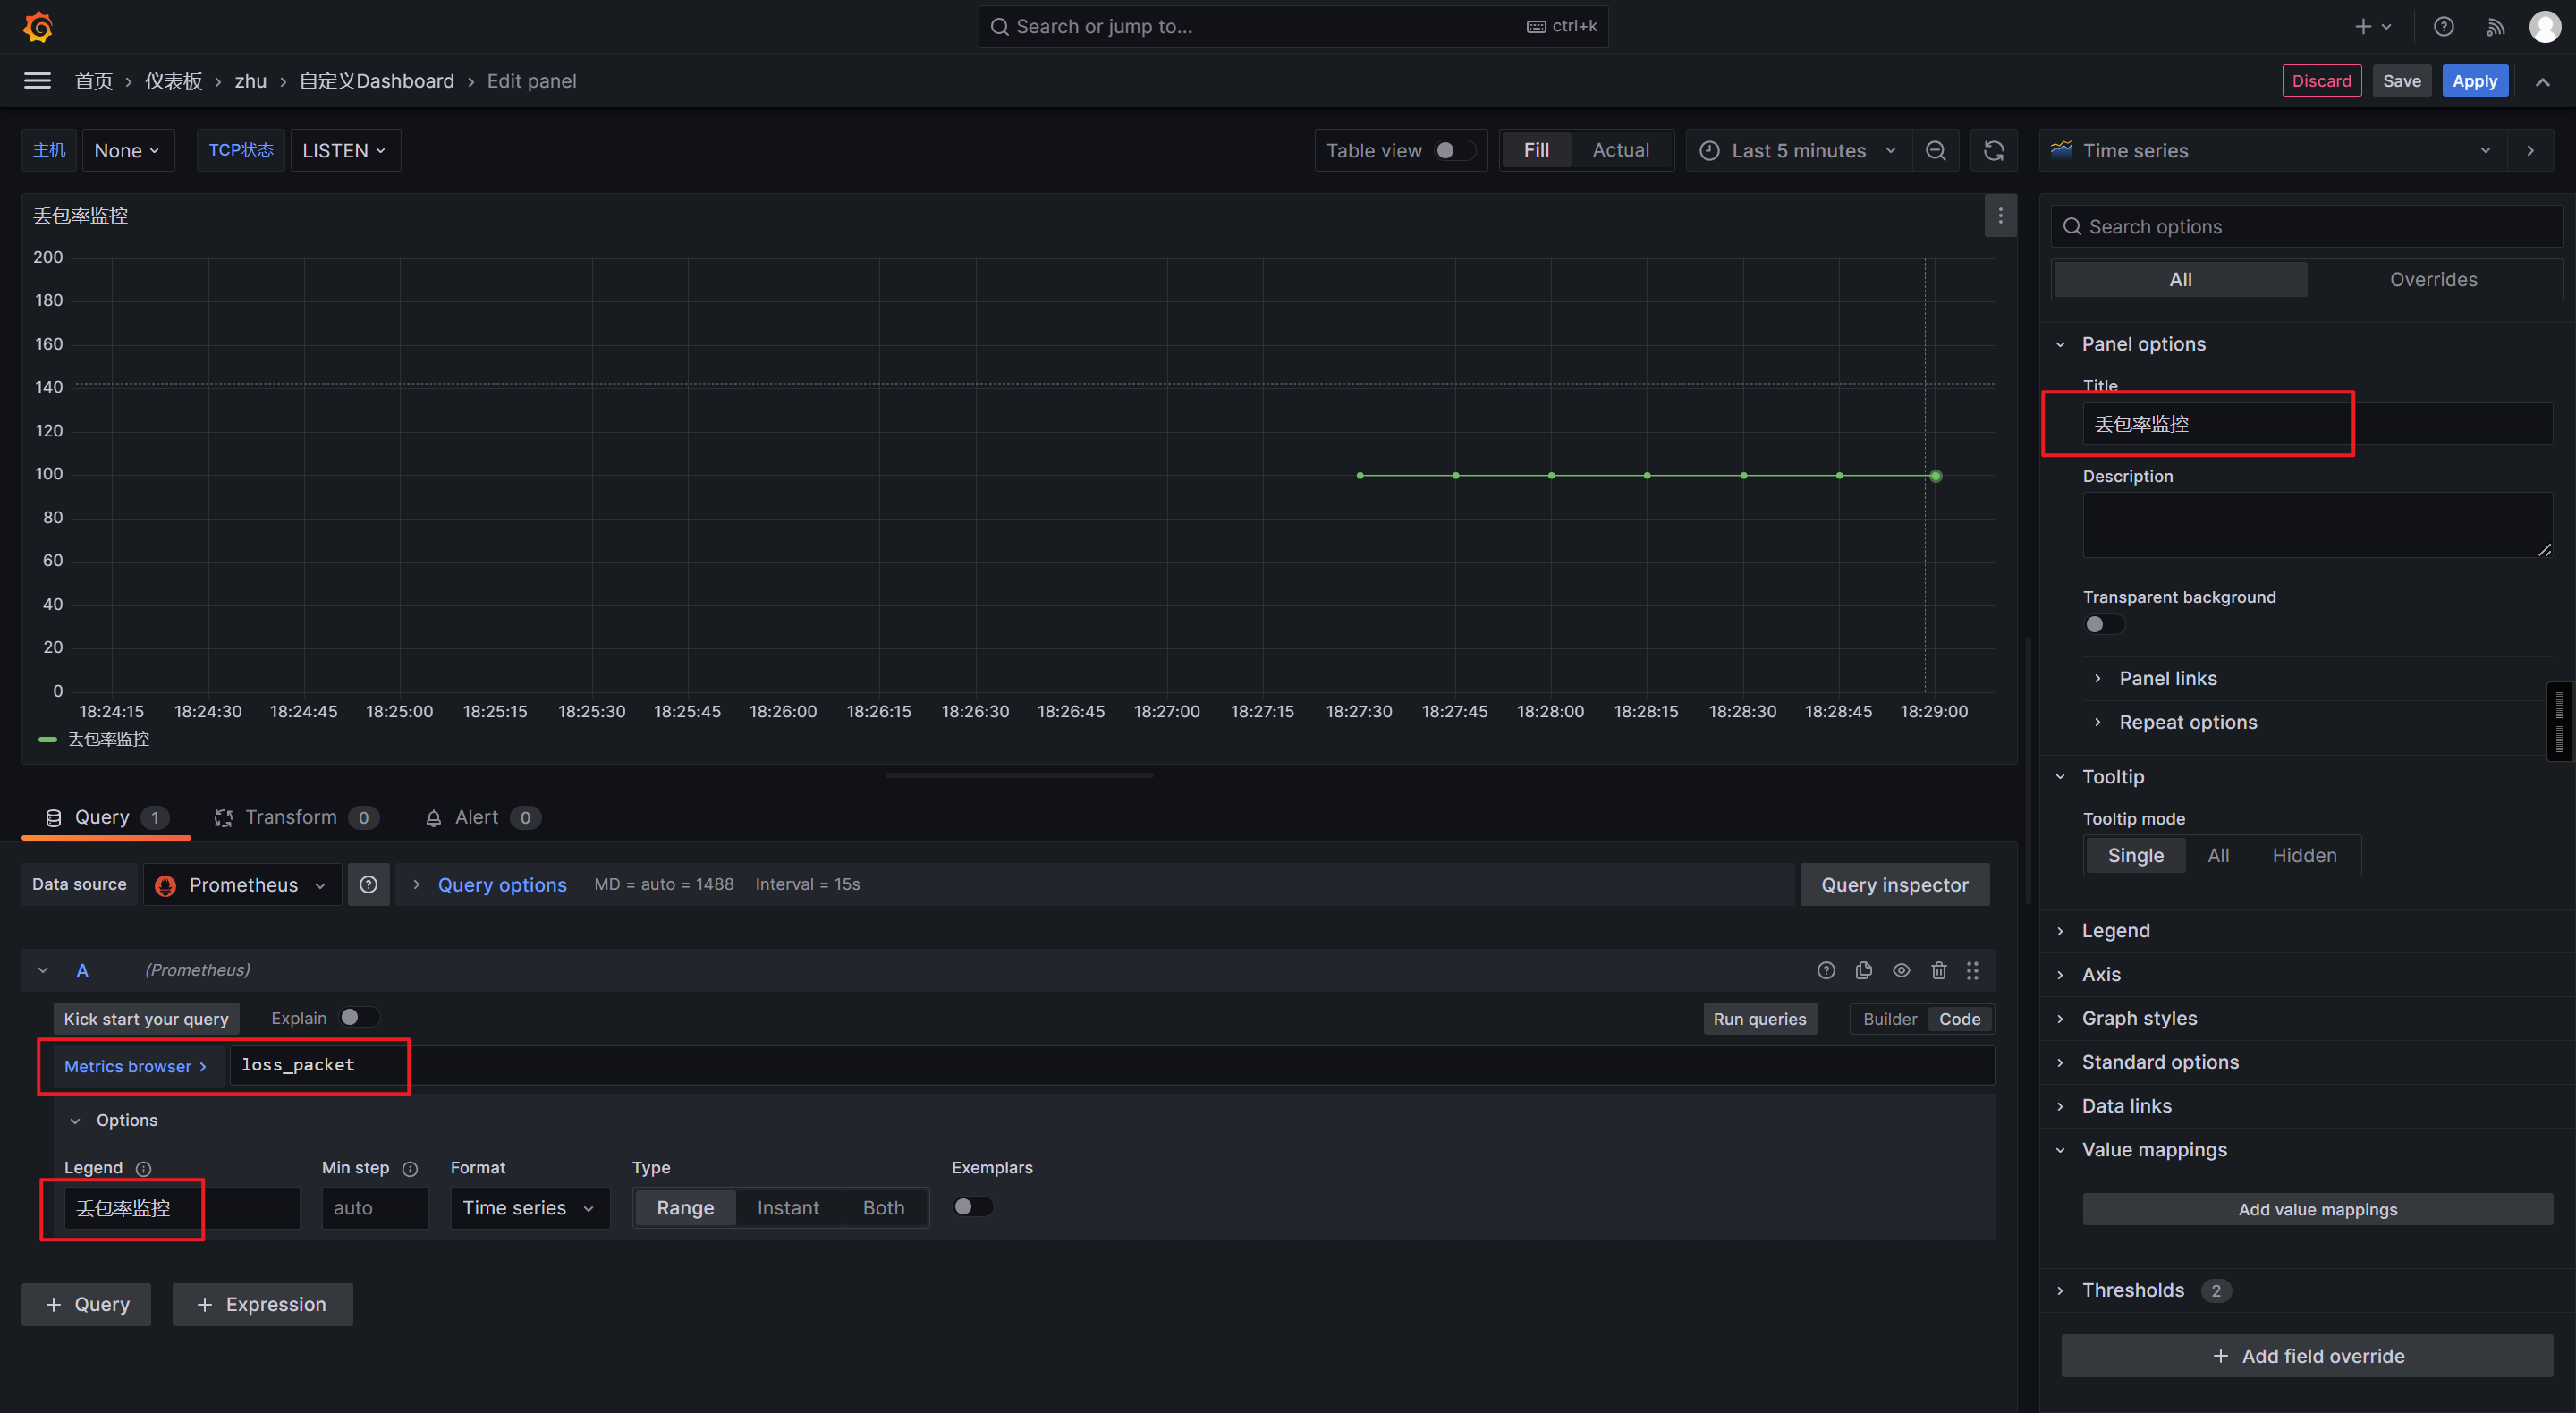
🌟网络的丢包率监控
编写监控脚本
#!/bin/bash
host="www.zhubl.xyz"loss=`ping $host -c 10 | grep packet | awk '{print $6}' | tr -d '%'`echo loss_packet $loss | curl --data-binary @-  http://10.0.0.42:9091/metrics/job/loss_packet/instance/10.0.0.41
发送测试数据
bash /usr/local/bin/loss_packet.sh
Grafana出图展示
🌟监控ES集群索引数量
编写监控脚本
#!/bin/bashpushgateway_url="http://10.0.0.42:9091/metrics/job/indices"indices=`curl -s https://10.0.0.91:9200/_cat/indices?v -u elastic:123456 -k | wc -l`echo indices_num $indices | curl --data-binary @- $pushgateway_url
发送数据
bash /usr/local/bin/es_index_num.sh
grafana出图展示