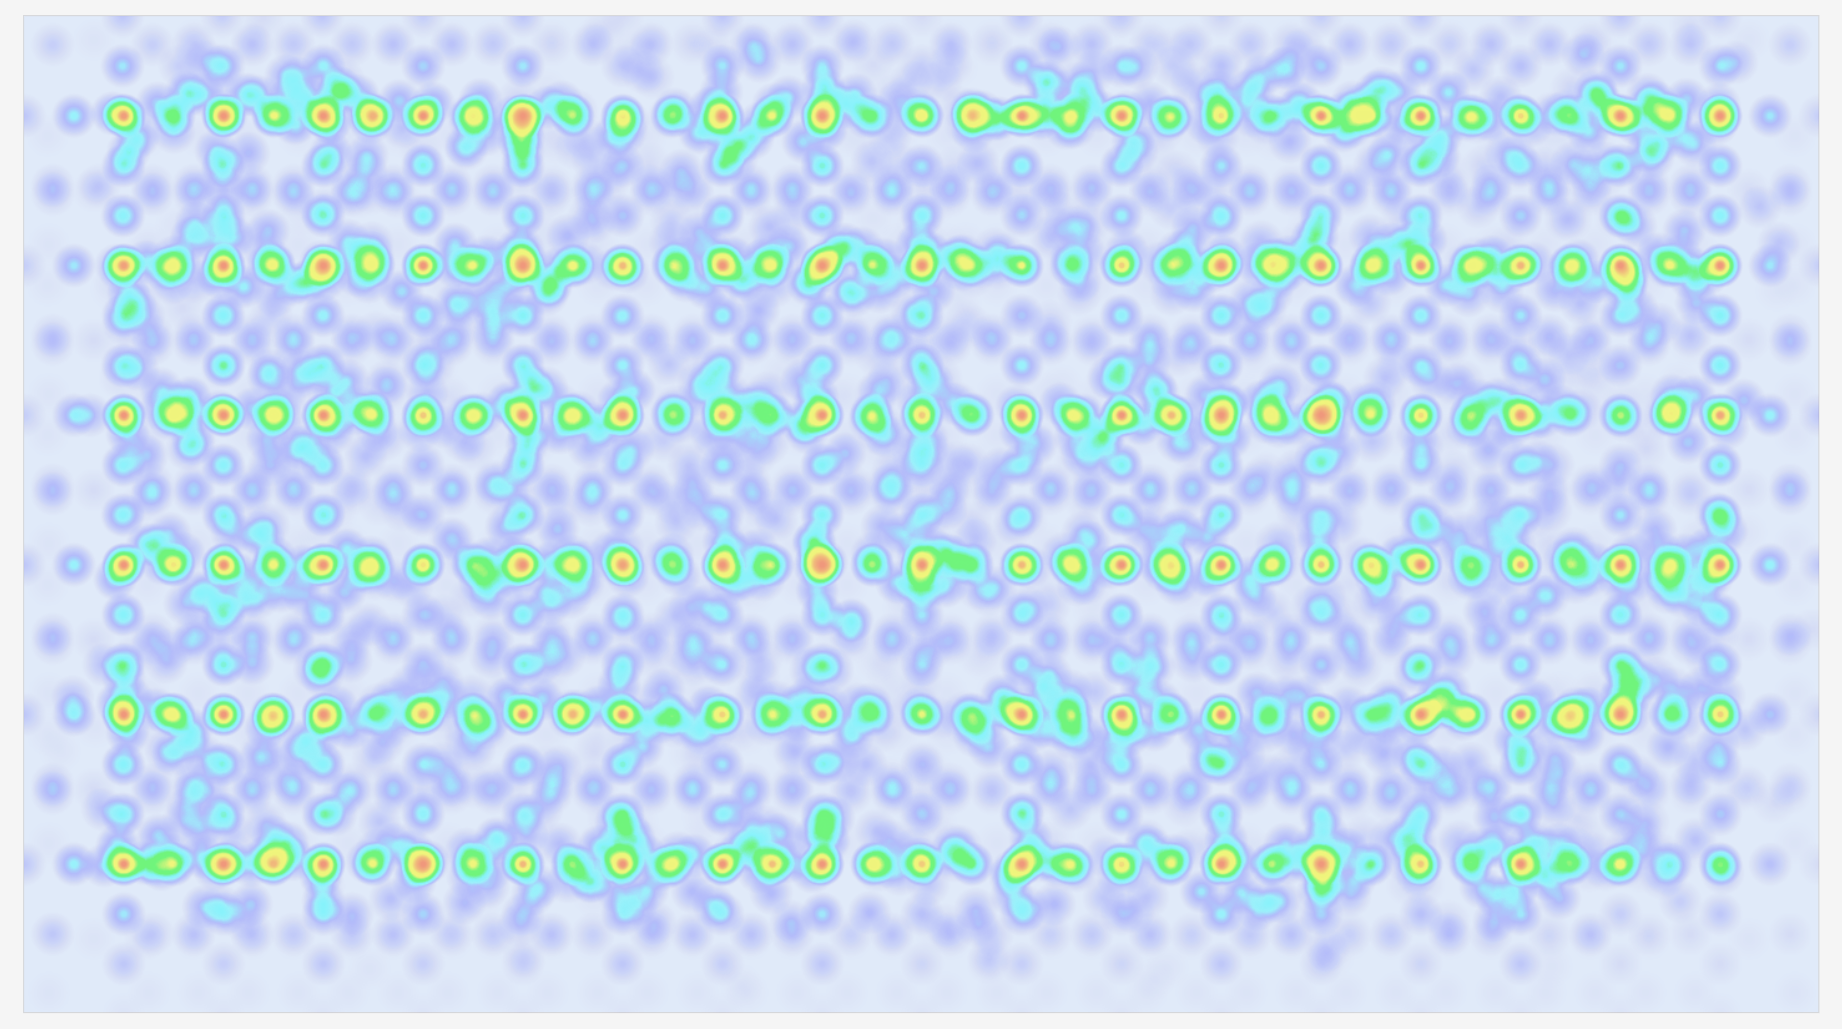
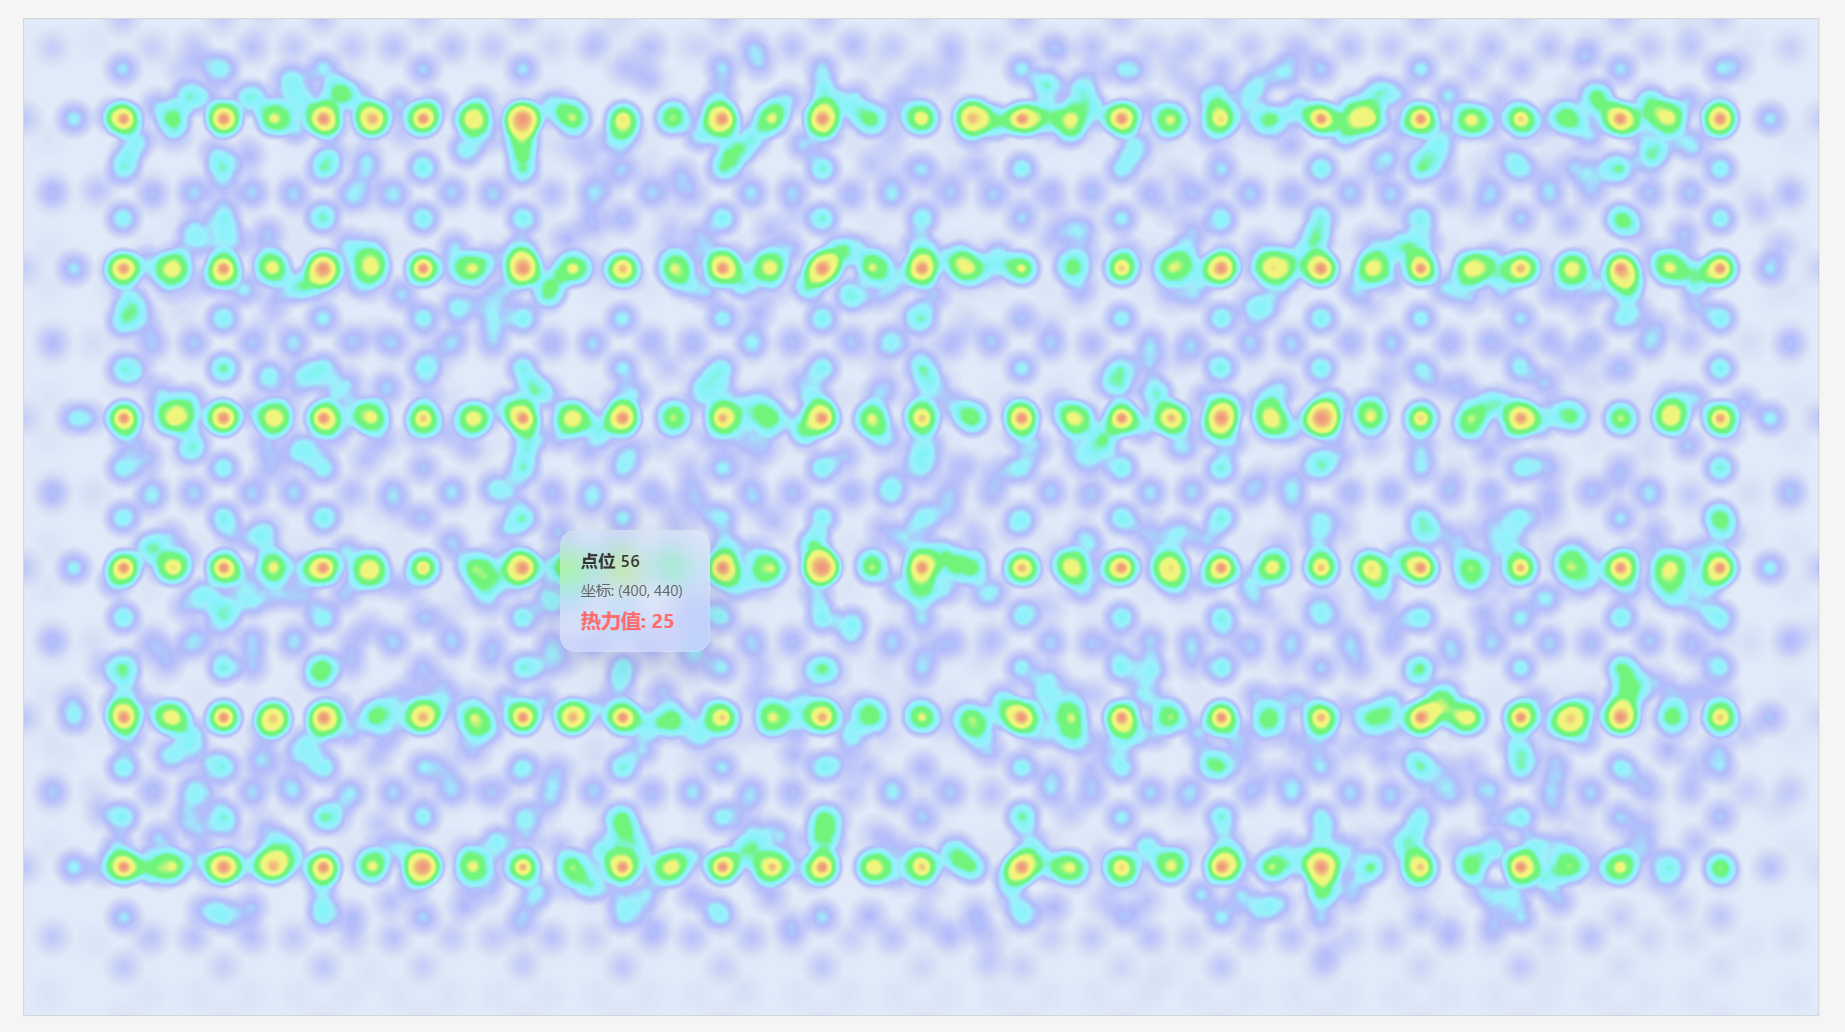
vue中通过heatmap.js实现热力图(多个热力点)热区展示(带鼠标移入弹窗)
直接上完整代码!记录实现方式
注意heatmap.min.js需要通过heatmap.js提供的下载地址进行下载,地址放在下边
url:heatmap GIT地址
<template><div class="heatmap-view" ref="heatmapContainer"></div>
</template><script lang="ts" setup>import { ref, onMounted } from 'vue';const heatmapContainer = ref<HTMLElement>();let heatmapInstance: any = null;let tooltipTimer: NodeJS.Timeout | null = null;// 固定的热力图数据 - 6行,每行17个点const fixedHeatmapData = [// 第1行数据{ x: 80, y: 80, value: 25 },{ x: 160, y: 80, value: 22 },{ x: 240, y: 80, value: 28 },{ x: 320, y: 80, value: 24 },{ x: 400, y: 80, value: 26 },{ x: 480, y: 80, value: 13 },{ x: 560, y: 80, value: 27 },{ x: 640, y: 80, value: 25 },{ x: 720, y: 80, value: 12 },{ x: 800, y: 80, value: 29 },{ x: 880, y: 80, value: 24 },{ x: 960, y: 80, value: 16 },{ x: 1040, y: 80, value: 23 },{ x: 1120, y: 80, value: 28 },{ x: 1200, y: 80, value: 15 },{ x: 1280, y: 80, value: 27 },{ x: 1360, y: 80, value: 24 },// 第2行数据{ x: 80, y: 200, value: 23 },{ x: 160, y: 200, value: 26 },{ x: 240, y: 200, value: 22 },{ x: 320, y: 200, value: 25 },{ x: 400, y: 200, value: 24 },{ x: 480, y: 200, value: 17 },{ x: 560, y: 200, value: 23 },{ x: 640, y: 200, value: 26 },{ x: 720, y: 200, value: 25 },{ x: 800, y: 200, value: 12 },{ x: 880, y: 200, value: 18 },{ x: 960, y: 200, value: 24 },{ x: 1040, y: 200, value: 26 },{ x: 1120, y: 200, value: 23 },{ x: 1200, y: 200, value: 17 },{ x: 1280, y: 200, value: 25 },{ x: 1360, y: 200, value: 24 },// 第3行数据{ x: 80, y: 320, value: 24 },{ x: 160, y: 320, value: 27 },{ x: 240, y: 320, value: 23 },{ x: 320, y: 320, value: 16 },{ x: 400, y: 320, value: 25 },{ x: 480, y: 320, value: 22 },{ x: 560, y: 320, value: 18 },{ x: 640, y: 320, value: 24 },{ x: 720, y: 320, value: 16 },{ x: 800, y: 320, value: 23 },{ x: 880, y: 320, value: 27 },{ x: 960, y: 320, value: 25 },{ x: 1040, y: 320, value: 24 },{ x: 1120, y: 320, value: 16 },{ x: 1200, y: 320, value: 23 },{ x: 1280, y: 320, value: 8 },{ x: 1360, y: 320, value: 25 },// 第4行数据{ x: 80, y: 440, value: 26 },{ x: 160, y: 440, value: 23 },{ x: 240, y: 440, value: 27 },{ x: 320, y: 440, value: 14 },{ x: 400, y: 440, value: 25 },{ x: 480, y: 440, value: 18 },{ x: 560, y: 440, value: 22 },{ x: 640, y: 440, value: 26 },{ x: 720, y: 440, value: 24 },{ x: 800, y: 440, value: 17 },{ x: 880, y: 440, value: 23 },{ x: 960, y: 440, value: 25 },{ x: 1040, y: 440, value: 16 },{ x: 1120, y: 440, value: 24 },{ x: 1200, y: 440, value: 18 },{ x: 1280, y: 440, value: 23 },{ x: 1360, y: 440, value: 26 },// 第5行数据{ x: 80, y: 560, value: 25 },{ x: 160, y: 560, value: 28 },{ x: 240, y: 560, value: 24 },{ x: 320, y: 560, value: 17 },{ x: 400, y: 560, value: 23 },{ x: 480, y: 560, value: 26 },{ x: 560, y: 560, value: 15 },{ x: 640, y: 560, value: 22 },{ x: 720, y: 560, value: 9 },{ x: 800, y: 560, value: 24 },{ x: 880, y: 560, value: 26 },{ x: 960, y: 560, value: 23 },{ x: 1040, y: 560, value: 17 },{ x: 1120, y: 560, value: 25 },{ x: 1200, y: 560, value: 24 },{ x: 1280, y: 560, value: 26 },{ x: 1360, y: 560, value: 18 },// 第6行数据{ x: 80, y: 680, value: 27 },{ x: 160, y: 680, value: 24 },{ x: 240, y: 680, value: 26 },{ x: 320, y: 680, value: 23 },{ x: 400, y: 680, value: 18 },{ x: 480, y: 680, value: 25 },{ x: 560, y: 680, value: 24 },{ x: 640, y: 680, value: 27 },{ x: 720, y: 680, value: 16 },{ x: 800, y: 680, value: 23 },{ x: 880, y: 680, value: 15 },{ x: 960, y: 680, value: 28 },{ x: 1040, y: 680, value: 24 },{ x: 1120, y: 680, value: 16 },{ x: 1200, y: 680, value: 25 },{ x: 1280, y: 680, value: 12 },{ x: 1360, y: 680, value: 14 },];// 生成密集的热力图数据,形成连片效果const generateHeatmapData = () => {const data: Array<{ x: number; y: number; value: number }> = [];// 为每个固定数据点生成多个数据点,形成连片效果fixedHeatmapData.forEach((fixedPoint, index) => {const baseValue = fixedPoint.value; // 使用固定值const pointsCount = 6; // 增加点数让分布更密集const spreadRadius = 120; // 减小扩散半径,让中心更突出// 首先添加中心点本身 - 确保中心点有最高值data.push({x: fixedPoint.x,y: fixedPoint.y,value: baseValue * 1.2, // 中心点值稍微提高,确保最亮});// 为中心点周围生成渐变填充点,让整体显示更自然for (let ring = 1; ring <= 3; ring++) {const ringRadius = (spreadRadius / 3) * ring;const ringPoints = ring * 4; // 每圈点数递增for (let i = 0; i < ringPoints; i++) {const angle = (i / ringPoints) * Math.PI * 2;const x = fixedPoint.x + Math.cos(angle) * ringRadius;const y = fixedPoint.y + Math.sin(angle) * ringRadius;// 确保点在容器范围内if (x >= 0 && x <= 1440 && y >= 0 && y <= 800) {// 根据距离中心的远近决定热力值 - 距离越远,热力值越低const distanceFromCenter = Math.sqrt(Math.pow(x - fixedPoint.x, 2) + Math.pow(y - fixedPoint.y, 2));const value = Math.max(1, baseValue * (1 - distanceFromCenter / spreadRadius) * 0.6);data.push({x: Math.floor(x),y: Math.floor(y),value: Math.floor(value),});}}}// 添加随机点增加自然感for (let i = 0; i < pointsCount; i++) {const angle = Math.random() * Math.PI * 2;const distance = Math.random() * spreadRadius;const x = fixedPoint.x + Math.cos(angle) * distance;const y = fixedPoint.y + Math.sin(angle) * distance;// 确保点在容器范围内if (x >= 0 && x <= 1440 && y >= 0 && y <= 800) {// 根据距离中心的远近决定热力值 - 距离越远,热力值越低const distanceFromCenter = Math.sqrt(Math.pow(x - fixedPoint.x, 2) + Math.pow(y - fixedPoint.y, 2));const value = Math.max(1, baseValue * (1 - distanceFromCenter / spreadRadius) * 0.4);data.push({x: Math.floor(x),y: Math.floor(y),value: Math.floor(value),});}}});// 添加连接点,让不同区域的热力图更好地融合for (let i = 0; i < fixedHeatmapData.length - 1; i++) {const currentPos = fixedHeatmapData[i];const nextPos = fixedHeatmapData[i + 1];// 在相邻位置之间添加一些连接点const midX = (currentPos.x + nextPos.x) / 2;const midY = (currentPos.y + nextPos.y) / 2;// const midValue = Math.floor((currentPos.value + nextPos.value) / 2); // 使用中间值for (let j = 0; j < 10; j++) {const angle = Math.random() * Math.PI * 2;const distance = Math.random() * 50; // 连接点范围const x = midX + Math.cos(angle) * distance;const y = midY + Math.sin(angle) * distance;if (x >= 0 && x <= 1440 && y >= 0 && y <= 800) {// 计算到两个相邻热力点的距离,取较小值const distToCurrent = Math.sqrt(Math.pow(x - currentPos.x, 2) + Math.pow(y - currentPos.y, 2));const distToNext = Math.sqrt(Math.pow(x - nextPos.x, 2) + Math.pow(y - nextPos.y, 2));const minDistance = Math.min(distToCurrent, distToNext);// 根据距离最近的热力点计算值,距离越远值越低const nearestValue = minDistance === distToCurrent ? currentPos.value : nextPos.value;const value = Math.max(1, nearestValue * (1 - minDistance / 120) * 0.5);data.push({x: Math.floor(x),y: Math.floor(y),value: Math.floor(value),});}}}return data;};// 添加热力点交互区域const addInteractiveAreas = () => {if (!heatmapContainer.value) return;// 为每个热力中心添加交互区域fixedHeatmapData.forEach((point, index) => {const interactiveArea = document.createElement('div');interactiveArea.style.position = 'absolute';interactiveArea.style.left = `${point.x - 20}px`; // 扩大交互区域interactiveArea.style.top = `${point.y - 20}px`;interactiveArea.style.width = '40px';interactiveArea.style.height = '40px';interactiveArea.style.borderRadius = '50%';interactiveArea.style.zIndex = '5';interactiveArea.style.cursor = 'pointer';interactiveArea.style.transition = 'all 0.3s ease';// 添加数据属性interactiveArea.setAttribute('data-index', index.toString());interactiveArea.setAttribute('data-value', point.value.toString());interactiveArea.setAttribute('data-x', point.x.toString());interactiveArea.setAttribute('data-y', point.y.toString());// 鼠标移入事件 - 添加延时interactiveArea.addEventListener('mouseenter', (e) => {// 清除之前的定时器if (tooltipTimer) {clearTimeout(tooltipTimer);tooltipTimer = null;}// 设置延时显示弹窗tooltipTimer = setTimeout(() => {showTooltip(e, point, index);}, 300); // 300ms延时});// 鼠标移出事件 - 立即隐藏interactiveArea.addEventListener('mouseleave', () => {// 清除定时器if (tooltipTimer) {clearTimeout(tooltipTimer);tooltipTimer = null;}hideTooltip();});heatmapContainer.value?.appendChild(interactiveArea);});};// 显示毛玻璃弹窗const showTooltip = (event: MouseEvent, point: any, index: number) => {// 移除已存在的弹窗hideTooltip();const tooltip = document.createElement('div');tooltip.id = 'heatmap-tooltip';tooltip.style.position = 'absolute';tooltip.style.zIndex = '1000';tooltip.style.pointerEvents = 'none';tooltip.style.transition = 'all 0.3s ease';tooltip.style.opacity = '0';tooltip.style.transform = 'translateY(10px)';// 毛玻璃效果tooltip.style.background = 'rgba(255, 255, 255, 0.15)';tooltip.style.backdropFilter = 'blur(10px)';tooltip.style.border = '1px solid rgba(255, 255, 255, 0.2)';tooltip.style.borderRadius = '12px';tooltip.style.padding = '12px 16px';tooltip.style.boxShadow = '0 8px 32px rgba(0, 0, 0, 0.1)';tooltip.style.minWidth = '120px';// 内容tooltip.innerHTML = `<div style="color: #333; font-size: 14px; font-weight: 600; margin-bottom: 4px;">点位 ${index + 1}</div><div style="color: #666; font-size: 12px; margin-bottom: 2px;">坐标: (${point.x}, ${point.y})</div><div style="color: #ff6b6b; font-size: 16px; font-weight: 700;">热力值: ${point.value}</div>`;if (heatmapContainer.value) {heatmapContainer.value.appendChild(tooltip);// 获取容器和弹窗尺寸const containerRect = heatmapContainer.value.getBoundingClientRect();const tooltipRect = tooltip.getBoundingClientRect();// 智能定位逻辑let left = point.x + 30;let top = point.y - 30;// 检查右边界if (left + tooltipRect.width > containerRect.width) {left = point.x - tooltipRect.width - 30; // 显示在左侧}// 检查左边界if (left < 0) {left = 10; // 贴左边}// 检查上边界if (top < 0) {top = point.y + 30; // 显示在下方}// 检查下边界if (top + tooltipRect.height > containerRect.height) {top = point.y - tooltipRect.height - 30; // 显示在上方}// 应用计算后的位置tooltip.style.left = `${left}px`;tooltip.style.top = `${top}px`;// 动画显示setTimeout(() => {tooltip.style.opacity = '1';tooltip.style.transform = 'translateY(0)';}, 10);}};// 隐藏弹窗const hideTooltip = () => {// 清除定时器if (tooltipTimer) {clearTimeout(tooltipTimer);tooltipTimer = null;}const existingTooltip = document.getElementById('heatmap-tooltip');if (existingTooltip) {existingTooltip.style.opacity = '0';existingTooltip.style.transform = 'translateY(10px)';setTimeout(() => {existingTooltip.remove();}, 300);}};// 初始化热力图const initHeatmap = () => {if (!heatmapContainer.value) return;console.log('开始初始化热力图...');// 动态加载本地的heatmap.min.jsconst script = document.createElement('script');script.src = '/src/utils/heatmap.min.js';script.onload = () => {console.log('heatmap.js 加载成功');// 创建热力图实例const h337 = (window as any).h337;if (!h337) {console.error('h337 未找到');return;}try {heatmapInstance = h337.create({container: heatmapContainer.value,radius: 18, // 增大半径,让热力扩散更广maxOpacity: 0.5, // 降低最大透明度,让整体颜色更淡minOpacity: 0,blur: 0.9, // 增加模糊度,让低值点更接近背景色gradient: {'0.0': 'rgba(75, 0, 130, 0.1)', // 蓝紫色 - 最冷,更淡'0.1': 'rgba(0, 0, 235, 0.2)', // 蓝紫色 - 稍微深一点'0.2': 'rgba(0, 0, 255, 0.3)', // 蓝色,更淡'0.3': 'rgba(0, 255, 255, 0.4)', // 青色,更淡'0.4': 'rgba(0, 255, 255, 0.5)', // 青色,更淡'0.5': 'rgba(0, 255, 0, 0.6)', // 绿色,更淡'0.6': 'rgba(0, 255, 0, 0.7)', // 绿色,更淡'0.7': 'rgba(255, 255, 0, 0.8)', // 黄色,更淡'0.8': 'rgba(255, 255, 0, 0.9)', // 黄色,更淡'0.9': 'rgba(255, 140, 0, 0.9)', // 橙色,更淡'1.0': 'rgba(255, 69, 0, 1)', // 橙红色 - 最热,稍微淡一点},});console.log('热力图实例创建成功');// 设置数据const data = generateHeatmapData();console.log('生成数据点数量:', data.length);// 找到最大热力值,确保中心点最亮const maxValue = Math.max(...data.map((d) => d.value));console.log('最大热力值:', maxValue);heatmapInstance.setData({max: maxValue, // 使用实际的最大值作为基准data: data,});console.log('热力图数据设置完成');// 添加交互区域addInteractiveAreas();} catch (error) {console.error('创建热力图时出错:', error);}};script.onerror = () => {console.error('heatmap.js 加载失败');};document.head.appendChild(script);};onMounted(() => {// 延迟一下确保DOM完全渲染setTimeout(() => {console.log('容器元素:', heatmapContainer.value);initHeatmap();}, 100);});
</script><style lang="less" scoped>.heatmap-view {margin: 30px auto;width: 1440px;height: 800px;border: 1px solid lightgray;position: relative;background-color: #e0eaf9;overflow: hidden;}/* 毛玻璃弹窗样式 */#heatmap-tooltip {font-family: -apple-system, BlinkMacSystemFont, 'Segoe UI', Roboto, sans-serif;backdrop-filter: blur(10px);-webkit-backdrop-filter: blur(10px);}/* 交互区域悬停效果 */.heatmap-view div[data-index] {transition: all 0.3s cubic-bezier(0.4, 0, 0.2, 1);}.heatmap-view div[data-index]:hover {background-color: rgba(255, 255, 255, 0.1);transform: scale(1.1);}
</style>