3D柱状图--自定义柱子颜色与legend一致(Vue3)
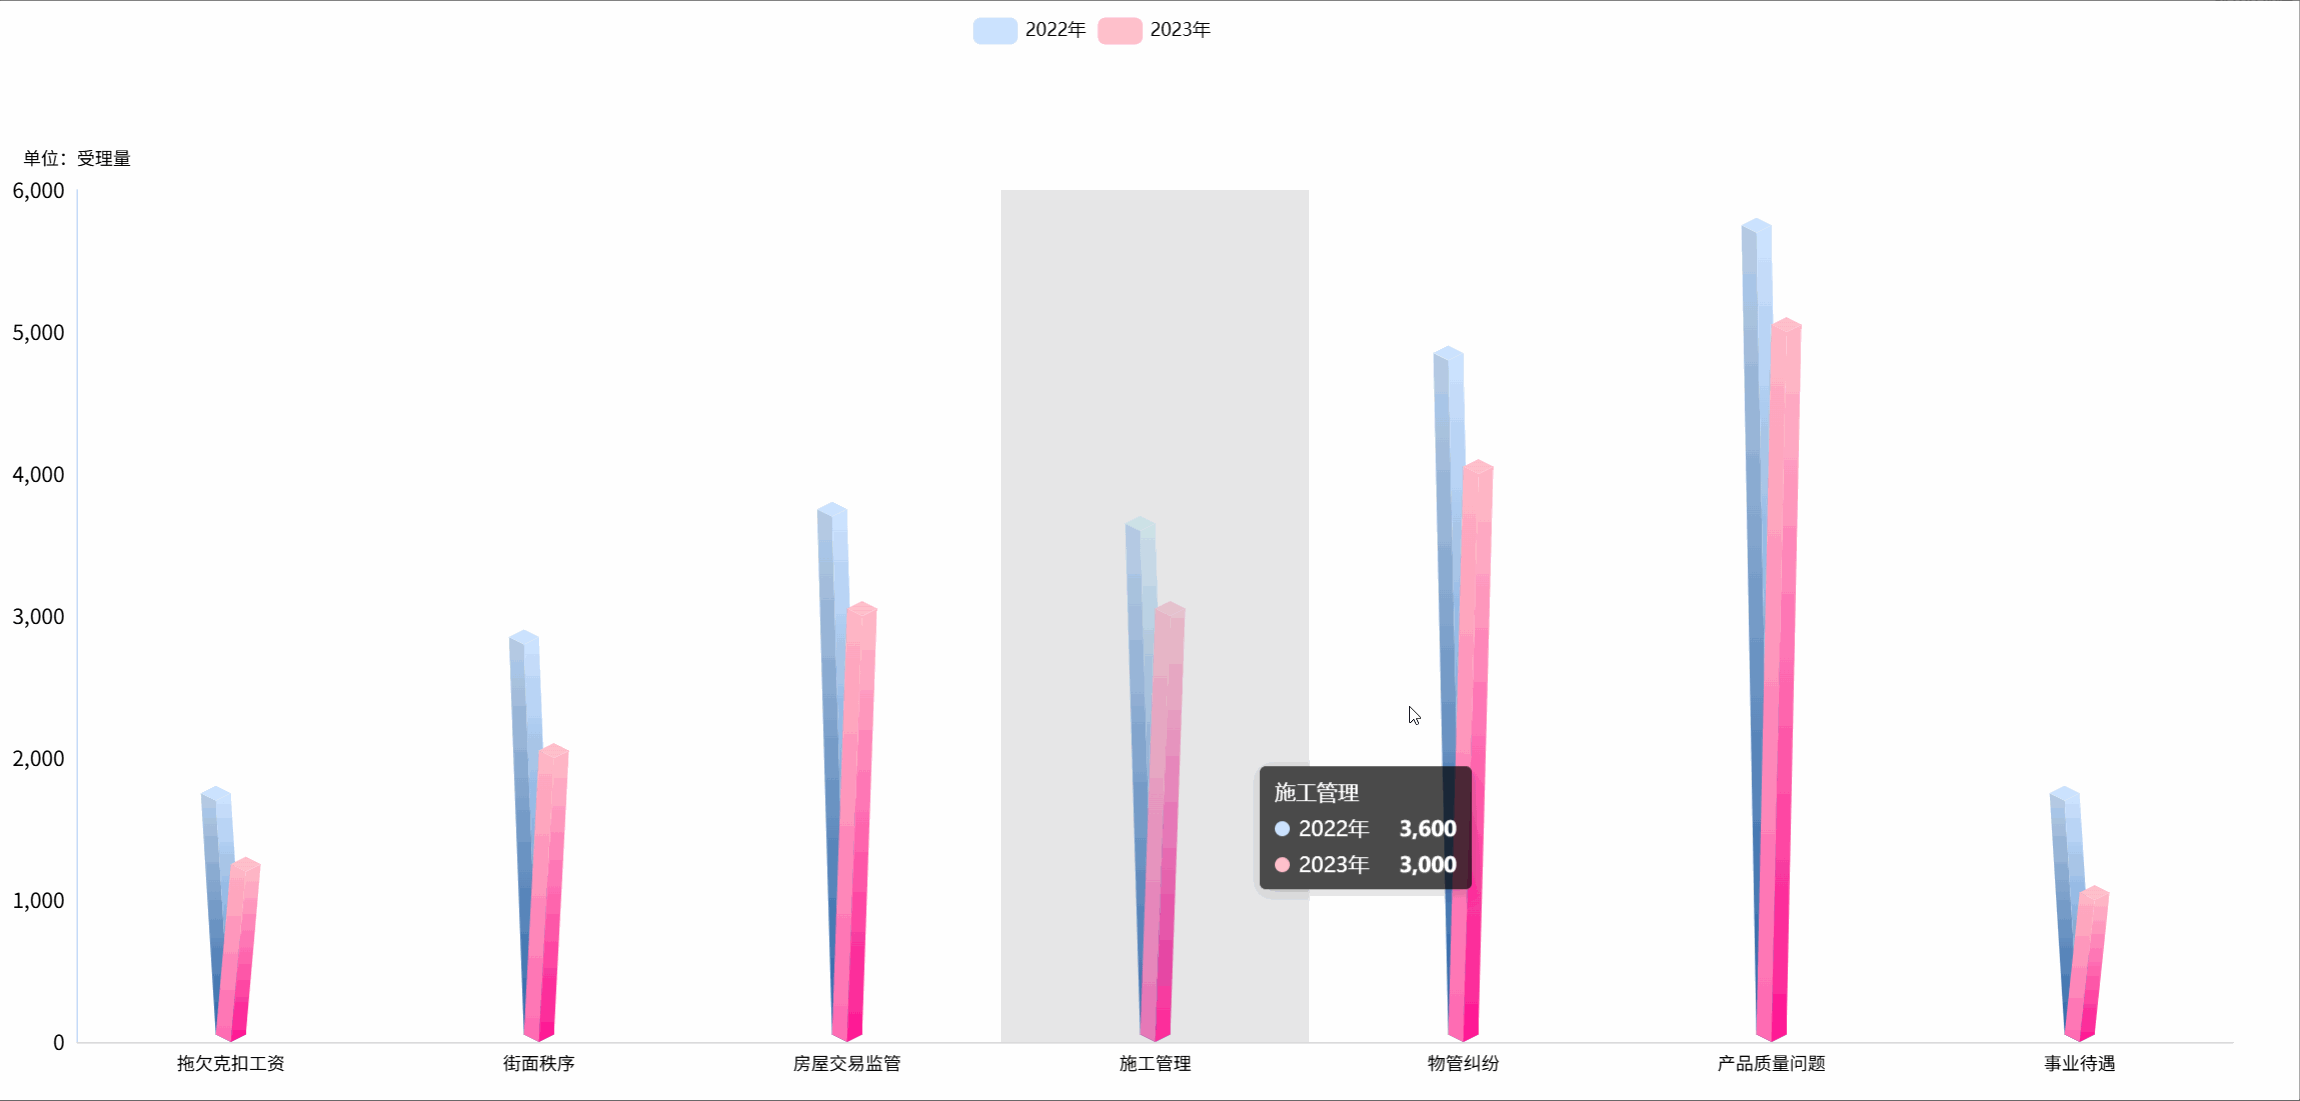
效果图:
功能:
1、实现3D柱状图
2、自定义柱状图颜色&legend 颜色一致
3、多条柱子展示
代码:
<template><div class="go-bar-3d"><v-chartref="vChartRef":option="option"style="width: 100%; height: 800px"></v-chart></div>
</template><script setup lang="ts">
import { ref, reactive, onMounted } from "vue";
import VChart from "vue-echarts";
import { use } from "echarts/core";
import { CanvasRenderer } from "echarts/renderers";
import { BarChart } from "echarts/charts";
import {DatasetComponent,GridComponent,TooltipComponent,LegendComponent,
} from "echarts/components";
import * as echarts from "echarts";use([DatasetComponent,CanvasRenderer,BarChart,GridComponent,TooltipComponent,LegendComponent,
]);// 获取图表实例
const vChartRef = ref();// 定义数据类型
interface ChartDataItem {x: string;y: number;s: string;
}// 模拟接口数据数组
const chartData = ref<ChartDataItem[]>([{x: "拖欠克扣工资",y: 1700,s: "2022年",},{x: "拖欠克扣工资",y: 1200,s: "2023年",},{x: "街面秩序",y: 2800,s: "2022年",},{x: "街面秩序",y: 2000,s: "2023年",},{x: "房屋交易监管",y: 3700,s: "2022年",},{x: "房屋交易监管",y: 3000,s: "2023年",},{x: "施工管理",y: 3600,s: "2022年",},{x: "施工管理",y: 3000,s: "2023年",},{x: "物管纠纷",y: 4800,s: "2022年",},{x: "物管纠纷",y: 4000,s: "2023年",},{x: "产品质量问题",y: 5700,s: "2022年",},{x: "产品质量问题",y: 5000,s: "2023年",},{x: "事业待遇",y: 1700,s: "2022年",},{x: "事业待遇",y: 1000,s: "2023年",},
]);const offsetX = 10;
const offsetY = 5;// 绘制左侧面
const CubeLeft = echarts.graphic.extendShape({shape: {x: 0,y: 0,},buildPath: (ctx: any, shape: any) => {const xAxisPoint = shape.xAxisPoint;const c0 = [shape.x, shape.y];const c1 = [shape.x - offsetX, shape.y - offsetY];const c2 = [xAxisPoint[0] - offsetX, xAxisPoint[1] - offsetY];const c3 = [xAxisPoint[0], xAxisPoint[1]];ctx.moveTo(c0[0], c0[1]).lineTo(c1[0], c1[1]).lineTo(c2[0], c2[1]).lineTo(c3[0], c3[1]).closePath();},
});// 绘制右侧面
const CubeRight = echarts.graphic.extendShape({shape: {x: 0,y: 0,},buildPath: (ctx: any, shape: any) => {const xAxisPoint = shape.xAxisPoint;const c1 = [shape.x, shape.y];const c2 = [xAxisPoint[0], xAxisPoint[1]];const c3 = [xAxisPoint[0] + offsetX, xAxisPoint[1] - offsetY];const c4 = [shape.x + offsetX, shape.y - offsetY];ctx.moveTo(c1[0], c1[1]).lineTo(c2[0], c2[1]).lineTo(c3[0], c3[1]).lineTo(c4[0], c4[1]).closePath();},
});// 绘制顶面
const CubeTop = echarts.graphic.extendShape({shape: {x: 0,y: 0,},buildPath: (ctx: any, shape: any) => {const c1 = [shape.x, shape.y];const c2 = [shape.x + offsetX, shape.y - offsetY];const c3 = [shape.x, shape.y - offsetX];const c4 = [shape.x - offsetX, shape.y - offsetY];ctx.moveTo(c1[0], c1[1]).lineTo(c2[0], c2[1]).lineTo(c3[0], c3[1]).lineTo(c4[0], c4[1]).closePath();},
});// 注册三个面图形
echarts.graphic.registerShape("CubeLeft", CubeLeft);
echarts.graphic.registerShape("CubeRight", CubeRight);
echarts.graphic.registerShape("CubeTop", CubeTop);// 获取系列名称
const getUniqueSeries = () => {return [...new Set(chartData.value.map((item) => item.s))];
};// 获取X轴值
const getUniqueXValues = () => {return [...new Set(chartData.value.map((item) => item.x))];
};// 定义颜色配置接口
interface ColorConfig {left: [string, string];right: [string, string];top: [string, string];
}// 颜色池
const colorPool: ColorConfig[] = [{left: ["#B8CDE6", "#2963A6"],right: ["#CDE4FF", "#447DBF"],top: ["#CCE4FF", "#CCE4FF"],},{left: ["#FFB6C1", "#FF69B4"],right: ["#FFC0CB", "#FF1493"],top: ["#FFC0CB", "#FFC0CB"],},{left: ["#98FB98", "#3CB371"],right: ["#90EE90", "#2E8B57"],top: ["#AFEEEE", "#AFEEEE"],},{left: ["#FFA07A", "#FF4500"],right: ["#FF7F50", "#FF6347"],top: ["#FFA500", "#FFA500"],},
];// 返回主颜色用于 legend
const getSeriesConfig = (index: number) => {const colorIndex = index % colorPool.length;const offset =index - Math.floor(index / 2) * 2 === 0? -(10 + Math.floor(index / 2) * 5): 10 + Math.floor(index / 2) * 5;return {colors: colorPool[colorIndex],offset: offset,// 提取主颜色用于 legend 显示mainColor: colorPool[colorIndex].top[0],};
};// 获取系列数据
const getSeries = () => {const seriesNames = getUniqueSeries();const xValues = getUniqueXValues();return seriesNames.map((seriesName, index) => {const config = getSeriesConfig(index);return {type: "custom",name: seriesName,// 添加 legend 相关配置legendHoverLink: true,// 为 legend 图标设置颜色itemStyle: {color: config.mainColor,},renderItem: (params: any, api: any) => {const location = api.coord([api.value(0), api.value(1)]);// 根据系列索引调整柱子位置避免重叠const adjustedLocation = [location[0] + config.offset, location[1]];return {type: "group",children: [{type: "CubeLeft",shape: {api,xValue: api.value(0),yValue: api.value(1),x: adjustedLocation[0],y: adjustedLocation[1],xAxisPoint: api.coord([api.value(0), 0]),},style: {fill: {type: "linear",x: 0,y: 0,x2: 0,y2: 1,colorStops: [{offset: 0,color: config.colors.left[0],},{offset: 1,color: config.colors.left[1],},],globalCoord: false,},},},{type: "CubeRight",shape: {api,xValue: api.value(0),yValue: api.value(1),x: adjustedLocation[0],y: adjustedLocation[1],xAxisPoint: api.coord([api.value(0), 0]),},style: {fill: {type: "linear",x: 0,y: 0,x2: 0,y2: 1,colorStops: [{offset: 0,color: config.colors.right[0],},{offset: 1,color: config.colors.right[1],},],globalCoord: false,},},},{type: "CubeTop",shape: {api,xValue: api.value(0),yValue: api.value(1),x: adjustedLocation[0],y: adjustedLocation[1],xAxisPoint: api.coord([api.value(0), 0]),},style: {fill: {type: "linear",x: 0,y: 0,x2: 0,y2: 1,colorStops: [{offset: 0,color: config.colors.top[0],},{offset: 1,color: config.colors.top[1],},],globalCoord: false,},},},],};},data: xValues.map((x, i) => {const item = chartData.value.find((d) => d.x === x && d.s === seriesName);return [x, item ? item.y : null];}),};});
};const option = reactive({grid: {top: "15%",left: "10%",bottom: "14%",right: "5%",},tooltip: {trigger: "axis",backgroundColor: "rgba(0,0,0,0.7)",borderWidth: 0,padding: 10,textStyle: {color: "#fff",},axisPointer: {type: "shadow",},},legend: {show: true,textStyle: {color: "#000",},top: "top",// 可选:自定义 legend 图标itemWidth: 30,itemHeight: 18,// 使用自定义 SVG 路径创建圆角矩形icon: "path://M 0 4 C 0 2 2 0 4 0 L 21 0 C 23 0 25 2 25 4 L 25 11 C 25 13 23 15 21 15 L 4 15 C 2 15 0 13 0 11 Z",},xAxis: {type: "category",axisLabel: {textStyle: {color: "#000",fontWeight: 400,fontSize: 12,fontFamily: "PingFangSC-Regular",},interval: 0,},axisTick: {show: false,},axisLine: {show: true,lineStyle: {type: "solid",color: "#DEDEDE",},},data: <any>[],},yAxis: {name: "单位:受理量",nameTextStyle: {color: "#000",fontSize: 12,fontFamily: "AlibabaPuHuiTi_2_55_Regular",fontWeight: 400,},type: "value",splitLine: {show: true,lineStyle: {color: "#ffffff4d",type: "dashed",},},axisTick: {show: false,inside: true,length: 7,},axisLine: {show: true,lineStyle: {color: "rgb(195,213,248)",},},axisLabel: {show: true,textStyle: {color: "#000",fontSize: 14,fontFamily: "ArialMT",fontWeight: 400,},},},series: <any>[],
});// 在组件挂载后初始化图表
onMounted(() => {// 填充xAxis数据option.xAxis.data = getUniqueXValues();// 填充series数据option.series = getSeries();
});
</script><style lang="scss" scoped>
.go-bar-3d {width: 100%;height: 800px;
}
</style>