【R语言】单细胞数据整合质量评估(3)
单细胞数据整合质量评估是确保整合效果可靠性和生物学意义的关键步骤。本期基于“【R语言】多样本单细胞分析-SCTransform+Harmony方案(2)”所分析的单细胞数据,给大家介绍如何对单细胞数据进行整合质量评估。
一、概念
整合质量评估旨在验证不同批次或条件的数据在整合后是否成功消除了批次效应,同时保留了生物学相关的细胞异质性。
1.核心目标
Ø去除批次效应:确保不同样本/实验条件的细胞在整合后不再因技术差异而分离。
Ø保留生物学差异:确保整合过程不会掩盖真实的细胞类型或状态差异。
Ø验证整合效果:通过统计指标和可视化方法量化整合效果。
2. 常用评估指标与方法
(1)kBET(K-nearest Batch Effect Test)
目的:评估批次效应是否被有效去除。
指标:
ØkBET.observed > 0.8 :表示批次效应已被有效去除(理想结果)。
ØkBET.observed < 0.5:批次效应未消除,需重新调整整合策略(如增加锚点数量或更换整合方法)。
ØkBET.expected 为随机情况下的预期值。若 observed ≈ expected,说明批次效应已消除;若 observed << expected,说明批次效应仍存在。
(2) LISI(Local Inverse Simpson’s Index)
目的:量化局部批次混合度和生物条件分离度。
指标:
ØiLISI(批次混合度)值越高(> 1.5):批次标签在局部区域充分混合(批次效应小)。
ØiLISI 低(< 1.5):批次混合效果差,可能是由于降维方法(如UMAP/t-SNE)参数设置不当(如n_neighbors过小)导致。
ØcLISI(条件分离度)值越低(< 1.2),表示生物条件差异越明显。
ØcLISI 高(> 1.5):生物条件未分离(可能丢失生物学信息)。可能是整合过程过度校正,导致生物差异丢失。
(3) ASW(Average Silhouette Width)
目的:评估聚类质量或生物条件(如细胞类型)的分离度。
指标:
ØASW > 0.4:聚类效果良好(簇内紧密,簇间分离)。
ØASW < 0.2:聚类效果差(簇间重叠严重),可能是由于聚类分辨率设置不当或数据降维质量差导致。
ØASW 接近 0:数据无明显聚类结构。
ØDevelopmental Stage ASW > 0.5 :表示发育阶段分离度高(保留生物学动态过程)。
ØDevelopmental Stage ASW 过低,可能是整合方法破坏了细胞状态的连续性(如 Harmony 参数过激)导致。
| 评估类型 | 指标 | 理想值 |
| 批次混合 | kBET接受率 | >80% |
| iLISI | >1.5 | |
| 图连接度 | <0.5 | |
| 生物保留 | cLISI | <1.2 |
| 阶段ASW | >0.5 | |
| 批次熵 | >2.0 | |
| 聚类质量 | ASW | >0.4 |
| 轮廓系数 | >0.25 |
二、单细胞分析流程—整合质量评估
#####加载包#####
library(Seurat)
#####使用readRDS函数导入数据#####
remove(list = ls()) #清除 Global Environment
getwd()  #查看当前工作路径
setwd("D:/Rdata/jc/单细胞演示数据/10xGenomics/多样本演示数据(1)")  #设置需要的工作路径
list.files()  #查看当前工作目录下的文件
merged_seurat <- readRDS("integrated_merged_seurat_20250808_2040.rds")  # 替换为实际文件路径
# 验证导入的对象
class(merged_seurat)  # 应显示 "Seurat"
print(merged_seurat)  # 查看对象摘要信息
# 检查基本属性
dim(merged_seurat)           # 基因数 x 细胞数
colnames(merged_seurat)       # 前几个细胞ID
rownames(merged_seurat)       # 前几个基因名
# 检查元数据
head(merged_seurat@meta.data) # 查看元数据前几行
colnames(merged_seurat@meta.data) # 检查元数据列名
sample_dist <- table(merged_seurat$orig.ident) # 查看样本分布
print(sample_dist)
# 检查Assay数据
DefaultAssay(merged_seurat)  # 默认使用的assay
Assays(merged_seurat)        # 所有存在的assay
merged_seurat[["RNA"]]       # 查看RNA assay
###可视化###
#样本分布
sample_plot <- ggplot(data.frame(Sample = names(sample_dist), Count = as.numeric(sample_dist)),aes(x = reorder(Sample, -Count), y = Count, fill = Sample)) +geom_bar(stat = "identity") +geom_text(aes(label = Count), vjust = -0.5) +labs(title = "样本细胞数量分布", x = "样本", y = "细胞数量") +theme_minimal() +theme(legend.position = "none",axis.text.x = element_text(angle = 45, hjust = 1))
#####008整合质量评估#####
###加载包###
if (!require("lisi")) remotes::install_github("immunogenomics/lisi")
library(lisi)
library(kBET)
library(cluster)
library(factoextra)
library(dplyr)
library(ggplot2)
library(ggpubr) # 用于组合图表
###数据准备###
set.seed(123) # 确保可重复性
harmony_dims <- 1:10 # 根据肘部图调整
harmony_emb <- Embeddings(merged_seurat, "harmony")[, 1:length(harmony_dims)]
sample_size <- min(5000, nrow(harmony_emb))
sub_idx <- sample(nrow(harmony_emb), size = sample_size)
sub_emb <- harmony_emb[sub_idx, ]
sub_clusters <- merged_seurat$SCT_snn_res.0.6[sub_idx]
### 批次混合评估 ###
# kBET评估 #
kbet_result <- kBET(df = harmony_emb,batch = merged_seurat$sample_name,plot = FALSE,heuristic = TRUE, # 内存优化k0 = 100, # 增加邻居数n_repeat = 10 # 增加重复次数)
kbet_acceptance <- round(kbet_result$stats$kBET.observed*100, 1)
cat(paste("kBET acceptance rate:", kbet_acceptance, "%\n"))
# 计算整体kBET接受率(取各批次平均值)
overall_kbet_acceptance <- round(mean(kbet_result$stats$kBET.observed) * 100, 1) # 计算整体kBET接受率(取各批次平均值)
# 计算kBET效应大小
kbet_effect_size <- (mean(kbet_result$stats$kBET.observed) - kbet_result$stats$kBET.expected[1]) / sd(kbet_result$stats$kBET.observed)
# kBET结果显著性检验
kbet_pvalue <- t.test(x = kbet_result$stats$kBET.observed,mu = kbet_result$stats$kBET.expected[1],alternative = "greater"
)$p.value
# kBET置信区间
kbet_ci <- t.test(kbet_result$stats$kBET.observed)$conf.int# LISI评估 #
lisi_scores <- compute_lisi(X = sub_emb,meta_data = data.frame(Batch = merged_seurat$sample_name[sub_idx],Group = merged_seurat$group[sub_idx],perplexity = 30 # 必须指定,通常取n_cells/100),label_colnames = c("Batch", "Group"))
ilisi_batch <- median(lisi_scores$Batch) # 批次混合度(越高越好)
clisi_group <- median(lisi_scores$Group) # 生物条件分离度(越低越好)
print(length(ilisi_batch))
print(length(clisi_group))
# LISI置信区间
ilisi_ci <- quantile(lisi_scores$Batch, probs = c(0.025, 0.975))
clisi_ci <- quantile(lisi_scores$Group, probs = c(0.025, 0.975))
# 添加LISI方向性检验
ilisi_pvalue <- wilcox.test(lisi_scores$Batch, mu=1.2, alternative="greater")$p.value
clisi_pvalue <- wilcox.test(lisi_scores$Group, mu=1.0, alternative="less")$p.value### 聚类质量评估 ###
# ASW评估 #
sub_dist <- dist(sub_emb)
sub_sil <- silhouette(as.numeric(factor(sub_clusters)), sub_dist)
asw_score <- mean(sub_sil[, 3])
print(length(asw_score))
cat(paste("Subsampled ASW (n=", sample_size, "):", round(asw_score, 3), "\n"))
# 发育阶段ASW #
stage_sil <- silhouette(as.numeric(factor(merged_seurat$group[sub_idx])), sub_dist)
stage_asw <- mean(stage_sil[, 3])
print(length(stage_asw))
###质量指标输出(统一统计)###
cat("\n===== INTEGRATION QUALITY REPORT =====\n")
cat(paste("kBET acceptance rate:", kbet_acceptance, "%\n"))
cat(paste("Clustering ASW:", round(asw_score, 3), "\n"))
cat(paste("Developmental Stage ASW:", round(stage_asw, 3), "\n"))
cat(paste("iLISI (Batch Mixing):", round(ilisi_batch, 3), "\n"))
cat(paste("cLISI (Stage Separation):", round(clisi_group, 3), "\n"))
cat("=====================================\n")### 可视化 ###
# kBET图 #
# 提取kBET统计结果
kbet_df <- as.data.frame(kbet_result$stats) %>%mutate(category = rownames(.)) #保留批次名称
p <- ggplot(kbet_df, aes(x = category, y = kBET.observed)) +geom_bar(stat = "identity", fill = "steelblue", width = 0.7) +geom_hline(yintercept = 0.8, linetype = "dashed", color = "red", linewidth = 1) +labs(title = paste0("kBET Batch Acceptance (Overall: ", kbet_acceptance, "%)"),x = "Batch",y = "Acceptance Rate") +theme_minimal() +theme(axis.text.x = element_text(angle = 45, hjust = 1, size = 10),plot.title = element_text(size = 14, face = "bold"),panel.grid.major.x = element_blank()) +scale_y_continuous(limits = c(0, 1), breaks = seq(0, 1, 0.2)) +geom_text(aes(label = round(kBET.observed, 2)), # 添加文本标签vjust = -0.5, size = 3.5, color = "darkblue")
ggsave("kBET_validation.pdf", plot = p, width = 10, height = 6) #保存图形# LISI图 #
lisi_df <- data.frame(CellID = rownames(sub_emb),iLISI = lisi_scores$Batch,cLISI = lisi_scores$Group
)ilisi_plot <- ggplot(lisi_df, aes(x = iLISI)) +geom_density(fill = "#4e79a7", alpha = 0.7) +geom_vline(xintercept = 1.0, linetype = "dashed", color = "red", linewidth = 1) +geom_vline(xintercept = 1.5, linetype = "solid", color = "darkgreen", linewidth = 1) +annotate("text", x = 1.5, y = 0, label = "Target (1.5)", vjust = -1, hjust = -0.1, color = "darkgreen") +labs(title = paste("iLISI Batch Mixing =", round(ilisi_batch, 3)),subtitle = "Higher values indicate better batch mixing",x = "iLISI Score", y = "Density") +theme_minimal() +theme(plot.title = element_text(hjust = 0.5))clisi_plot <- ggplot(lisi_df, aes(x = cLISI)) +geom_density(fill = "#e15759", alpha = 0.7) +geom_vline(xintercept = 1.0, linetype = "dashed", color = "red", linewidth = 1) +geom_vline(xintercept = 1.2, linetype = "solid", color = "darkgreen", linewidth = 1) +annotate("text", x = 1.2, y = 0, label = "Target (1.2)", vjust = -1, hjust = -0.1, color = "darkgreen") +labs(title = paste("cLISI Stage Separation =", round(clisi_group, 3)),subtitle = "Lower values indicate better biological separation",x = "cLISI Score", y = "Density") +theme_minimal() +theme(plot.title = element_text(hjust = 0.5))
# ASW图 #
asw_plot <- fviz_silhouette(sub_sil) +ggtitle(paste0("Silhouette Plot (ASW = ", round(asw_score, 3), ")")) +theme_minimal()
ggsave("ASW_silhouette_plot.pdf", width = 10, height = 6)
# 阶段分离图 #
stage_plot <- fviz_silhouette(stage_sil) +ggtitle(paste0("Developmental Stage Separation (ASW = ", round(stage_asw, 3), ")")) +scale_fill_brewer(palette = "Set2") +theme_minimal()
ggsave("Stage_Separation_ASW.pdf", width = 10, height = 6)
### 创建综合评估报告 ###
integration_report <- data.frame(Metric = c("kBET Acceptance", "Clustering ASW", "Developmental Stage ASW", "iLISI (Batch Mixing)", "cLISI (Stage Separation)"),Value = c(overall_kbet_acceptance/100, asw_score, stage_asw, ilisi_batch, clisi_group),Interpretation = c(">0.8 = Good", ">0.4 = Good", ">0.5 = Good",">1.5 = Good", "<1.2 = Good"),pValue = c(kbet_pvalue, NA, NA,wilcox.test(lisi_scores$Batch, mu = 1.0, alternative = "greater")$p.value,wilcox.test(lisi_scores$Group, mu = 1.0, alternative = "less")$p.value),Effect_Size = c(kbet_effect_size, NA, NA, median(lisi_scores$Batch) - 1,1 - median(lisi_scores$Group)),CI_Lower = c(kbet_ci[1], NA, NA, ilisi_ci[1], clisi_ci[1]),CI_Upper = c(kbet_ci[2], NA, NA, ilisi_ci[2], clisi_ci[2]),Reference = c("Buttner et al, Nat Methods 2019", "Luecken et al, Mol Syst Biol 2022","Tran et al, Nat Methods 2020","Korsunsky et al, Nat Methods 2019","Korsunsky et al, Nat Methods 2019")
)
# 格式化数值显示
integration_report <- integration_report %>%mutate(Value = round(Value, 3),pValue = ifelse(is.na(pValue), "", format.pval(pValue, digits = 2, eps = 1e-3)),Effect_Size = ifelse(is.na(Effect_Size), "", round(Effect_Size, 2)),CI = ifelse(is.na(CI_Lower), "",sprintf("[%.2f, %.2f]", CI_Lower, CI_Upper))) %>%select(-CI_Lower, -CI_Upper) # 移除单独的CI列
# 添加质量状态标记
integration_report$Status <- case_when(integration_report$Metric == "kBET Acceptance" & Value > 0.8 ~ "Pass",integration_report$Metric == "Clustering ASW" & Value > 0.4 ~ "Pass",integration_report$Metric == "Developmental Stage ASW" & Value > 0.5 ~ "Pass",integration_report$Metric == "iLISI (Batch Mixing)" & Value > 1.5 ~ "Pass",integration_report$Metric == "cLISI (Stage Separation)" & Value < 1.2 ~ "Pass",TRUE ~ "Check"
)
# 保存为CSV
write.csv(integration_report, "integration_quality_report.csv", row.names = FALSE)
# 打印美化表格
cat("\n===== INTEGRATION QUALITY REPORT =====\n")
knitr::kable(integration_report, align = c('l', 'c', 'l', 'c', 'c', 'c', 'l', 'c'),col.names = c("Metric", "Value", "Target", "p-value", "Effect Size", "95% CI", "Reference", "Status"),caption = "Comprehensive Integration Quality Assessment")
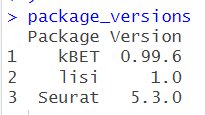
cat("=====================================\n")# 添加包版本信息
package_versions <- data.frame(Package = c("kBET", "lisi", "Seurat"),Version = c(as.character(packageVersion("kBET")), as.character(packageVersion("lisi")),as.character(packageVersion("Seurat")))
)