PEV2(PostgreSQL Explain Visualizer 2)
产品介绍
PEV2(Postgres Explain Visualizer 2)是一个旨在帮助开发者更直观地理解 PostgreSQL 数据库查询计划的工具。它通过图形化的方式展示 EXPLAIN 输出,使得复杂的查询计划更易于理解和分析。PEV2 使用 Angular 2 框架进行开发,并结合 TypeScript 强化类型安全性,这使得代码更加健壮且易于维护
项目URL:https://github.com/dalibo/pev2
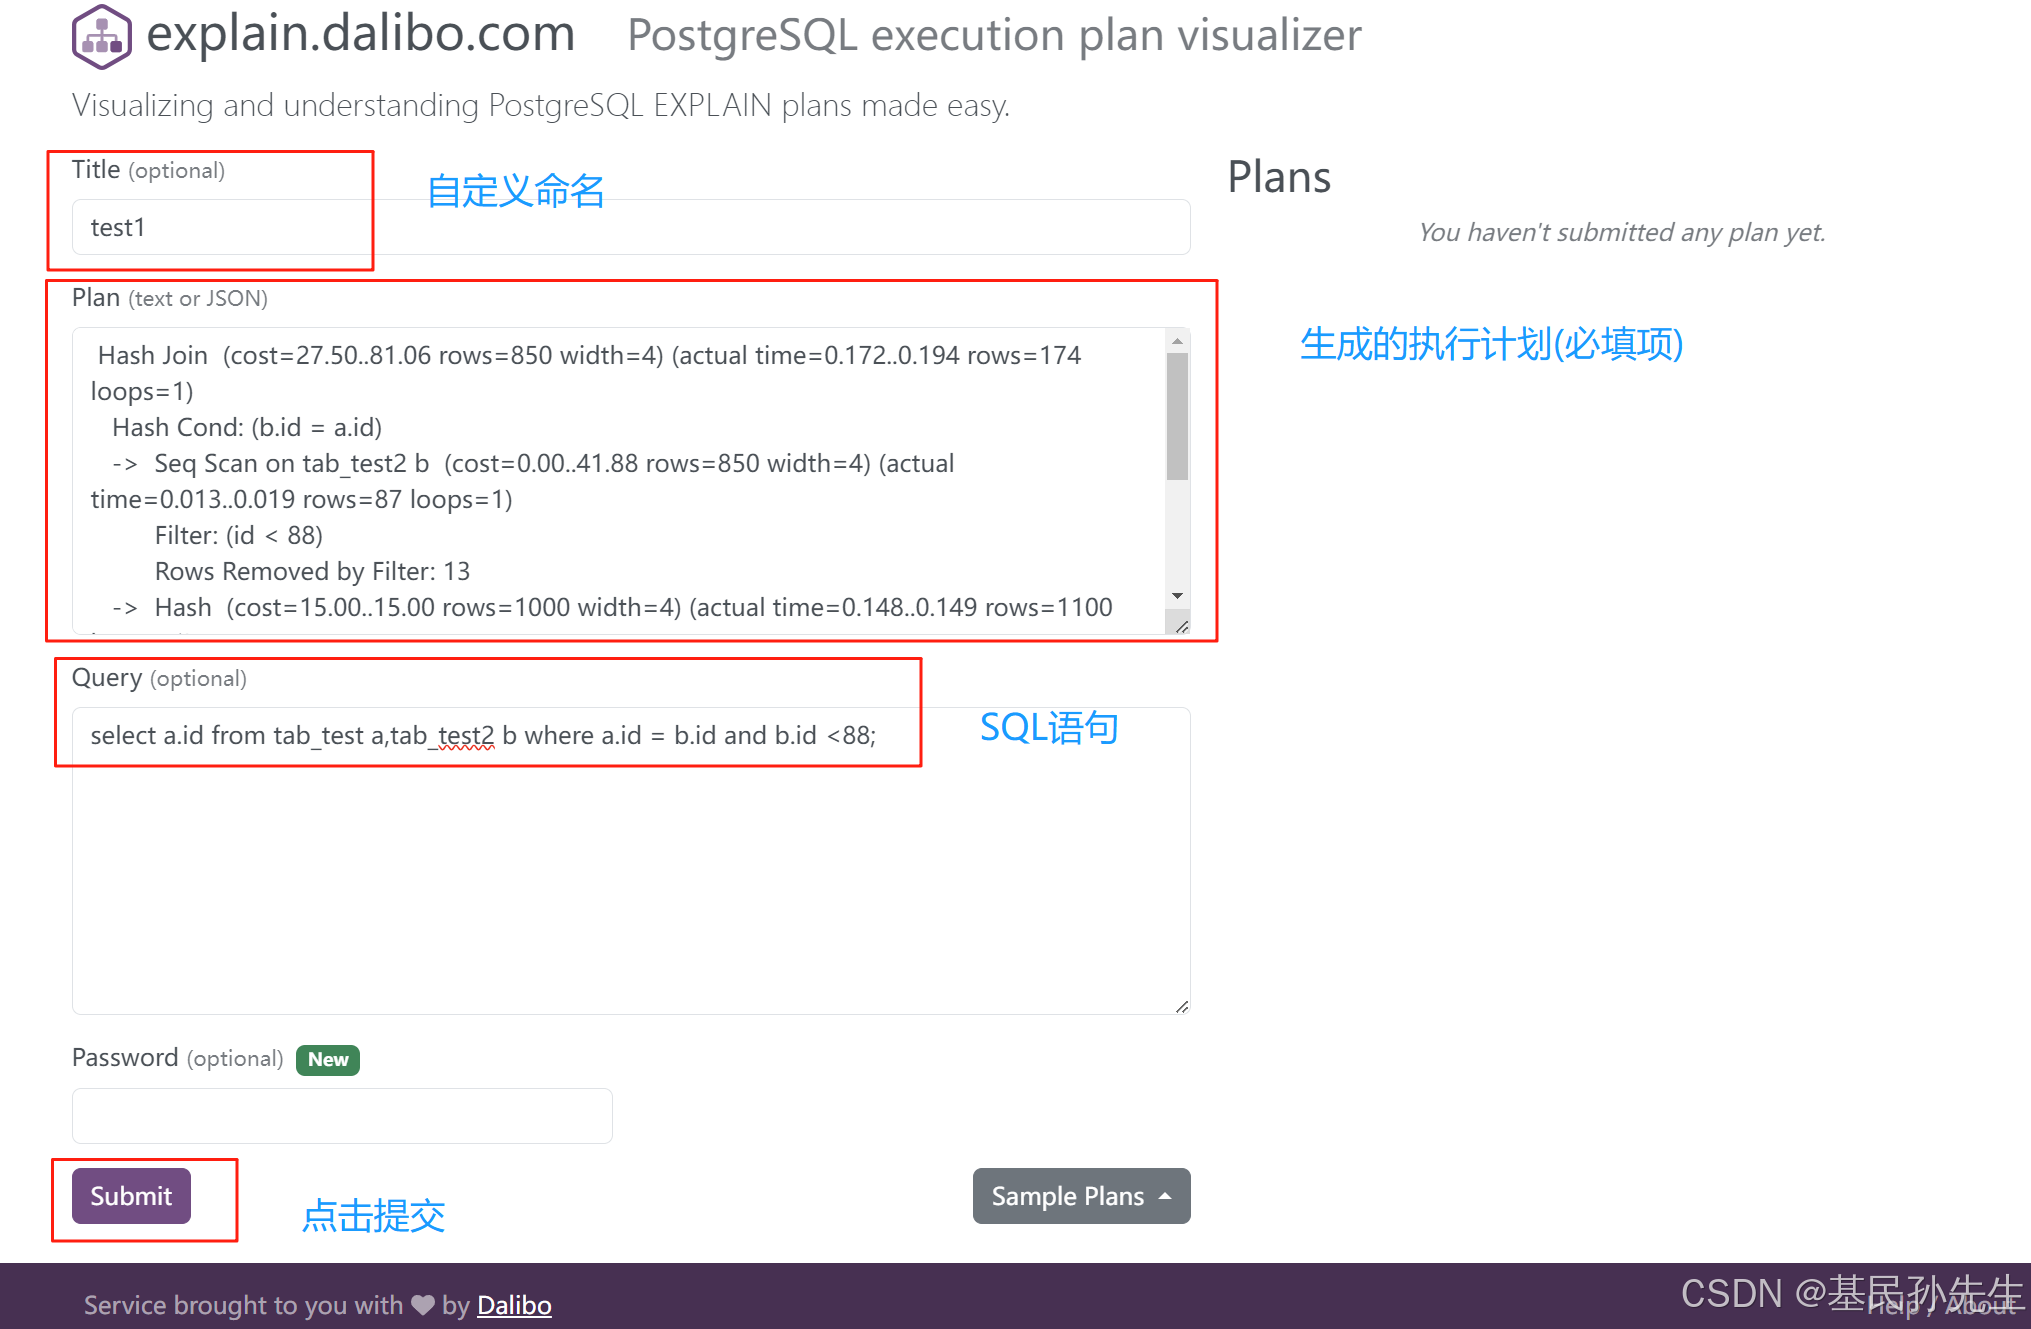
产品URL:https://explain.dalibo.com/
生成测试数据
postgres=# create table tab_test (id int);
CREATE TABLE
postgres=# INSERT INTO tab_test (id) SELECT generate_series(1, 1000);
INSERT 0 1000postgres=# create table tab_test2 (id int);
CREATE TABLE
postgres=# INSERT INTO tab_test2 (id) SELECT generate_series(1, 100);
INSERT 0 100
输出执行计划
postgres=# EXPLAIN ANALYZE select a.id from tab_test a,tab_test2 b where a.id = b.id and b.id <88;QUERY PLAN
-----------------------------------------------------------------------------------------------------------------------Hash Join  (cost=27.50..81.06 rows=850 width=4) (actual time=0.172..0.194 rows=174 loops=1)Hash Cond: (b.id = a.id)->  Seq Scan on tab_test2 b  (cost=0.00..41.88 rows=850 width=4) (actual time=0.013..0.019 rows=87 loops=1)Filter: (id < 88)Rows Removed by Filter: 13->  Hash  (cost=15.00..15.00 rows=1000 width=4) (actual time=0.148..0.149 rows=1100 loops=1)Buckets: 2048 (originally 1024)  Batches: 1 (originally 1)  Memory Usage: 55kB->  Seq Scan on tab_test a  (cost=0.00..15.00 rows=1000 width=4) (actual time=0.004..0.064 rows=1100 loops=1)Planning Time: 0.078 msExecution Time: 0.217 ms
(10 rows)
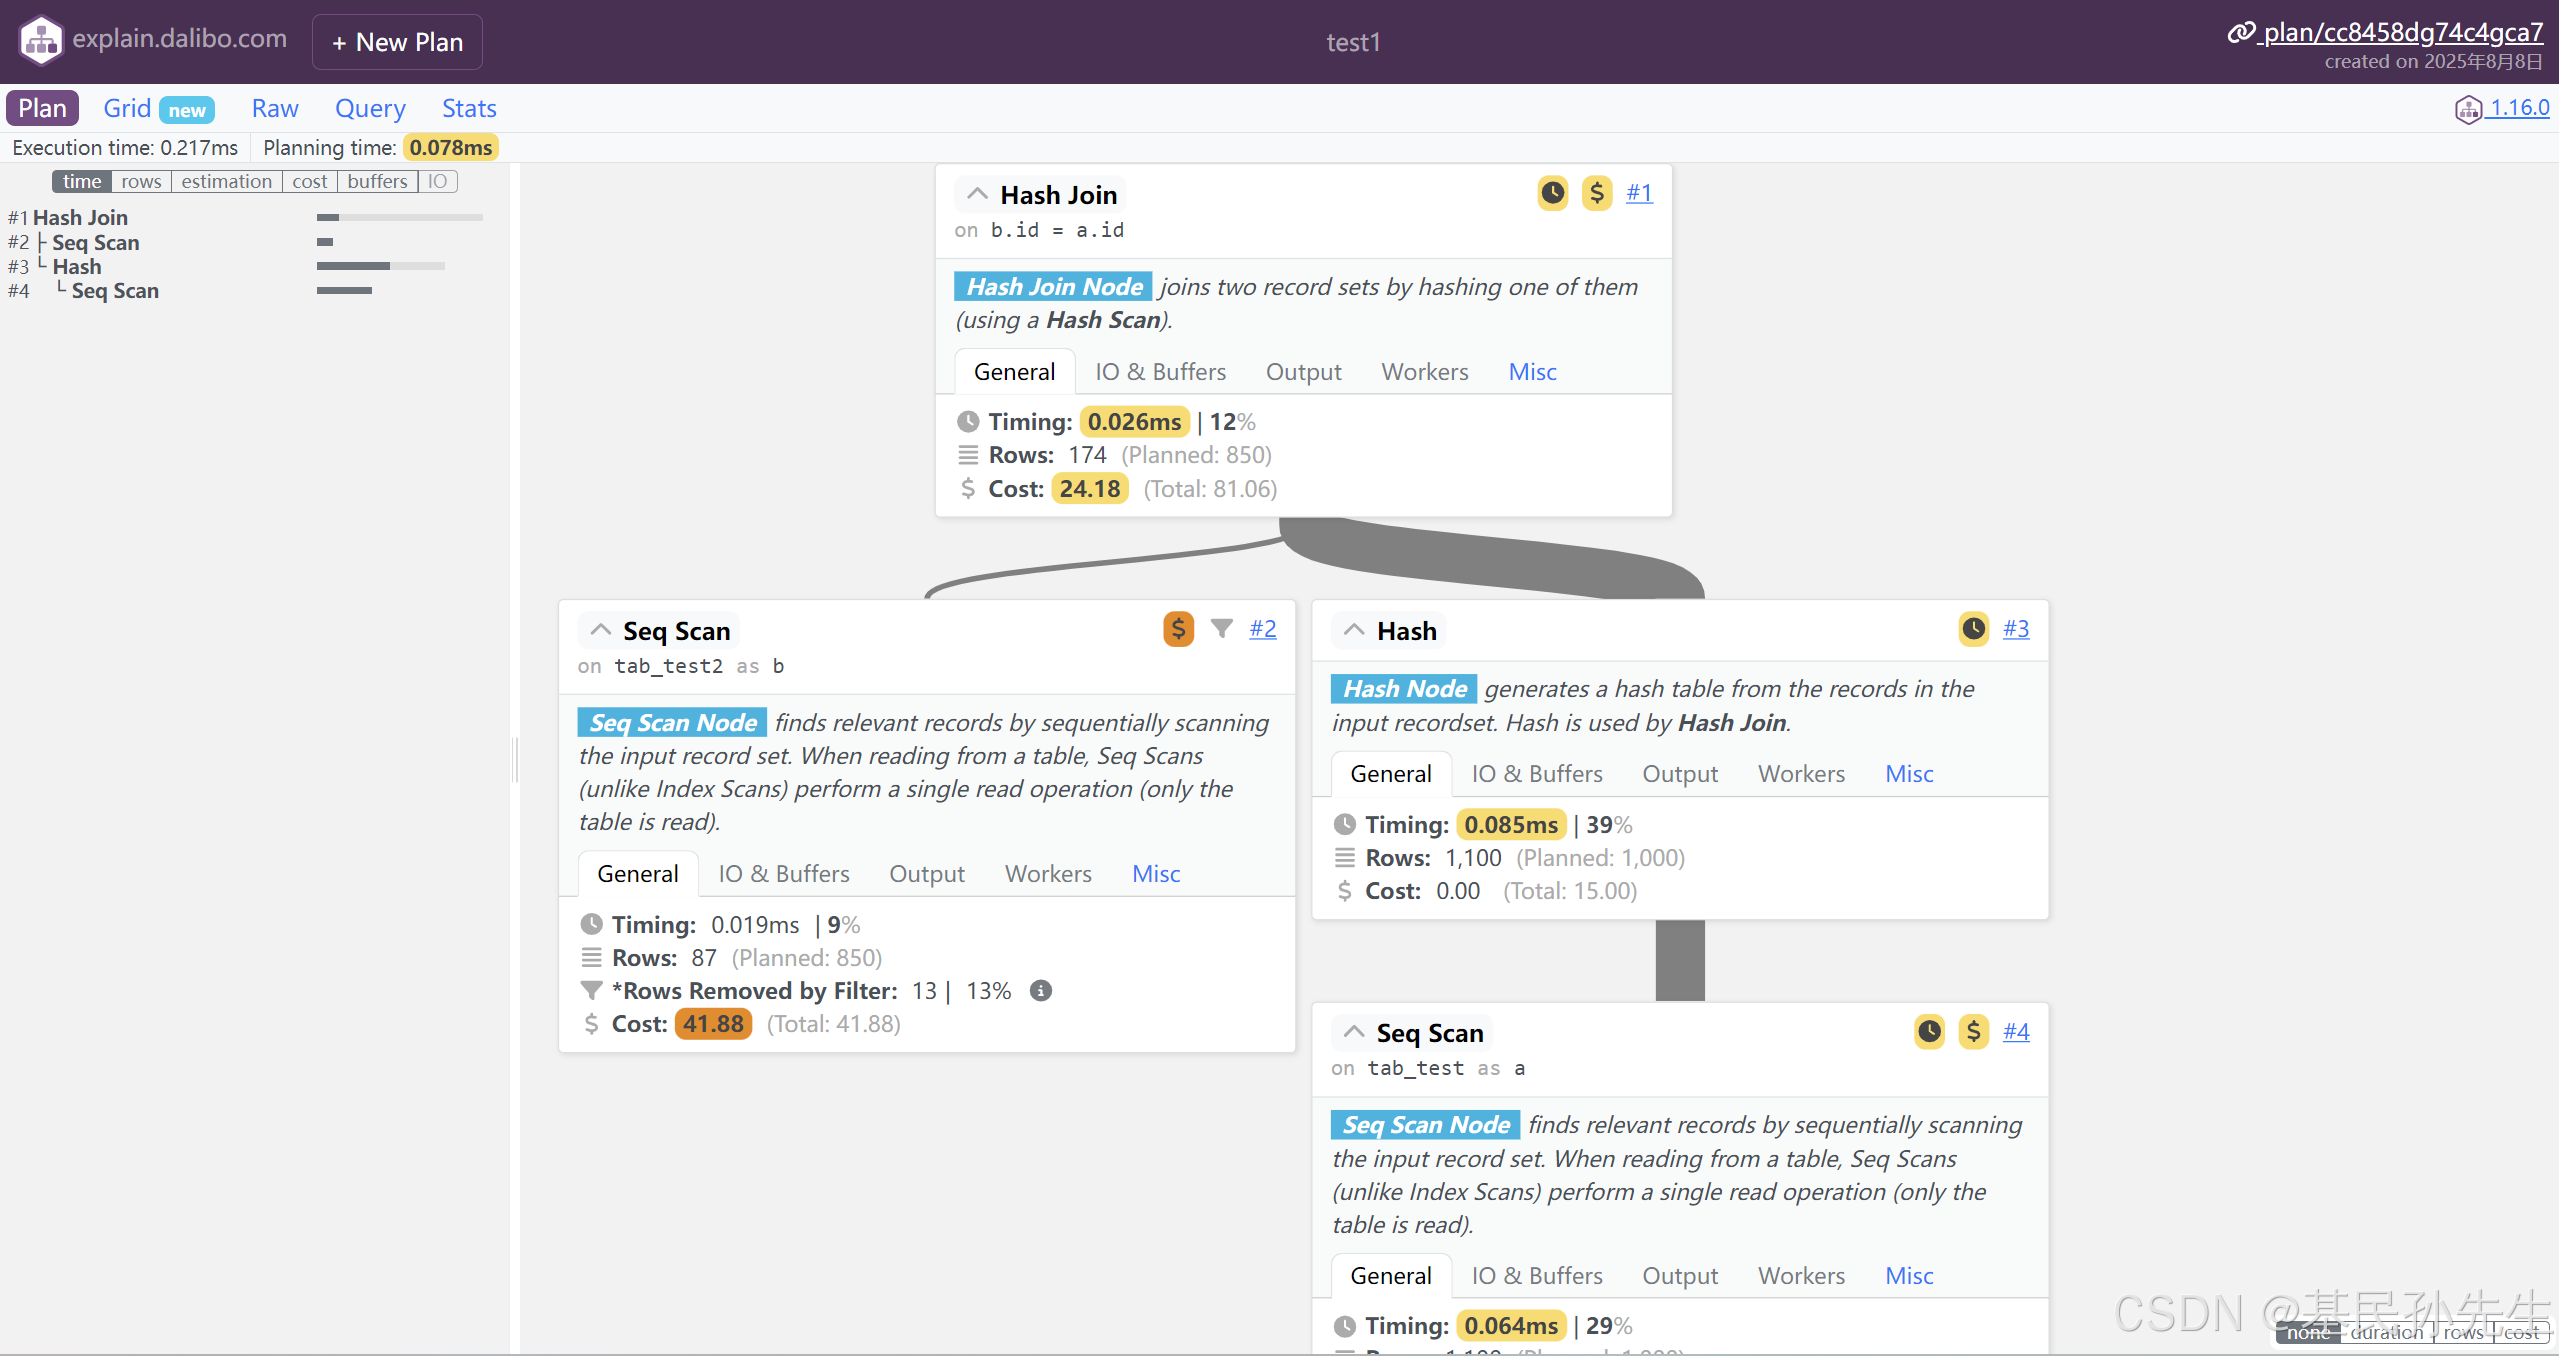
PEV2
提交内容
可视化执行计划