Windows 环境下,使用 ESP32 JTAG 接口进行固件下载
前提
- 在 windows 上安装 esp-idf CMD 软件编译环境,可参考“Windows 上搭建 ESP-IDF SDK 编译环境 + Visual Studio Code 软件编程环境”说明。
- 硬件上使用 ESP32 JTAG 接口与 ESP-PROG 工具的 JTAG 接口一一建立连接,参见 “配置其他 JTAG 接口” 说明,如下:
| ESP32 管脚 | JTAG 信号 |
|---|---|
| MTDO / GPIO15 | TDO |
| MTDI / GPIO12 | TDI |
| MTCK / GPIO13 | TCK |
| MTMS / GPIO14 | TMS |
| GND | GND |
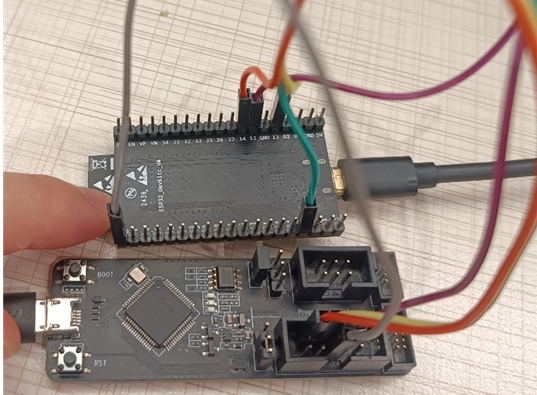
检查 ESP32 上用于 JTAG 通信的管脚是否被连接到了其它硬件上,这可能会影响 JTAG 的工作。
连接 ESP32 和 JTAG 接口上的管脚或信号。
JTAG 调试详细步骤说明
1 运行 openocd
-
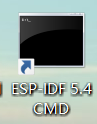
由于 esp-idf CMD 编译环境已经安装好 openocd 的环境,因此不需要手动安装,只需要打开 esp-idf CMD 终端窗口即可。

-
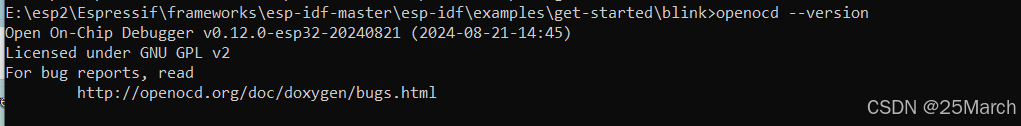
然后运行如下指令查询 openocd 环境:
openocd --version
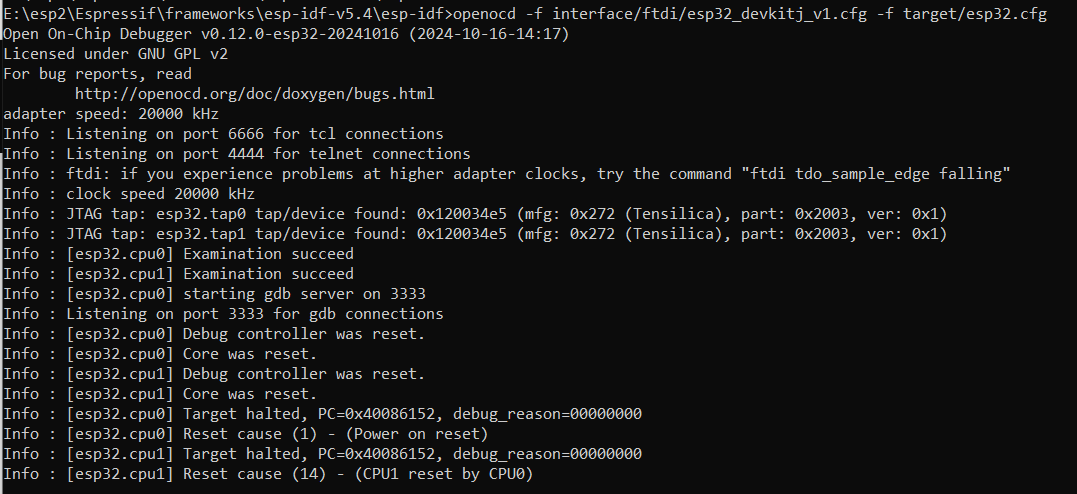
- 运行如下指令检查 openocd 环境
openocd -f interface/ftdi/esp32_devkitj_v1.cfg -f target/esp32.cfg
-
若 openocd 环境运行失败,报错
Not found Device,需考虑手动安装 Zadig 驱动,请参见 “Windows - 手动更改驱动程序” 说明。 Zadig 驱动 安装完成后,建议重启一下电脑。 -
更多 OpenOCD 环境报错说明参见: OpenOCD-ESP32 FAQ
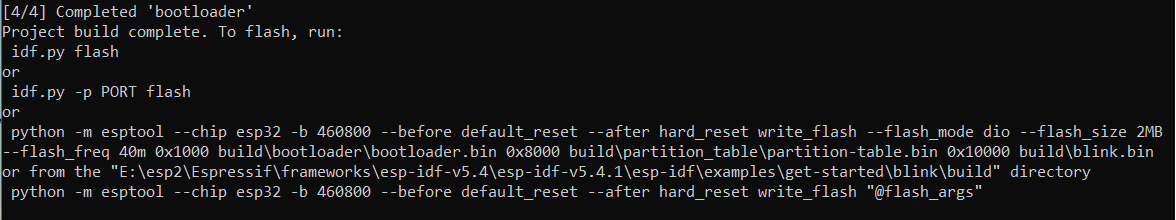
2 编译工程固件
- 在 ESP-IDF 终端环境下编译工程获取工程固件
idf.py build
以 esp-idf/examples/get-started/blink为 例程为例,如下:
3 使用 JTAG 管脚运行 OpenOCD 环境下载固件
参见 上传待调试的应用程序 说明
- 运行如下指令启动
OpenOCD环境来分别下载不同分区的固件
openocd -f interface/ftdi/esp32_devkitj_v1.cfg -f target/esp32.cfg -c "program_esp build/bootloader/bootloader.bin 0x1000 verify exit"
openocd -f interface/ftdi/esp32_devkitj_v1.cfg -f target/esp32.cfg -c "program_esp build/partition_table/partition-table.bin 0x8000 verify exit"
openocd -f interface/ftdi/esp32_devkitj_v1.cfg -f target/esp32.cfg -c "program_esp build/blink.bin 0x10000 verify exit"
- 若运行 openocd 环境,报错如下,需检查 ESP32 的 JTAG 管脚是否被用于其他功能。
Open On-chip Debugger vo.12.0-esp32-20241016(2024-10-16-14:17)
Licensed under GNU GPL v2
For bug reports, read
http://openocd.org/doc/doxygen/bugs.html
dapter speed: 20000 kHz
Info : Listening on port 6666 for tcl connections
Info :
Listening on port 4444 for telnet connections
rror:failed to reset FTDI device: LIBUSB ERROR PIPE
serial '*'at bus location '*
rror:unable to open ftdi device with description '*
E: esp2\Espressifltools openocd-esp32\v0.12.0-esp32-20241016\openocd-esp32\sharelopenocd scripts/target/esp common.cfg:!
Error:
it file "E: \esp2 Espressifltoolslopenocd-esp32 v0.12.0-esp32-20241016\openocd-esp32 share lopenocd scripts/target/esp _co
non.cfg", line 9
ESP-IDF CMD 终端将打印如下日志:
E:\esp2\Espressif\frameworks\esp-idf-v5.4\esp-idf-v5.4.1\esp-idf\examples\get-started\blink>openocd -f interface/ftdi/esp32_devkitj_v1.cfg -f target/esp32.cfg -c "program_esp build/bootloader/bootloader.bin 0x1000 verify exit"
Open On-Chip Debugger v0.12.0-esp32-20241016 (2024-10-16-14:17)
Licensed under GNU GPL v2
For bug reports, readhttp://openocd.org/doc/doxygen/bugs.html
adapter speed: 20000 kHz
** program_esp input args <0x1000 verify exit> **
Info : ftdi: if you experience problems at higher adapter clocks, try the command "ftdi tdo_sample_edge falling"
Info : clock speed 20000 kHz
Info : JTAG tap: esp32.tap0 tap/device found: 0x120034e5 (mfg: 0x272 (Tensilica), part: 0x2003, ver: 0x1)
Info : JTAG tap: esp32.tap1 tap/device found: 0x120034e5 (mfg: 0x272 (Tensilica), part: 0x2003, ver: 0x1)
Info : [esp32.cpu0] Examination succeed
Info : [esp32.cpu1] Examination succeed
Info : [esp32.cpu0] starting gdb server on 3333
Info : Listening on port 3333 for gdb connections
Info : JTAG tap: esp32.tap0 tap/device found: 0x120034e5 (mfg: 0x272 (Tensilica), part: 0x2003, ver: 0x1)
Info : JTAG tap: esp32.tap1 tap/device found: 0x120034e5 (mfg: 0x272 (Tensilica), part: 0x2003, ver: 0x1)
Info : [esp32.cpu0] requesting target halt and executing a soft reset
Info : [esp32.cpu0] Debug controller was reset.
Info : [esp32.cpu0] Core was reset.
Info : [esp32.cpu0] Target halted, PC=0x4008E5E6, debug_reason=00000000
Info : Set GDB target to 'esp32.cpu0'
Info : [esp32.cpu1] Debug controller was reset.
Info : [esp32.cpu1] Core was reset.
Info : [esp32.cpu1] Target halted, PC=0x4008E5E6, debug_reason=00000000
Info : [esp32.cpu1] Reset cause (14) - (CPU1 reset by CPU0)
Info : [esp32.cpu0] Debug controller was reset.
Info : [esp32.cpu0] Core was reset.
Info : [esp32.cpu0] Target halted, PC=0x500000CF, debug_reason=00000000
Info : [esp32.cpu0] Reset cause (3) - (Software core reset)
Info : [esp32.cpu0] Core was reset.
Info : [esp32.cpu0] Target halted, PC=0x40000400, debug_reason=00000000
Info : [esp32.cpu1] Debug controller was reset.
Info : [esp32.cpu1] Core was reset.
Info : [esp32.cpu1] Target halted, PC=0x40000400, debug_reason=00000000
Info : [esp32.cpu1] Reset cause (14) - (CPU1 reset by CPU0)
Info : [esp32.cpu0] Reset cause (3) - (Software core reset)
** Programming Started **
Info : [esp32.cpu0] Target halted, PC=0x400BC77E, debug_reason=00000001
Info : Flash mapping 0: 0x10020 -> 0x3f400020, 96 KB
Info : Flash mapping 1: 0x30020 -> 0x400d0020, 344 KB
Info : Auto-detected flash bank 'esp32.cpu0.flash' size 4096 KB
Info : Using flash bank 'esp32.cpu0.flash' size 4096 KB
Info : [esp32.cpu0] Target halted, PC=0x400BD0D2, debug_reason=00000001
Info : [esp32.cpu0] Target halted, PC=0x400BC60A, debug_reason=00000001
Info : PROF: Erased 28672 bytes in 326.562 ms
Info : PROF: Data transferred in 109.073 ms @ 256.709 KB/s
Info : [esp32.cpu0] Target halted, PC=0x400BCFEE, debug_reason=00000001
Info : PROF: Wrote 28672 bytes in 366.608 ms (data transfer time included)
** Programming Finished in 1192 ms **
** Verify Started **
Info : [esp32.cpu0] Target halted, PC=0x400BC8AA, debug_reason=00000001
Info : PROF: Flash verified in 28.939 ms
** Verify OK **
shutdown command invokedE:\esp2\Espressif\frameworks\esp-idf-v5.4\esp-idf-v5.4.1\esp-idf\examples\get-started\blink>openocd -f interface/ftdi/esp32_devkitj_v1.cfg -f target/esp32.cfg -c "program_esp build/partition_table/partition-table.bin 0x8000 verify exit"
Open On-Chip Debugger v0.12.0-esp32-20241016 (2024-10-16-14:17)
Licensed under GNU GPL v2
For bug reports, readhttp://openocd.org/doc/doxygen/bugs.html
adapter speed: 20000 kHz
** program_esp input args <0x8000 verify exit> **
Info : ftdi: if you experience problems at higher adapter clocks, try the command "ftdi tdo_sample_edge falling"
Info : clock speed 20000 kHz
Info : JTAG tap: esp32.tap0 tap/device found: 0x120034e5 (mfg: 0x272 (Tensilica), part: 0x2003, ver: 0x1)
Info : JTAG tap: esp32.tap1 tap/device found: 0x120034e5 (mfg: 0x272 (Tensilica), part: 0x2003, ver: 0x1)
Info : [esp32.cpu0] Examination succeed
Info : [esp32.cpu1] Examination succeed
Info : [esp32.cpu0] starting gdb server on 3333
Info : Listening on port 3333 for gdb connections
Info : JTAG tap: esp32.tap0 tap/device found: 0x120034e5 (mfg: 0x272 (Tensilica), part: 0x2003, ver: 0x1)
Info : JTAG tap: esp32.tap1 tap/device found: 0x120034e5 (mfg: 0x272 (Tensilica), part: 0x2003, ver: 0x1)
Info : [esp32.cpu0] requesting target halt and executing a soft reset
Info : [esp32.cpu0] Target halted, PC=0x40000400, debug_reason=00000001
Info : [esp32.cpu0] Reset cause (3) - (Software core reset)
Info : Set GDB target to 'esp32.cpu0'
Info : [esp32.cpu1] Target halted, PC=0x40000400, debug_reason=00000000
Info : [esp32.cpu1] Reset cause (14) - (CPU1 reset by CPU0)
Info : [esp32.cpu0] Debug controller was reset.
Info : [esp32.cpu0] Core was reset.
Info : [esp32.cpu0] Target halted, PC=0x500000CF, debug_reason=00000000
Info : [esp32.cpu0] Reset cause (3) - (Software core reset)
Info : [esp32.cpu0] Core was reset.
Info : [esp32.cpu0] Target halted, PC=0x40000400, debug_reason=00000000
Info : [esp32.cpu1] Debug controller was reset.
Info : [esp32.cpu1] Core was reset.
Info : [esp32.cpu1] Target halted, PC=0x40000400, debug_reason=00000000
Info : [esp32.cpu1] Reset cause (14) - (CPU1 reset by CPU0)
Info : [esp32.cpu0] Reset cause (3) - (Software core reset)
** Programming Started **
Info : [esp32.cpu0] Target halted, PC=0x400BC77E, debug_reason=00000001
Info : Flash mapping 0: 0x10020 -> 0x3f400020, 96 KB
Info : Flash mapping 1: 0x30020 -> 0x400d0020, 344 KB
Info : Auto-detected flash bank 'esp32.cpu0.flash' size 4096 KB
Info : Using flash bank 'esp32.cpu0.flash' size 4096 KB
Info : [esp32.cpu0] Target halted, PC=0x400BD0D2, debug_reason=00000001
Info : [esp32.cpu0] Target halted, PC=0x400BC60A, debug_reason=00000001
Info : PROF: Erased 4096 bytes in 59.812 ms
Info : [esp32.cpu0] Target halted, PC=0x400BCFEE, debug_reason=00000001
Info : PROF: Data transferred in 41.164 ms @ 97.1723 KB/s
Info : PROF: Wrote 4096 bytes in 218.931 ms (data transfer time included)
** Programming Finished in 742 ms **
** Verify Started **
Info : [esp32.cpu0] Target halted, PC=0x400BC8AA, debug_reason=00000001
Info : PROF: Flash verified in 24.977 ms
** Verify OK **
shutdown command invokedE:\esp2\Espressif\frameworks\esp-idf-v5.4\esp-idf-v5.4.1\esp-idf\examples\get-started\blink>openocd -f interface/ftdi/esp32_devkitj_v1.cfg -f target/esp32.cfg -c "program_esp build/blink.bin 0x10000 verify exit"
Open On-Chip Debugger v0.12.0-esp32-20241016 (2024-10-16-14:17)
Licensed under GNU GPL v2
For bug reports, readhttp://openocd.org/doc/doxygen/bugs.html
adapter speed: 20000 kHz
** program_esp input args <0x10000 verify exit> **
Info : ftdi: if you experience problems at higher adapter clocks, try the command "ftdi tdo_sample_edge falling"
Info : clock speed 20000 kHz
Info : JTAG tap: esp32.tap0 tap/device found: 0x120034e5 (mfg: 0x272 (Tensilica), part: 0x2003, ver: 0x1)
Info : JTAG tap: esp32.tap1 tap/device found: 0x120034e5 (mfg: 0x272 (Tensilica), part: 0x2003, ver: 0x1)
Info : [esp32.cpu0] Examination succeed
Info : [esp32.cpu1] Examination succeed
Info : [esp32.cpu0] starting gdb server on 3333
Info : Listening on port 3333 for gdb connections
Info : JTAG tap: esp32.tap0 tap/device found: 0x120034e5 (mfg: 0x272 (Tensilica), part: 0x2003, ver: 0x1)
Info : JTAG tap: esp32.tap1 tap/device found: 0x120034e5 (mfg: 0x272 (Tensilica), part: 0x2003, ver: 0x1)
Info : [esp32.cpu0] requesting target halt and executing a soft reset
Info : [esp32.cpu0] Target halted, PC=0x40000400, debug_reason=00000001
Info : [esp32.cpu0] Reset cause (3) - (Software core reset)
Info : Set GDB target to 'esp32.cpu0'
Info : [esp32.cpu1] Target halted, PC=0x40000400, debug_reason=00000000
Info : [esp32.cpu1] Reset cause (14) - (CPU1 reset by CPU0)
Info : [esp32.cpu0] Debug controller was reset.
Info : [esp32.cpu0] Core was reset.
Info : [esp32.cpu0] Target halted, PC=0x500000CF, debug_reason=00000000
Info : [esp32.cpu0] Reset cause (3) - (Software core reset)
Info : [esp32.cpu0] Core was reset.
Info : [esp32.cpu0] Target halted, PC=0x40000400, debug_reason=00000000
Info : [esp32.cpu1] Debug controller was reset.
Info : [esp32.cpu1] Core was reset.
Info : [esp32.cpu1] Target halted, PC=0x40000400, debug_reason=00000000
Info : [esp32.cpu1] Reset cause (14) - (CPU1 reset by CPU0)
Info : [esp32.cpu0] Reset cause (3) - (Software core reset)
** Programming Started **
Info : [esp32.cpu0] Target halted, PC=0x400BC77E, debug_reason=00000001
Info : Flash mapping 0: 0x10020 -> 0x3f400020, 96 KB
Info : Flash mapping 1: 0x30020 -> 0x400d0020, 344 KB
Info : Auto-detected flash bank 'esp32.cpu0.flash' size 4096 KB
Info : Using flash bank 'esp32.cpu0.flash' size 4096 KB
Info : [esp32.cpu0] Target halted, PC=0x400BD0D2, debug_reason=00000001
Info : [esp32.cpu0] Target halted, PC=0x400BC60A, debug_reason=00000001
Info : PROF: Erased 188416 bytes in 1870.08 ms
Info : PROF: Data transferred in 814.142 ms @ 226.005 KB/s
Info : [esp32.cpu0] Target halted, PC=0x400BCFEE, debug_reason=00000001
Info : PROF: Wrote 188416 bytes in 1151.95 ms (data transfer time included)
** Programming Finished in 3510 ms **
** Verify Started **
Info : [esp32.cpu0] Target halted, PC=0x400BC8AA, debug_reason=00000001
Info : PROF: Flash verified in 110.802 ms
** Verify OK **
shutdown command invoked
4 查看固件运行日志
使用如下指令检查固件运行日志:
idf.py monitor
- 使用
Ctrl + ]退出idf.py monitor环境
固件运行日志如下:
E:\esp2\Espressif\frameworks\esp-idf-v5.4\esp-idf-v5.4.1\esp-idf\examples\get-started\blink>idf.py monitor
Executing action: monitor
Serial port COM16
Connecting.......
Detecting chip type... Unsupported detection protocol, switching and trying again...
Connecting....
Detecting chip type... ESP32
Running idf_monitor in directory E:\esp2\Espressif\frameworks\esp-idf-v5.4\esp-idf-v5.4.1\esp-idf\examples\get-started\blink
Executing "E:\esp2\Espressif\python_env\idf5.4_py3.9_env\Scripts\python.exe E:\esp2\Espressif\frameworks\esp-idf-v5.4\esp-idf-v5.4.1\esp-idf\tools/idf_monitor.py -p COM16 -b 115200 --toolchain-prefix xtensa-esp32-elf- --target esp32 --revision 0 E:\esp2\Espressif\frameworks\esp-idf-v5.4\esp-idf-v5.4.1\esp-idf\examples\get-started\blink\build\blink.elf --force-color -m 'E:\esp2\Espressif\python_env\idf5.4_py3.9_env\Scripts\python.exe' 'E:\esp2\Espressif\frameworks\esp-idf-v5.4\esp-idf-v5.4.1\esp-idf\tools\idf.py'"...
--- Warning: GDB cannot open serial ports accessed as COMx
--- Using \\.\COM16 instead...
--- esp-idf-monitor 1.6.2 on \\.\COM16 115200
--- Quit: Ctrl+] | Menu: Ctrl+T | Help: Ctrl+T followed by Ctrl+H
ets Jun  8 2016 00:22:57rst:0x1 (POWERON_RESET),boot:0x13 (SPI_FAST_FLASH_BOOT)
ets Jun  8 2016 00:22:57rst:0x10 (RTCWDT_RTC_RESET),boot:0x13 (SPI_FAST_FLASH_BOOT)
configsip: 0, SPIWP:0xee
clk_drv:0x00,q_drv:0x00,d_drv:0x00,cs0_drv:0x00,hd_drv:0x00,wp_drv:0x00
mode:DIO, clock div:2
load:0x3fff0030,len:6276
load:0x40078000,len:15748
load:0x40080400,len:4
--- 0x40080400: _init at ??:?ho 8 tail 4 room 4
load:0x40080404,len:3860
entry 0x4008063c
I (30) boot: ESP-IDF v5.4.1-dirty 2nd stage bootloader
I (30) boot: compile time Jun  5 2025 17:10:59
I (31) boot: Multicore bootloader
I (32) boot: chip revision: v0.0
I (35) boot.esp32: SPI Speed      : 40MHz
I (39) boot.esp32: SPI Mode       : DIO
I (42) boot.esp32: SPI Flash Size : 2MB
I (46) boot: Enabling RNG early entropy source...
I (50) boot: Partition Table:
I (53) boot: ## Label            Usage          Type ST Offset   Length
I (59) boot:  0 nvs              WiFi data        01 02 00009000 00006000
I (66) boot:  1 phy_init         RF data          01 01 0000f000 00001000
I (72) boot:  2 factory          factory app      00 00 00010000 00100000
I (79) boot: End of partition table
I (82) esp_image: segment 0: paddr=00010020 vaddr=3f400020 size=0a03ch ( 41020) map
I (104) esp_image: segment 1: paddr=0001a064 vaddr=3ff80000 size=0001ch (    28) load
I (104) esp_image: segment 2: paddr=0001a088 vaddr=3ffb0000 size=02314h (  8980) load
I (111) esp_image: segment 3: paddr=0001c3a4 vaddr=40080000 size=03c74h ( 15476) load
I (121) esp_image: segment 4: paddr=00020020 vaddr=400d0020 size=1460ch ( 83468) map
I (151) esp_image: segment 5: paddr=00034634 vaddr=40083c74 size=08fc0h ( 36800) load
I (172) boot: Loaded app from partition at offset 0x10000
I (172) boot: Disabling RNG early entropy source...
I (182) cpu_start: Multicore app
I (191) cpu_start: Pro cpu start user code
I (191) cpu_start: cpu freq: 160000000 Hz
I (191) app_init: Application information:
I (191) app_init: Project name:     blink
I (195) app_init: App version:      v5.4.1-dirty
I (199) app_init: Compile time:     Jun  5 2025 17:10:01
I (204) app_init: ELF file SHA256:  cf9b8f674...
I (208) app_init: ESP-IDF:          v5.4.1-dirty
I (213) efuse_init: Min chip rev:     v0.0
I (216) efuse_init: Max chip rev:     v3.99
I (220) efuse_init: Chip rev:         v0.0
I (225) heap_init: Initializing. RAM available for dynamic allocation:
I (231) heap_init: At 3FFAE6E0 len 00001920 (6 KiB): DRAM
I (236) heap_init: At 3FFB2BD8 len 0002D428 (181 KiB): DRAM
I (241) heap_init: At 3FFE0440 len 00003AE0 (14 KiB): D/IRAM
I (246) heap_init: At 3FFE4350 len 0001BCB0 (111 KiB): D/IRAM
I (252) heap_init: At 4008CC34 len 000133CC (76 KiB): IRAM
I (258) spi_flash: detected chip: gd
I (260) spi_flash: flash io: dio
W (263) spi_flash: Detected size(4096k) larger than the size in the binary image header(2048k). Using the size in the binary image header.
I (276) main_task: Started on CPU0
I (286) main_task: Calling app_main()
I (286) example: Example configured to blink GPIO LED!
I (286) gpio: GPIO[5]| InputEn: 0| OutputEn: 0| OpenDrain: 0| Pullup: 1| Pulldown: 0| Intr:0
I (286) example: Turning the LED OFF!
I (1296) example: Turning the LED ON!
I (2296) example: Turning the LED OFF!
I (3296) example: Turning the LED ON!
I (4296) example: Turning the LED OFF!