在图像分析算法部署中应对流行趋势的变化|文献速递-深度学习医疗AI最新文献
Title
题目
Navigating prevalence shifts in image analysis algorithm deployment
在图像分析算法部署中应对流行趋势的变化
01
文献速递介绍
机器学习(ML)已开始革新成像研究与实践的诸多领域。然而,医学图像分析领域存在显著的转化鸿沟,大量方法学进展未能应用于(临床)实践,因而无法为(患者)带来实际益处。例如,Panch等人指出“令人尴尬的事实是,目前研究文献中备受瞩目的算法,大多无法在临床实践的一线执行”(Panch et al., 2019)。一个主要障碍是数据集偏移,即算法开发/验证所用数据与部署数据的分布在一个或多个方面存在差异,如图像设备(Roschewitz et al., 2023)、人口统计学特征(Castro et al., 2020)或组织几何结构(Sellner et al., 2023)。 以下我们聚焦于流行率偏移,即在给定类别的图像条件分布不变,但开发环境与部署环境的类别分布发生变化的情况。形式化而言,若开发数据中图像与标签的联合概率分布为 (P{dev}(X, Y)),部署数据中为 (P{depl}(X, Y)),则当 (P{dev}(X|Y) = P{depl}(X|Y)) 但 (P{dev}(Y) \neq P{depl}(Y)) 时,即发生流行率偏移。这类偏移在全球人工智能(AI)应用中尤为关键(Subbaswamy & Saria, 2020),因为疾病流行率可能随时间和地点剧烈变化,如COVID-19大流行所示(Zhang et al., 2022)。流行率偏移的常见原因还包括样本选择偏差和季节等环境因素的变化(Castro et al., 2020; Dockès et al., 2021; Zhang et al., 2022)。 根据前期研究(Dockès et al., 2021)及我们的分析,流行率偏移处理在模型部署相关的以下阶段尤为关键: - 模型重新校准:流行率偏移可能导致分类器校准错误(Van Calster et al., 2019),这对基于预测类别分数做出的决策具有重要影响(见2.2节)。需注意的是,即使没有流行率偏移,深度神经网络训练后也往往校准不佳(Guo et al., 2017)。此外,模型校准对于基础模型仍是关键问题(Tran et al., 2022; Zhao et al., 2021)。 - 决策规则:决策规则是将连续的预测类别分数(如神经网络最终softmax层的输出)映射为单一分类决策的策略。尽管校准良好的类别概率可为临床医生提供更有价值的信息,但模型集成到现有工作流程或满足监管要求时可能需要分类决策。盲目将argmax操作作为决策规则忽略了贝叶斯理论的必要前提:通过argmax最大化模型准确率依赖于预测类别分数的正确校准,因而会受流行率偏移影响(Ferrer, 2022)。此外,argmax仅对部分指标保证最优决策。类似地,在开发环境中针对特定指标(如F1分数)调整的决策规则,在流行率偏移后可能不再最优。 - 性能评估:开发/验证集中观察到的类别频率可能无法代表实际应用中的情况,尤其是当算法基于存在样本选择偏差的数据训练时(见图1)。这意味着,在遭遇向临床现实的流行率偏移场景中评估时,准确率、F1分数和马修斯相关系数(MCC)等广泛使用的流行率相关指标值将显著不同(Reinke et al., 2024)。此外,跨数据集的指标分数比较可能极具误导性。然而,对近期文献的检索表明,实践中这些问题鲜少受到关注(见2.1节)。 为弥合基于AI的医学影像研究中由流行率偏移导致的转化鸿沟,我们的工作做出以下贡献(图1): 1. 我们在一组多样化的医学分类任务中揭示了忽视流行率偏移的潜在后果。 2. 我们证明流行率可以通过数据驱动的方式进行高精度估计。 3. 我们构建了一个对流行率偏移鲁棒的图像分类综合工作流程。其核心优势在于,仅需预期流行率的估计值,无需带标注的部署数据,且可应用于任何给定的黑盒模型。 我们工作中解决的具体研究问题总结于图文摘要和2.4节。本研究的初步版本曾在2023年医学图像计算与计算机辅助干预国际会议(MICCAI)上发表(Godau et al., 2023)。本扩展版最重要的新增内容包括: (i) 我们解决了关于从未标注部署数据中估计类别流行率(即量化,González et al., 2017)质量的新增研究问题(RQ1)。 (ii) 我们将基于重新校准处理流行率偏移的方法与使用部署流行率重新训练的方法进行了比较(图5)。 (iii) 我们大幅扩展了与(RQ2)和(RQ3)对应的方法描述及结果(图2、6、7)。
Abatract
摘要
Domain gaps are significant obstacles to the clinical implementation of machine learning (ML) solutions for medical image analysis. Although current research emphasizes new training methods and network architectures, the specific impact of prevalence shifts on algorithms in real-world applications is often overlooked. Differences in class frequencies between development and deployment data are crucial, particularly for the widespread adoption of artificial intelligence (AI), as disease prevalence can vary greatly across different times and locations. Our contribution is threefold. Based on a diverse set of 30 medical classification tasks (1) we demonstrate that lack of prevalence shift handling can have severe consequences on the quality of calibration, decision threshold, and performance assessment. Furthermore, (2) we show that prevalences can be accurately and reliably estimated in a data-driven manner. Finally, (3) we propose a new workflow for prevalence-aware image classification that uses estimated deployment prevalences to adjust a trained classifier to a new environment, without requiring additional annotated deployment data. Comprehensive experiments indicate that our proposed approach could contribute to generating better classifier decisions and more reliable performance estimates compared to current practice.
领域差距是医学图像分析机器学习(ML)解决方案临床落地的重大障碍。尽管当前研究侧重于新型训练方法和网络架构,但在真实应用中,流行率变化(prevalence shifts)对算法的具体影响常被忽视。开发数据与部署数据之间的类别频率差异至关重要,尤其是对人工智能(AI)的广泛应用而言,因为疾病流行率会因时间和地点的不同而显著变化。我们的贡献主要体现在三个方面:基于30项多样化的医学分类任务,(1)我们证明了缺乏流行率变化处理可能会对模型校准质量、决策阈值和性能评估产生严重影响;(2)我们表明流行率可以通过数据驱动的方式进行准确且可靠的估计;(3)我们提出了一种新的流行率感知图像分类工作流程,该流程无需额外标注的部署数据,即可利用估计的部署流行率将训练好的分类器适配到新环境。综合实验表明,与现有方法相比,我们提出的方法能够生成更优的分类决策和更可靠的性能估计。
Method
方法
The following sections present common misconceptions in the medical image analysis community that motivated our work (Section 2.1), fundamentals regarding notation and terminology (Section 2.2), our workflow for navigating prevalence shifts upon algorithm deployment (Section 2.3) as well as the experimental design of our study (Section 2.4).
以下章节将介绍促使我们开展本研究的医学图像分析领域常见误区(第2.1节)、符号和术语的基本概念(第2.2节)、算法部署时应对流行率偏移的工作流程(第2.3节)以及本研究的实验设计(第2.4节)。
Conclusion
结论
In conclusion, our findings strongly indicate that neglecting prevalence shifts may lead to miscalibrated models, suboptimal decisions and poor performance assessment. Our thorough workflow mitigates these pitfalls, requiring only unlabeled data from the deployment environment for automated prevalence estimation and post-hoc model re-calibration. These characteristics make it an excellent candidate for widespread use in prevalence-aware image classification.
我们的研究结果有力表明,忽视流行率偏移可能导致模型校准错误、决策次优及性能评估失准。我们提出的完整工作流程可有效规避这些缺陷,仅需部署环境中的未标注数据即可实现流行率自动估计和事后模型重新校准。这些特性使其成为流行率感知图像分类中广泛应用的理想方案。
Results
结果
The results for (RQ1) are presented in Section 3.1. For better comparability, we present the results for (RQ2) and (RQ3) together, namely the effects of prevalence shifts on model calibration (Section 3.2), decision rules (Section 3.3) and performance estimation (Section 3.4) for both common methods and the proposed workflow.
(RQ1)的结果在3.1节中呈现。为了便于比较,我们将(RQ2)和(RQ3)的结果合并展示,即流行率偏移对常见方法和所提出工作流程在模型校准(3.2节)、决策规则(3.3节)及性能估计(3.4节)方面的影响。
Figure
图
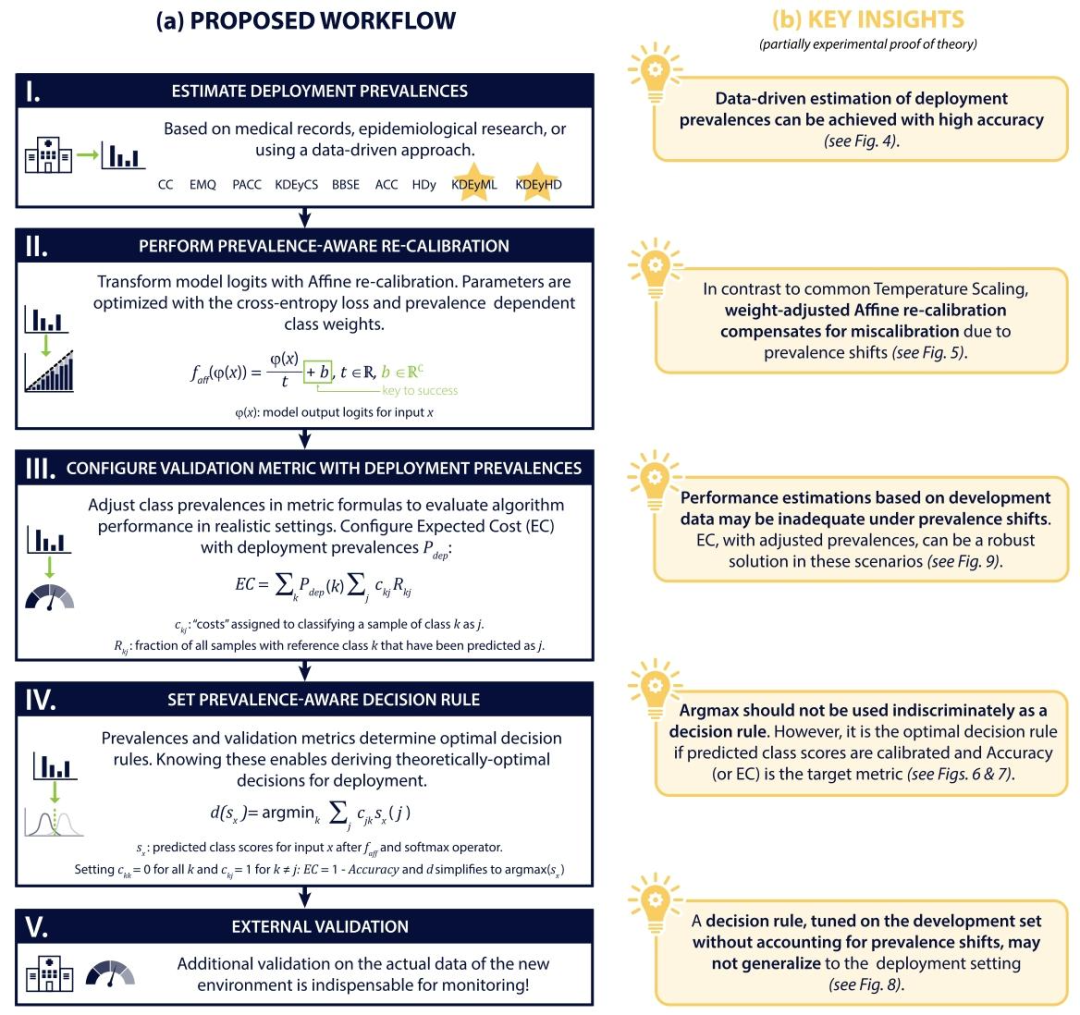
Fig. 1. Proposed workflow for addressing prevalence shifts in medical image analysis (a) and key insights derived from this work (b). Steps: (I) Estimate new environment class prevalences; (II) Re-calibrate model; (III) Configure validation metrics with the estimated prevalences; (IV) Adapt decision rule for making categorical decisions appropriately; (V) Perform (external) validation on an independent deployment data set.
图1. 解决医学图像分析中流行率偏移的建议工作流程(a)及本研究得出的关键见解(b) 步骤: (I)估计新环境的类别流行率; (II)重新校准模型; (III)使用估计的流行率配置验证指标; (IV)调整决策规则以合理做出分类决策; (V)在独立的部署数据集上进行(外部)验证。
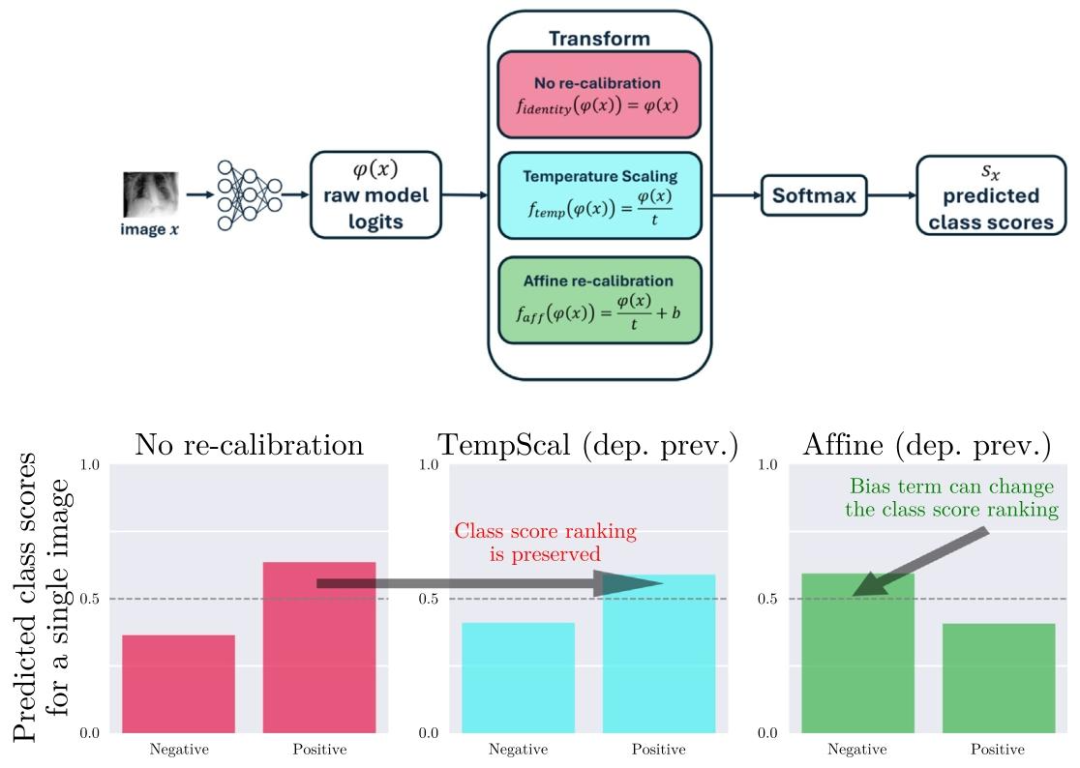
Fig. 2. Methods for re-calibration. Top: Re-calibration transformations are applied to raw model logits before using softmax function and comprise only a few parameters. Bottom: Effect of re-calibration on predicted class scores for a single sample. Commonly used Temperature Scaling (TempScal) (Guo et al., 2017) does not change the predicted class when making argmax decisions. Conversely, Affine re-calibration (Alexandari et al., 2020; Platt, 1999) can impact model decisions.
图2. 模型重新校准方法 上半部分:重新校准变换应用于原始模型对数几率(logits),先于softmax函数执行,且仅包含少量参数。 下半部分:单个样本的重新校准对预测类别分数的影响。常用的温度缩放方法(TempScal,Guo et al., 2017)在使用argmax决策时不会改变预测类别;相反,仿射重新校准方法(Affine re-calibration,Alexandari et al., 2020; Platt, 1999)可能影响模型决策。
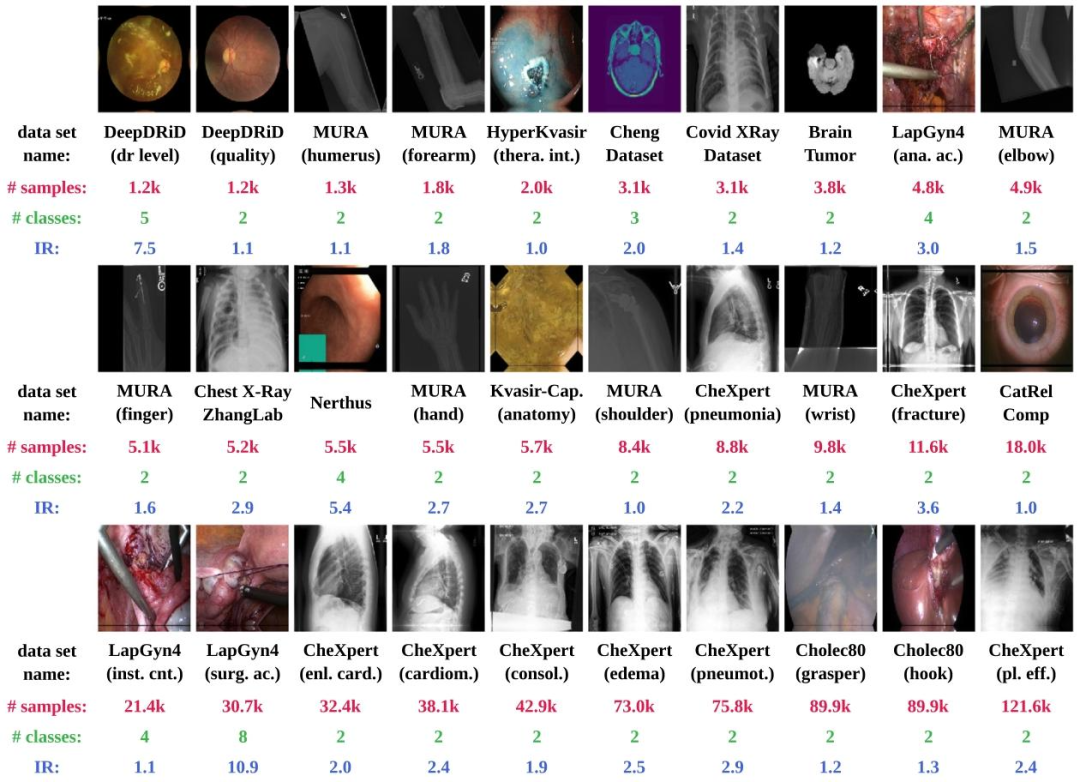
Fig. 3. Medical image classification tasks (n = 30) used in this study. We provide the number of samples (red) and classes (green), which range from 1200 to 121,583 and two to eight, respectively. The intrinsic imbalance ratio (IR) (blue), before we perform splitting and subsample deployment scenarios for our experiments, varies between 1 and 10.9. Parentheses indicate specific sub-tasks of a dataset.
图3. 本研究中使用的30项医学图像分类任务 图中展示了样本数量(红色)和类别数(绿色),样本量范围从1200到121,583,类别数从2到8不等。在进行实验的拆分和子样本部署场景之前,内在不平衡率(IR,蓝色)在1到10.9之间变化。括号内标注了数据集的具体子任务。
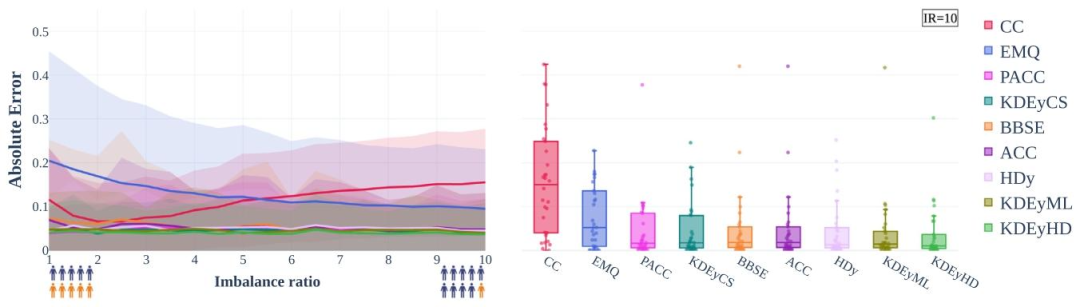
Fig. 4. Prevalences can be accurately and robustly estimated in a data-driven manner (RQ1). The Absolute Error (=L1 Distance) of estimated prevalences may be kept constant with an increasing prevalence shift from development (balanced) to deployment test set for a variety of quantification methods. Left: Mean (line) and standard deviation (shaded area) obtained from n = 30 medical classification tasks. Right: Absolute Error values for all tasks at imbalance ratio 10 (right most point from left figure). Each box spans from quartile 1 (Q1) to quartile 3 (Q3). The second quartile (Q2) is marked by a line inside the box. The whiskers correspond to the box’ edges ±1.5 times the interquartile range (IQR: Q3-Q1). The nine different quantification methods are characterized in Section 2.4.2.
图4. 流行率可通过数据驱动方式准确且稳健地估计(RQ1) 对于多种量化方法,当流行率从开发集(平衡)到部署测试集的偏移逐渐增加时,估计流行率的绝对误差(=L1距离)可保持恒定。 - 左侧:30项医学分类任务的均值(线条)和标准差(阴影区域)。 - 右侧:不平衡率为10时(左侧图最右侧点)所有任务的绝对误差值。每个箱体表示从第一四分位数(Q1)到第三四分位数(Q3),箱内线条为中位数(Q2),须线对应箱体边缘±1.5倍四分位距(IQR: Q3-Q1)。 九种不同量化方法的特性见2.4.2节。
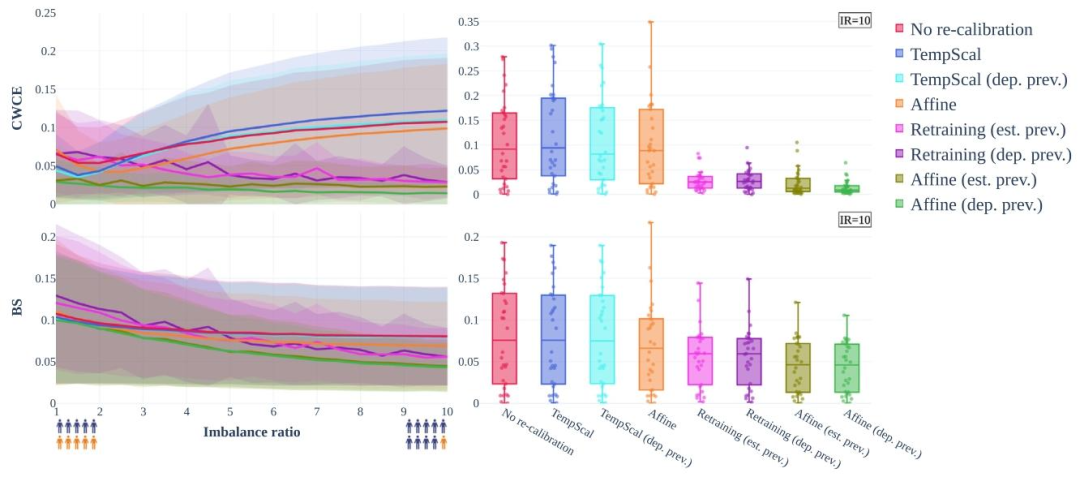
Fig. 5. Prevalence shifts severely impact calibration quality (RQ2a). Class-wise Calibration Error (CWCE) at the top to measure model calibration and Brier Score (BS) at the bottom to measure the overall quality of the predicted class scores (lower is better for both), when shifting from a balanced deployment scenario to an imbalance ratio (IR) of 10. Left: Mean (line) and standard deviation (shaded area) obtained from n = 30 medical classification tasks. Right: Values for all tasks at imbalance ratio 10 as box plot. Temperature Scaling (Guo et al., 2017) (blue) as a commonly used re-calibration method does not address the miscalibration, neither does Affine re-calibration without proper re-weighting (orange). Retraining with known prevalences largely compensates for the effect (pink & purple). The best results are achieved with the proposed approach of prevalence-aware Affine re-calibration (green).
图5. 流行率偏移对校准质量的显著影响(RQ2a) 当从平衡部署场景转为不平衡率(IR)为10的场景时,顶部的类别校准误差(CWCE)用于衡量模型校准质量,底部的布里尔分数(BS)用于衡量预测类别分数的整体质量(两者均为值越低越好)。 - 左侧:30项医学分类任务的均值(线条)和标准差(阴影区域)。 - 右侧:不平衡率为10时所有任务的箱线图。 常用的重新校准方法温度缩放(TempScal,蓝色)无法解决校准错误,未适当重新加权的仿射重新校准(橙色)同样无效。已知流行率的重新训练(粉色和紫色)可大幅补偿影响,但本研究提出的流行率感知仿射重新校准方法(绿色)实现了最佳结果。
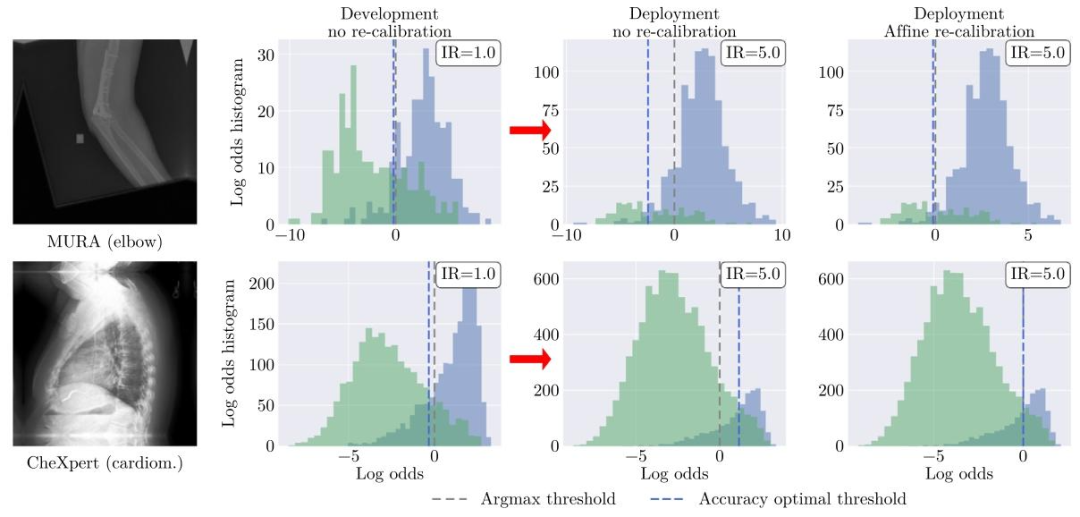
Fig. 6. In the presence of prevalence shifts, the argmax operator may lose its property as an optimal decision rule for the Accuracy metric. Histogram of log odds for two sample binary tasks on the (balanced) development test set (second column) and on the imbalanced deployment data at imbalance ratio (IR) 5, without (third column) and with re-calibration (fourth column). The optimal decision threshold for Accuracy (dashed blue line) is severely impacted by the prevalence shift and miscalibration.
图6. 当存在流行率偏移时,argmax操作可能失去作为准确率(Accuracy)指标最优决策规则的特性 (平衡)开发测试集(第二列)和不平衡率(IR)为5的部署数据(第三、四列,分别为未重新校准和重新校准)上两个样本二分类任务的对数几率直方图。 - 蓝色虚线表示准确率的最优决策阈值,其显著受流行率偏移和校准错误的影响。 - 未重新校准时,流行率偏移导致决策阈值偏离最优位置,使准确率下降;重新校准后,决策阈值更接近真实最优值,恢复模型决策的合理性。
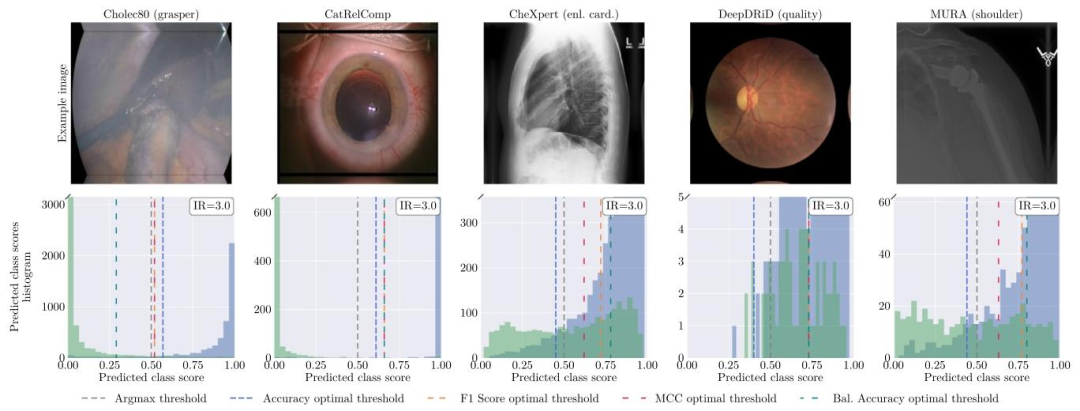
Fig. 7. Optimal decision thresholds depend on assessment metrics. Histogram of predicted class scores for five sample binary tasks (from left to right: Cholec80 (Twinanda et al., 2017), CatRelComp (Ghamsarian et al., 2020), CheXpert (Irvin et al., 2019), DeepDRiD (Liu et al., 2022), MURA (Rajpurkar et al., 2018)) on the deployment data at imbalance ratio (IR) 3 after re-calibration. Dotted lines mark optimal decision thresholds for multiple validation metrics: Accuracy, F1 Score, Matthews Correlation Coefficient (MCC) plus the common argmax threshold (at 0.5 for these binary tasks).
图7. 最优决策阈值取决于评估指标 重新校准后,不平衡率(IR)为3的部署数据上五个样本二分类任务(从左到右:Cholec80(Twinanda等人,2017)、CatRelComp(Ghamsarian等人,2020)、CheXpert(Irvin等人,2019)、DeepDRiD(Liu等人,2022)、MURA(Rajpurkar等人,2018))的预测类别分数直方图。虚线标记了多种验证指标的最优决策阈值:准确率(Accuracy)、F1分数、马修斯相关系数(MCC)以及常用的argmax阈值(对于这些二分类任务为0.5)。
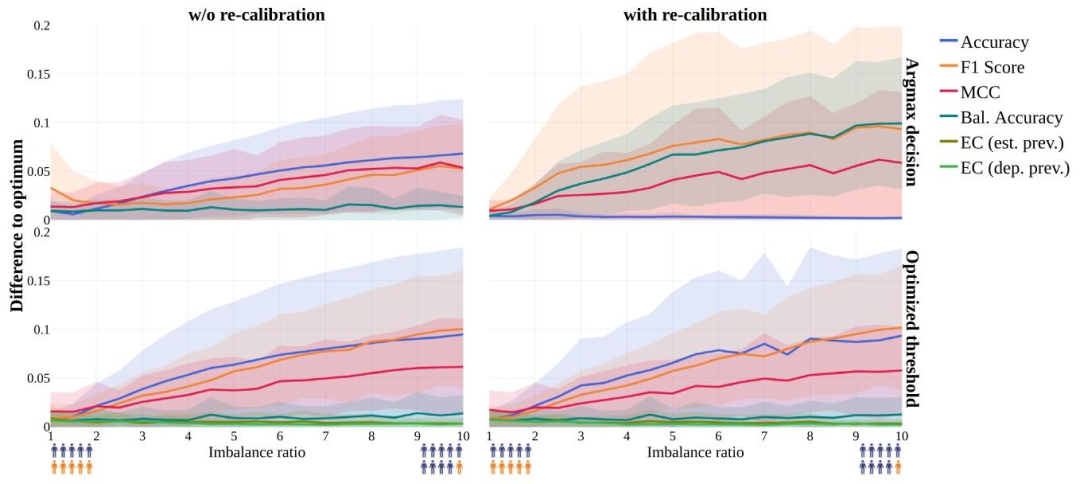
Fig. 8. Optimal decision rules do not generalize to datasets with different prevalences (RQ2b). The difference between the actual and the optimal metric value on the deployment data is shown as a function of the imbalance ratio for non-re-calibrated (left) and re-calibrated (right) models for two decision rule strategies: argmax (top) and threshold optimization on the development test set (bottom). Affine re-calibration trained with loss weights adapted to deployment prevalences ?? ????(??) is used for all metrics exept EC (est. prev.) for which the weights are adapted using estimated prevalences ̂ ?? ????(??) for consistency (right). The optimal metric value is obtained using the optimal decision rule for the deployment data. Mean (lines) and standard deviation (transparent area) obtained from n = 24 binary tasks. Source: Adapted from Godau et al. (2023).
图 8. 最优决策规则无法推广到不同流行率的数据集(RQ2b)对于两种决策规则策略 ——argmax(上)和开发测试集上的阈值优化(下),部署数据上实际指标值与最优指标值的差异随不平衡率的变化如图所示,左侧为未重新校准的模型,右侧为重新校准的模型。除 EC(est. prev.,使用估计流行率P^depl(y)调整权重以保持一致性)外,所有指标均使用根据部署流行率Pdepl(y)调整损失权重的仿射重新校准训练。最优指标值通过部署数据的最优决策规则获得,结果基于 24 项二分类任务的均值(线条)和标准差(透明区域)。
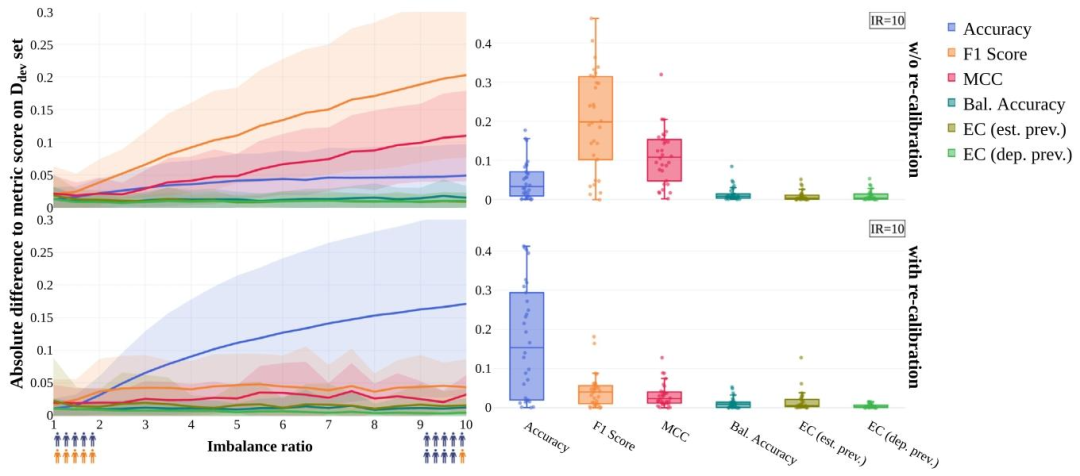
Fig. 9. Performance estimates based on development data can become invalid under prevalence shifts (RQ2c). The absolute difference of the metric score computed on the deployment data to that computed on the development test set is shown as a function of the imbalance ratio (IR) for non-re-calibrated (top) and re-calibrated (bottom) models. The dot- and boxplots show the results for all n = 30 tasks at a fixed IR of 10. Only metrics that are agnostic to development prevalences – here Expected Cost (EC) configured with target prevalences and Balanced Accuracy (BA) – allow for comparison of conclusions. Source: Adapted from Godau et al. (2023).
图 9. 流行率偏移下基于开发数据的性能估计可能失效(RQ2c)对于未重新校准(上)和重新校准(下)的模型,部署数据与开发测试集计算的指标分数绝对差异随不平衡率(IR)的变化如图所示。点图和箱线图展示了所有 30 项任务在固定 IR=10 时的结果。仅对开发流行率不敏感的指标(如配置目标流行率的预期成本(EC)和平衡准确率(BA))允许结论的跨场景比较。来源:改编自 Godau 等人(2023)。
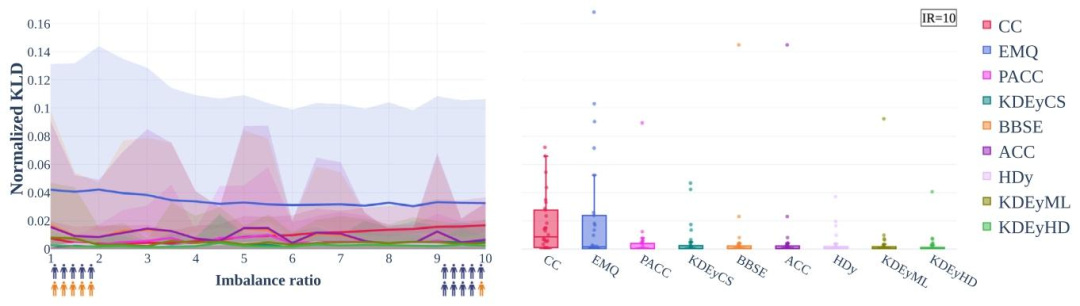
Fig. D.10. Prevalences can be accurately and robustly estimated in a data-driven manner (RQ1), extension to Fig. 4. The Normalized Kullback–Leibler divergence (KLD) of estimated prevalences may be kept constant with an increasing prevalence shift from development (balanced) to deployment test set for a variety of quantification methods. The nine different quantification methods are characterized in Section 2.4.2
图D.10. 流行率可通过数据驱动方式准确且稳健地估计(RQ1,图4的扩展) 对于多种量化方法,当流行率从开发集(平衡)到部署测试集的偏移逐渐增加时,估计流行率的归一化库尔贝克-莱布勒散度(KLD)可保持恒定。九种不同量化方法的特性见2.4.2节。
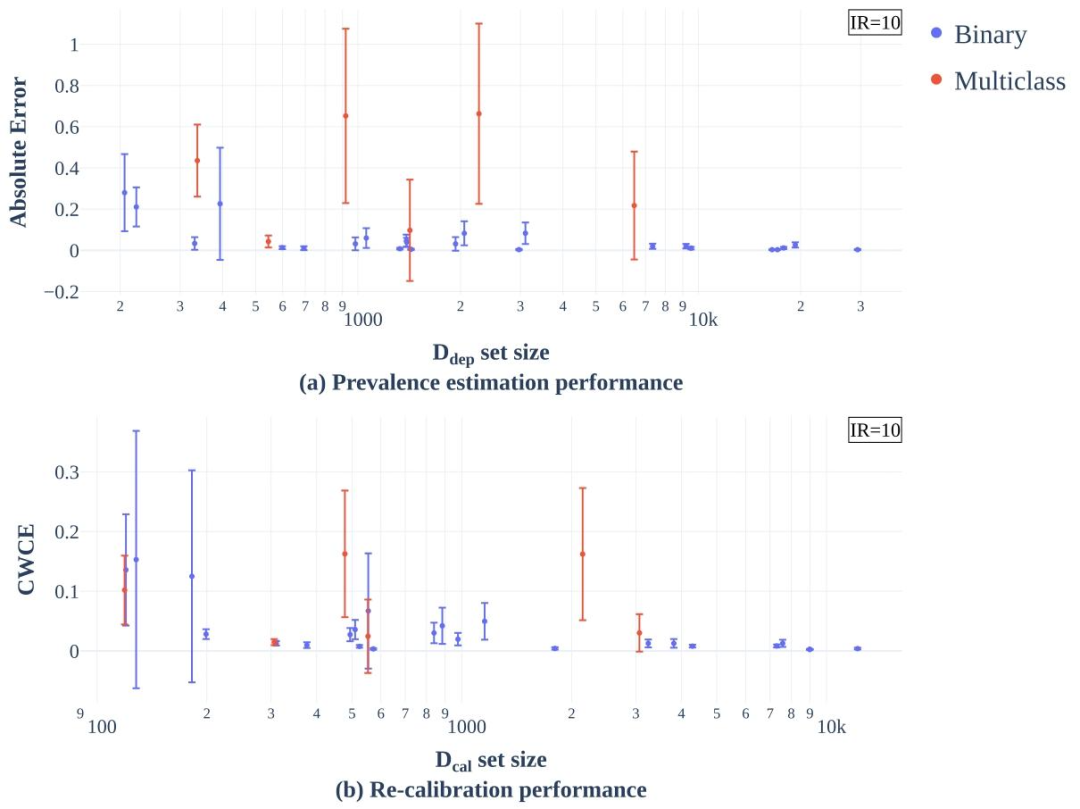
Fig. E.11. Performance of quantification and re-calibration improves for larger dataset sizes. Effect of dataset size on prevalence estimation and re-calibration quality for all 30 datasets at IR = 10. For every dataset we used 15 repetitions with different random seeds for computations (10) and data splitting (5). Each bar represents one dataset with the mean as center and the standard deviation as expanse. Multiclass datasets are colored red in contrast to binary tasks (blue). (a) The Absolute Error of prevalences estimated with KDEyHD in relation to the size of the ???? ???? split, which is used for prevalence estimation. No normalization was applied to correct for the different dimensionality of multiclass tasks. (b) The Class-wise Calibration Error (CWCE) for the Affine re-calibration using estimated prevalences in relation to the size of the ???? ???? split, which is used for re-calibration.
图E.11. 数据集规模越大,量化和重新校准的性能越好 不平衡率(IR)=10时,数据集规模对所有30个数据集的流行率估计和重新校准质量的影响。对于每个数据集,我们使用不同随机种子进行了15次重复计算(10次用于计算,5次用于数据拆分)。每个条形图代表一个数据集,中心为均值,宽度为标准差。多分类数据集用红色表示,二分类任务用蓝色表示。 (a)使用KDEyHD估计的流行率绝对误差与用于流行率估计的(D{unlab})拆分数据集规模的关系。未对多分类任务的不同维度进行归一化处理。 (b)使用估计流行率进行仿射重新校准的类别校准误差(CWCE)与用于重新校准的(D{unlab})拆分数据集规模的关系。
Table
表
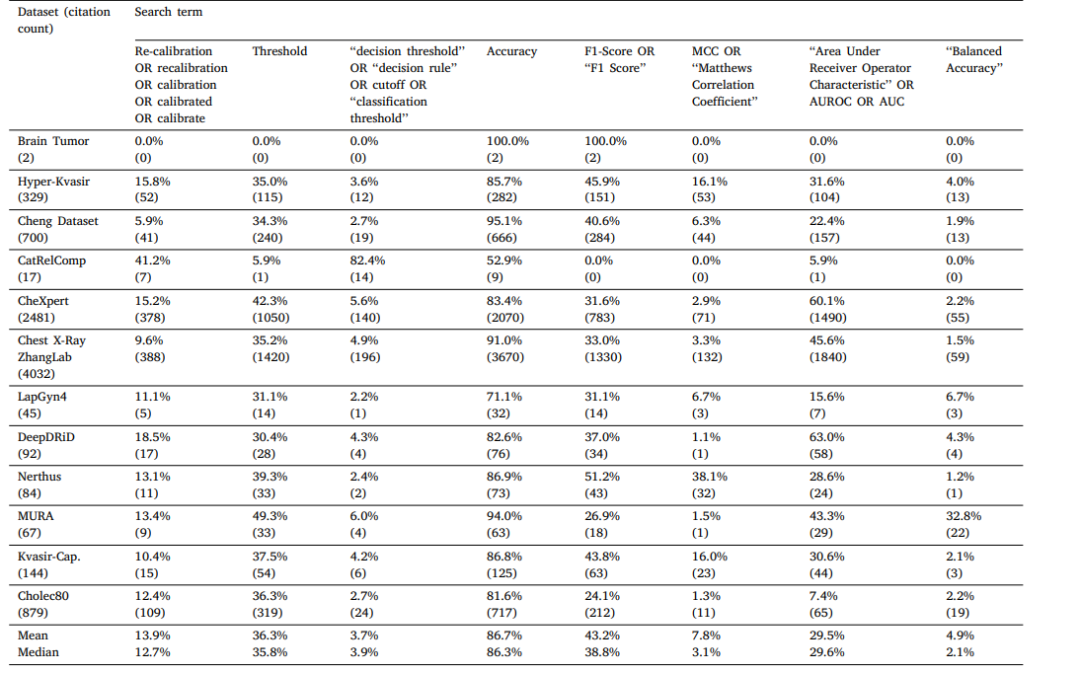
Table A.1 Search term frequency within the literature citing any of the datasets we used.
表A.1 引用我们所使用的任何数据集的文献中搜索词的出现频率。