Python绘制3D图表
import plotly.graph_objects as go
import networkx as nx
import pandas as pd# 创建有向图
G = nx.DiGraph()# 添加节点和属性
nodes = [{"id": "北京申奥", "type": "核心", "size": 25, "color": "#FF5733"},{"id": "绿色奥运", "type": "理念", "size": 20, "color": "#33FF57"},{"id": "科技奥运", "type": "理念", "size": 20, "color": "#3357FF"},{"id": "人文奥运", "type": "理念", "size": 20, "color": "#F333FF"},{"id": "鸟巢", "type": "场馆", "size": 15, "color": "#FFC300"},{"id": "水立方", "type": "场馆", "size": 15, "color": "#FFC300"},{"id": "空气质量改善", "type": "成果", "size": 12, "color": "#DAF7A6"},{"id": "赛事直播技术", "type": "成果", "size": 12, "color": "#DAF7A6"},
]# 添加节点到图
for node in nodes:G.add_node(node["id"], **node)# 添加边
edges = [("北京申奥", "绿色奥运", "包含"),("北京申奥", "科技奥运", "包含"),("北京申奥", "人文奥运", "包含"),("绿色奥运", "鸟巢", "指导建设"),("科技奥运", "水立方", "技术支持"),("绿色奥运", "空气质量改善", "推动"),("科技奥运", "赛事直播技术", "推动"),
]# 添加边到图
for u, v, label in edges:G.add_edge(u, v, label=label)# 生成3D布局
pos = nx.spring_layout(G, dim=3, seed=42)# 提取节点和边的坐标
node_x, node_y, node_z = [], [], []
node_text, node_color, node_size = [], [], []for node in G.nodes():x, y, z = pos[node]node_x.append(x)node_y.append(y)node_z.append(z)node_text.append(f"{node}: {G.nodes[node]['type']}")node_color.append(G.nodes[node]['color'])node_size.append(G.nodes[node]['size'])edge_x, edge_y, edge_z = [], [], []
edge_text = []for edge in G.edges():x0, y0, z0 = pos[edge[0]]x1, y1, z1 = pos[edge[1]]edge_x.extend([x0, x1, None])edge_y.extend([y0, y1, None])edge_z.extend([z0, z1, None])edge_text.append(G.edges[edge]['label'])# 创建3D散点图表示节点
node_trace = go.Scatter3d(x=node_x, y=node_y, z=node_z,mode='markers',hoverinfo='text',marker=dict(size=node_size,color=node_color,line=dict(width=2, color='DarkSlateGrey')),text=node_text
)# 创建线图表示边
edge_trace = go.Scatter3d(x=edge_x, y=edge_y, z=edge_z,mode='lines',hoverinfo='none',line=dict(color='gray', width=1)
)# 创建标注
annotations = []
for i, (node, (x, y, z)) in enumerate(pos.items()):annotations.append(dict(showarrow=False,text=node,x=x, y=y, z=z,xanchor='center',yanchor='bottom',font=dict(family='SimHei', size=12, color='black')))# 创建图表
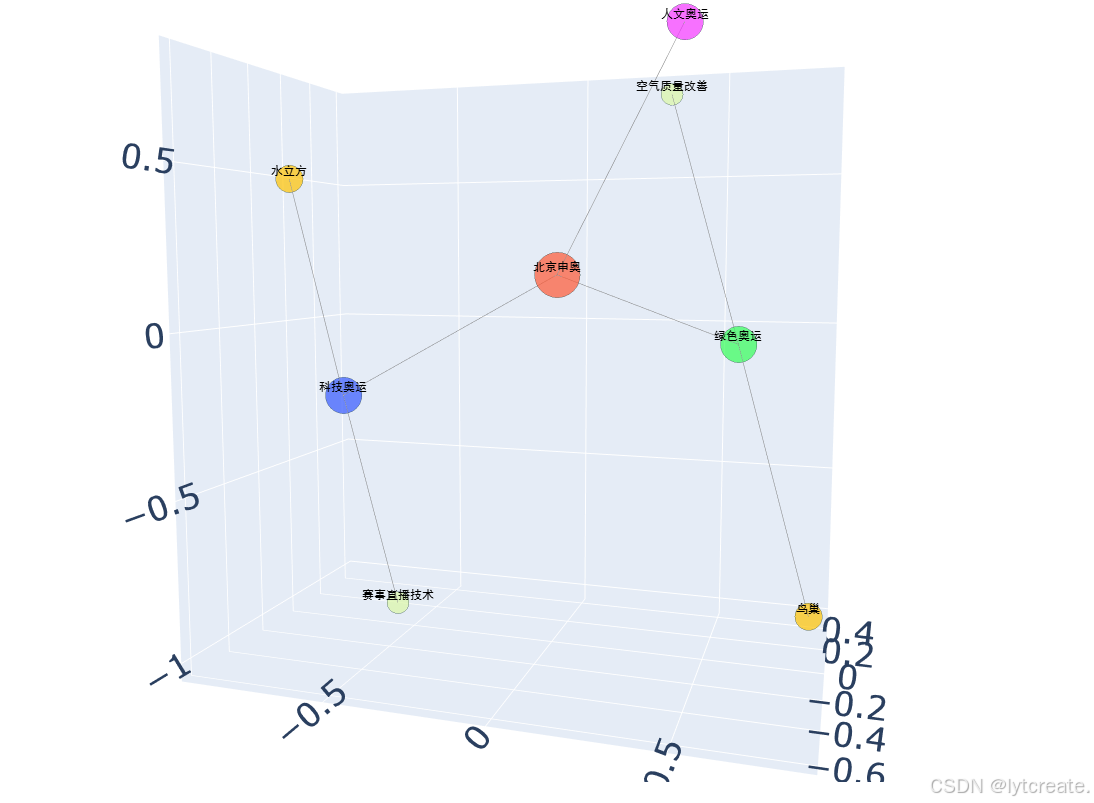
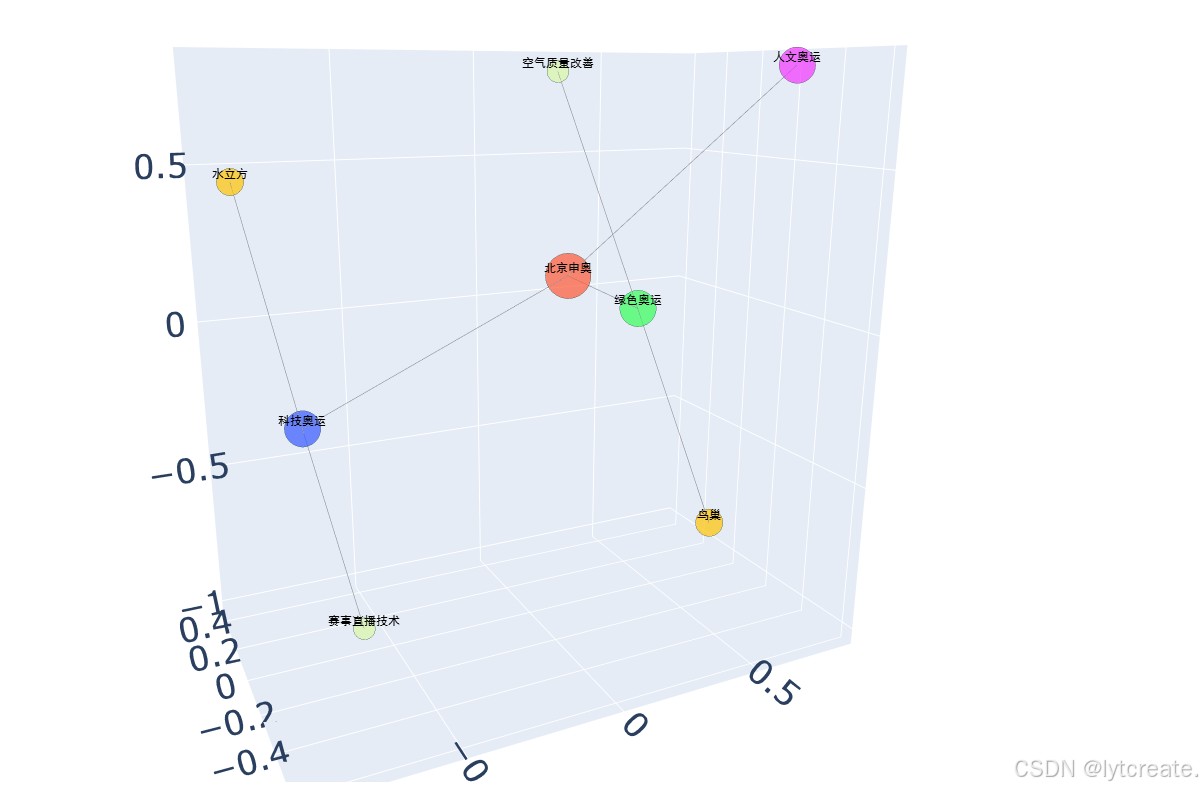
fig = go.Figure(data=[edge_trace, node_trace],layout=go.Layout(title='<b>2008北京申奥知识地图 (3D)</b>',font_size=20,showlegend=False,hovermode='closest',margin=dict(b=20, l=5, r=5, t=40),scene=dict(xaxis_title='',yaxis_title='',zaxis_title='',annotations=annotations,camera=dict(up=dict(x=0, y=0, z=1),center=dict(x=0, y=0, z=0),eye=dict(x=1.25, y=1.25, z=1.25)))))# 显示图表
fig.show()绘制效果如下: