可视化性能分析工具火焰图
- 简介
使用flamegraph工具可以将linux或者windows下堆栈信息采集工具采集的操作系统层面的进程堆栈信息转化为可视化的图形显示,方便分析进程执行的性能问题。支持的堆栈采集命令包括:
- Linux: perf (perf script report flamegraph)
- Windows: WPA, PerfView
linux下的perf命令需要操作系统安装对应版本的python
- 使用
flamegraphs主页:Flame Graphs
下载:https://github.com/brendangregg/FlameGraph
生成火焰图步骤:
- 下载flamegrapsh
# git clone https://github.com/brendangregg/FlameGraph
- 使用linux的perf命令手机进程堆栈信息
# cd FlameGraph
# perf record -F 99 -a -g -- sleep 60
perf命令参数说明:
-e, --event=EVENT: 指定要监控的特定性能事件,例如 CPU 时钟周期、指令计数器、缓存未命中的次数等。例如 perf record -e cycles my_program 会记录 my_program 运行过程中的 CPU 周期数。
-p, --pid=PID: 跟踪指定进程 ID 的性能数据,例如 perf record -p 12345 会监控进程ID为12345的进程。
-g, --call-graph=[fp| dwarf| lbr]: 启用调用栈跟踪,收集函数调用层级信息。不同的选项对应不同的调用图生成方式。
-F, --freq=N: 设置采样频率,比如 -F 99 表示每秒采样99次。
-a, --all-cpus: 监控所有CPU核心的性能数据。
sleep N: 结合命令一起使用时,会让 perf record 在执行指定命令后等待 N 秒再停止记录。
perf record 执行后会在当前工作目录下生成一个名为 perf.data 的二进制文件,其中包含了所有收集到的性能数据。
- 使用flamegraph根据perf命令生成的perf.dat文件生成火焰图
# perf script | ./stackcollapse-perf.pl | ./flamegraph.pl > out.svg
使用浏览器查看生成的out.svg文件,例如:
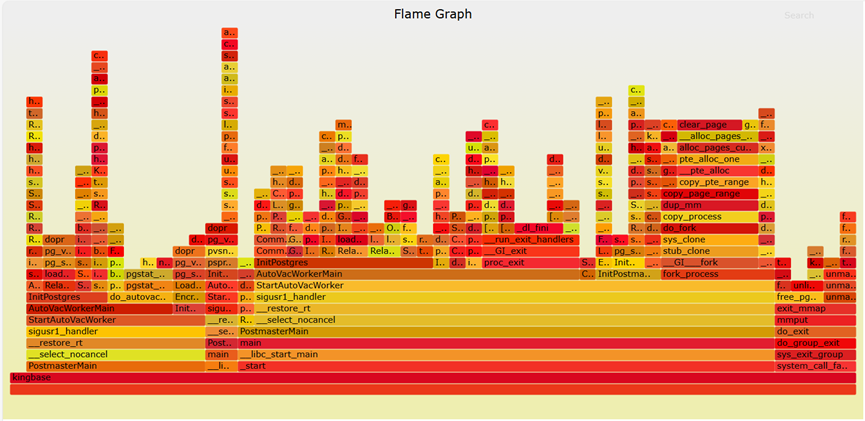
- 火焰图分析
A stack trace is represented as a column of boxes, where each box represents a function (a stack frame).
堆栈跟踪表示为一列框,其中每个框表示一个函数
• The y-axis shows the stack depth, ordered from root at the bottom to leaf at the top. The top box shows the function that was on-CPU when the stack trace was collected, and everything beneath that is its ancestry. The function beneath a function is its parent.
y轴显示了堆栈深度,从底部的根到顶部的叶依次排序。顶部框显示了收集堆栈跟踪时在CPU上运行的函数,其下的所有内容都是其祖先。函数下面的函数是其父函数。
• The x-axis spans the stack trace collection. It does not show the passage of time, so the left-to-right ordering has no special meaning. The left-to-right ordering of stack traces is performed alphabetically on the function names, from the root to the leaf of each stack. This maximizes box merging: when identical function boxes are horizontally adjacent, they are merged.
x轴横跨堆栈跟踪集合。它不显示时间的流逝,因此从左到右的顺序没有特殊意义。堆栈跟踪的从左到右排序是按函数名的字母顺序执行的,从每个堆栈的根到叶子。这最大化了框合并:当相同的功能框水平相邻时,它们会被合并。
• The width of each function box shows the frequency at which that function was present in the stack traces, or part of a stack trace ancestry. Functions with wide boxes were more present in the stack traces than those with narrow boxes, in proportion to their widths.
每个函数框的宽度显示了该函数在堆栈跟踪中出现的频率,或堆栈跟踪祖先的一部分。与窄框的函数相比,宽框的函数在堆栈跟踪中出现的频繁,与它们的宽度成正比。
• If the width of the box is sufficient, it displays the full function name. If not, either a truncated function name with an ellipsis is shown, or nothing.
如果框的宽度足够,它将显示完整的函数名称。如果没有,则显示带省略号的截断函数名,或者什么都不显示。
• The background color for each box is not significant and is picked at random to be a warm hue. This randomness helps the eye differentiate boxes, especially for adjacent thin "towers." Other color schemes are discussed later.
每个框的背景颜色并不重要,而是随机选择为暖色。这种随机性有助于眼睛区分盒子,特别是对于相邻的薄“塔”。
• The profile visualized may span a single thread, multiple threads, multiple applications, or multiple hosts. Separate flame graphs can be generated if desired, especially for studying individual threads.
可视化的描述可以跨越单个线程、多个线程、多应用程序或多个主机。如果需要,可以生成单独的火焰图,特别是用于研究单个线程。
• Stack traces may be collected from different profiler targets, and widths can reflect measures other than sample counts. For example, a profiler (or tracer) could measure the time a thread was blocked, along with its stack trace. This can be visualized as a flame graph, where the x-axis spans the total blocked time, and the flame graph shows the blocking code paths.
堆栈跟踪可以从不同的分析器目标收集,宽度可以反映除样本计数以外的测量值。例如,分析器(或跟踪器)可以测量线程被阻塞的时间及其堆栈信息。这可以可视化为火焰图,其中x轴跨越总阻塞时间,火焰图显示阻塞代码路径。
- 使用火焰图
The top edge of the flame graph shows the function that was running on the CPU when the stack trace was collected. For CPU profiles, this is the function that is directly consuming CPU cycles. For other profile types, this is the function that directly led to the instrumented event.
火焰图的上边缘显示了收集堆栈信息时CPU上运行的函数。对于CPU的运行信息而言,这是直接消耗CPU周期的函数。对于其他配置文件类型,这是直接导致检测事件的函数。
• Look for large plateaus along the top edge, as these show a single stack trace was frequently present in the profile. For CPU profiles, this means a single function was frequently running on-CPU.
寻找顶部边缘的大平台,因为这些平台显示经常出现的单个堆栈信息。对于CPU运行情况来说,这意味着一个函数经常在CPU上运行。
• Reading top down shows ancestry. A function was called by its parent, which is shown directly below it; the parent was called by its parent shown below it, and so on. A quick scan downward from a function identifies why it was called.
自上而下的关系显示了祖先。函数由其父级调用,直接显示在其下方;父级由其下方显示的父级调用,以此类推。从函数向下快速扫描可以确定调用它的原因。
• Reading bottom up shows code flow and the bigger picture. A function calls any child functions shown above it, which, in turn, call functions shown above them. Reading bottom up also shows the big picture of code flow before various forks split execution into smaller towers.
自下而上阅读可以显示代码流和程序整体架构。一个函数调用上面显示的任何子函数,子函数又调用它们上面显示的函数。自下而上的阅读也展示了在各种分叉将执行拆分为更小的路径之前的代码流的全貌。
• The width of function boxes can be directly compared: wider boxes mean a greater presence in the profile and are the most important to understand first.
功能框的宽度可以直接比较:较宽的框意味着在进程出现的频率比较高,这是首先要理解的最重要的。
• For CPU profiles that employ timed sampling of stack traces, if a function box is wider than another, this may be because it consumes more CPU per function call or that the function was simply called more often. The function-call count is not shown or known via sampling.
对于采用堆栈跟踪定时采样的CPU运行信息,如果一个函数框比另一个更宽,这可能是因为它每次函数调用消耗更多的CPU,或者该函数只是被更频繁地调用。函数调用计数不会通过采样显示
• Major forks in the flame graph, spotted as two or more large towers atop a single function, can be useful to study. They can indicate a logical grouping of code, where a function processes work in stages, each with its own function. It can also be caused by a conditional statement, which chooses which function to call.
火焰图中的主要分叉,如单个功能上的两个或多个大型塔楼,可用于研究。它们可以指示代码的逻辑分组,其中函数处理分阶段工作,每个阶段都有自己的函数。它也可能是由选择调用哪个函数的条件语句引起的。
- 例子
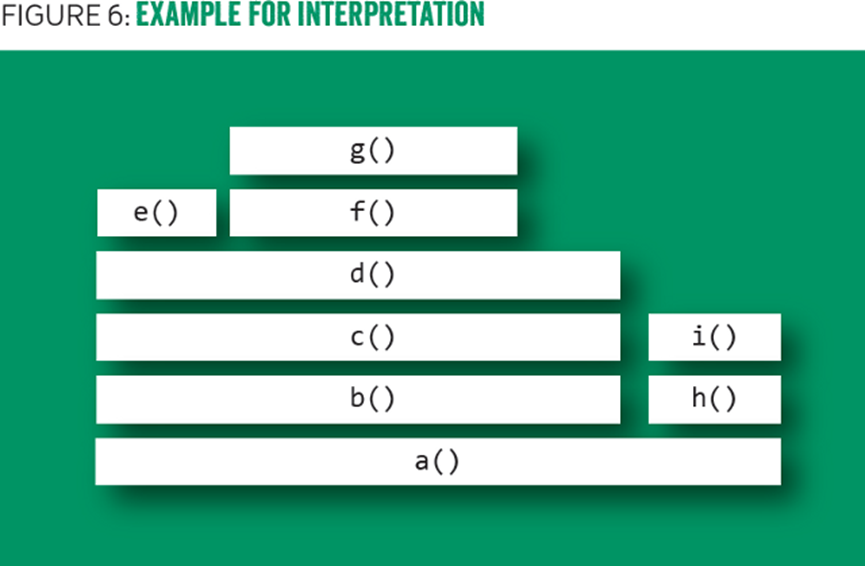
顶部边缘显示函数g()在CPU上占用最多;d()更宽,但其暴露的顶部边缘对CPU的占用最小。包括b()和c()在内的函数似乎没有直接在CPU上采样;相反,他们的子功能正在运行。
g()下面的函数显示了它的祖先:g()由f()调用,f()由d()调用等等。
通过直观地比较函数b()和h()的宽度,可以看出b()的代码路径在CPU上比h()多四倍。在每种情况下,CPU上的实际功能都是他们的孩子。
代码路径中的一个主要分支是可见的,其中A()调用b()和h()。理解代码为什么这样做可能是其逻辑组织的主要线索。这可能是条件的结果(如果是条件的,则调用b(),否则调用h())或阶段的逻辑分组(其中a()分为两部分:b()和h()处理)。