PyQt6基础_pyqtgraph_k线图缩放
目录
前置:
代码
演示
视频
前置:
1 pyqtgraph默认的缩放功能经常让K线不消失在可视区域,与通达信等软件的缩放体验差别巨大
2 pyqtgraph的缩放策略是以鼠标所在位置为中心进行x轴和y轴的缩放。当鼠标所在位置偏离K线主体很远时,K线主体经常消失,或者K线显示不全
3 修改思想,不管放大还是缩小,计算缩放后K线主体的x轴y轴范围,将缩放后的可视区域设置为缩放后K线主体的x轴和y轴范围,这样就能保证可视区域内总是完整的K线图。
4 在 pyqtgraph 里面,鼠标滚轮事件wheelEvent有一个delta可以表征滚轮的向上和向下
向上,放大,delta大于1,显示的内容减少(显示的K线个数减少)
向下,缩小,delta小于1,显示的内容增多(显示的K线个数增多)
根据以上逻辑,重写pg.PlotWidget()里面的wheelEvent
代码
from PyQt6.QtCore import (
QSize
)
from PyQt6.QtWidgets import (
QApplication,
QMainWindow,
QVBoxLayout,
QWidget
)
import pyqtgraph as pg
from pyqtgraph import QtCore, QtGui
import pandas as pd
import numpy as np


## Create a subclass of GraphicsObject.
## The only required methods are paint() and boundingRect()
## (see QGraphicsItem documentation)
class CandlestickItem(pg.GraphicsObject):
    def __init__(self, data):
        pg.GraphicsObject.__init__(self)
        self.data = data  ## data must have fields: time, open, close, min, max
        self.generatePicture()

    def generatePicture(self):
        ## pre-computing a QPicture object allows paint() to run much more quickly,
        ## rather than re-drawing the shapes every time.
        self.picture = QtGui.QPicture()
        p = QtGui.QPainter(self.picture)
        p.setPen(pg.mkPen('w'))
        w = (self.data[1][0] - self.data[0][0]) / 3.
        for (t, open, close, min, max) in self.data:
            p.drawLine(QtCore.QPointF(t, min), QtCore.QPointF(t, max))
            if open > close:
                p.setBrush(pg.mkBrush('r'))
            else:
                p.setBrush(pg.mkBrush('g'))
            p.drawRect(QtCore.QRectF(t - w, open, w * 2, close - open))
        p.end()

    def paint(self, p, *args):
        p.drawPicture(0, 0, self.picture)

    def boundingRect(self):
        ## boundingRect _must_ indicate the entire area that will be drawn on
        ## or else we will get artifacts and possibly crashing.
        ## (in this case, QPicture does all the work of computing the bouning rect for us)
        return QtCore.QRectF(self.picture.boundingRect())

class StrAxisItem(pg.AxisItem):
    def __init__(self,ticks,*args,**kwargs):
        pg.AxisItem.__init__(self,*args,**kwargs)
        self.x_values = [x[0] for x in ticks]
        self.x_strings = [x[1] for x in ticks]
        pass
    def tickStrings(self, values, scale, spacing):
        strings = []
        for v in values:
            vs = v*scale
            if vs in self.x_values:
                vstr = self.x_strings[self.x_values.index(vs)]
            else:
                vstr = ''
            strings.append(vstr)
        return strings

class KPlotWidget(pg.PlotWidget):
    def __init__(self,*args,**kwargs):
        super().__init__(*args,**kwargs)
        self.df_data:pd.DataFrame = pd.DataFrame()
        pass
    def setDfData(self,data:pd.DataFrame):
        self.df_data = data
        pass
    def wheelEvent(self, ev):
        if len(self.df_data) <= 0:
            super().wheelEvent(ev)
        else:
            delta = ev.angleDelta().x()
            if delta == 0:
                delta = ev.angleDelta().y()

            s = 1.001 ** delta

            before_xmin, before_xmax = self.viewRange()[0]
            val_x = self.getViewBox().mapSceneToView(ev.position()).x()

            after_xmin = val_x - (val_x - before_xmin) // s
            after_xmax = val_x + (before_xmax - val_x) // s

            if after_xmin < 0:
                after_xmin = 0
            if after_xmax >= len(self.df_data):
                after_xmax = len(self.df_data) - 1

            df00 = self.df_data.loc[(self.df_data['a00'] >= after_xmin) & (self.df_data['a00'] <= after_xmax)].copy()
            after_ymin = df00['lowestPrice'].min()
            after_ymax = df00['highestPrice'].max()

            self.setXRange(after_xmin, after_xmax)
            self.setYRange(after_ymin, after_ymax)
            pass


class MainWindow(QMainWindow):
    def __init__(self):
        super().__init__()
        self.setWindowTitle('pyqtgragh实例')
        self.setMinimumSize(QSize(800,600))

        self.pw = KPlotWidget()
        self.pw.setMouseEnabled(x=True,y=True)

        layout = QVBoxLayout()
        layout.addWidget(self.pw)
        widget = QWidget()
        widget.setLayout(layout)
        self.setCentralWidget(widget)
        self.open_init()
        pass
    def open_init(self):
        df = pd.read_excel(r'E:/temp003/600584_adj.xlsx',engine='openpyxl')
        df = df.loc[df['turnoverValue']!=0].copy()
        df['a00'] = np.arange(0,len(df))
        data = df.loc[:,['a00','openPrice','closePrice','lowestPrice','highestPrice']].values

        item = CandlestickItem(data)
        # ticks = [(i,j) for i,j in zip(df['a00'].to_list(),df['tradeDate'].to_list())]
        # print(ticks)
        ticks = df.loc[:,['a00','tradeDate']].values
        horAxis = StrAxisItem(ticks=ticks,orientation='bottom')
        # text_item = pg.TextItem(angle=-45,
        #                         html='<div style="transform: rotate(-45deg)">X Axis Label</div>')  # 创建文本项并设置旋转角度
        # horAxis.setLabel(text=text_item, angle=0)
        self.pw.setAxisItems({'bottom':horAxis})
        self.pw.addItem(item)
        self.pw.setDfData(df)
        pass


if __name__ == '__main__':
    app = QApplication([])
    mw = MainWindow()
    mw.show()
    app.exec()
    pass
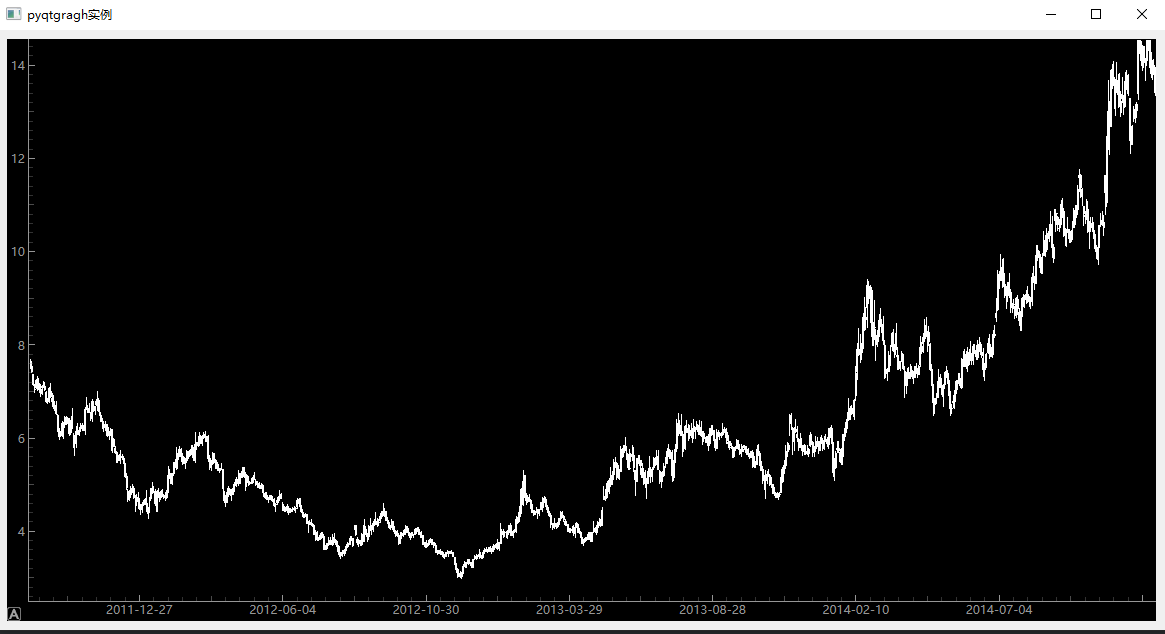
演示
视频
PyQt6基础_pyqtgraph_k线图缩放_哔哩哔哩_bilibili