ArgoCD 可观测性最佳实践
ArgoCD 简介
ArgoCD 是一个基于 GitOps 的持续交付工具,专为 Kubernetes 环境设计,以声明式的方式部署和管理应用程序。
ArgoCD 通过 Prometheus 协议暴露指标,通过这些指标可用于监控 ArgoCD 服务状态和应用状态。ArgoCD 主要暴露三类指标:
- Application Controller Metrics:ArgoCD 应用相关指标,例如应用数、ArgoCD 状态等。
- API Server Metrics:ArgoCD API 请求指标,例如请求数、响应码等。
- Repo Server Metrics:Repo Server 相关指标,例如 Git 请求数、Git 响应时间等。
本次介绍的是通过 KubernetesPrometheus 的自动发现,采集 ArgoCD 的指标数据。
观测云
观测云是一款专为IT工程师打造的全链路可观测产品,它集成了基础设施监控、应用程序性能监控和日志管理,为整个技术栈提供实时可观察性。这款产品能够帮助工程师全面了解端到端的用户体验追踪,了解应用内函数的每一次调用,以及全面监控云时代的基础设施。此外,观测云还具备快速发现系统安全风险的能力,为数字化时代提供安全保障。
部署 DataKit
登录观测云控制台,点击「集成」 -「DataKit」 - 「Kubernetes」,下载 datakit.yaml,拷贝第 3 步中的 token。
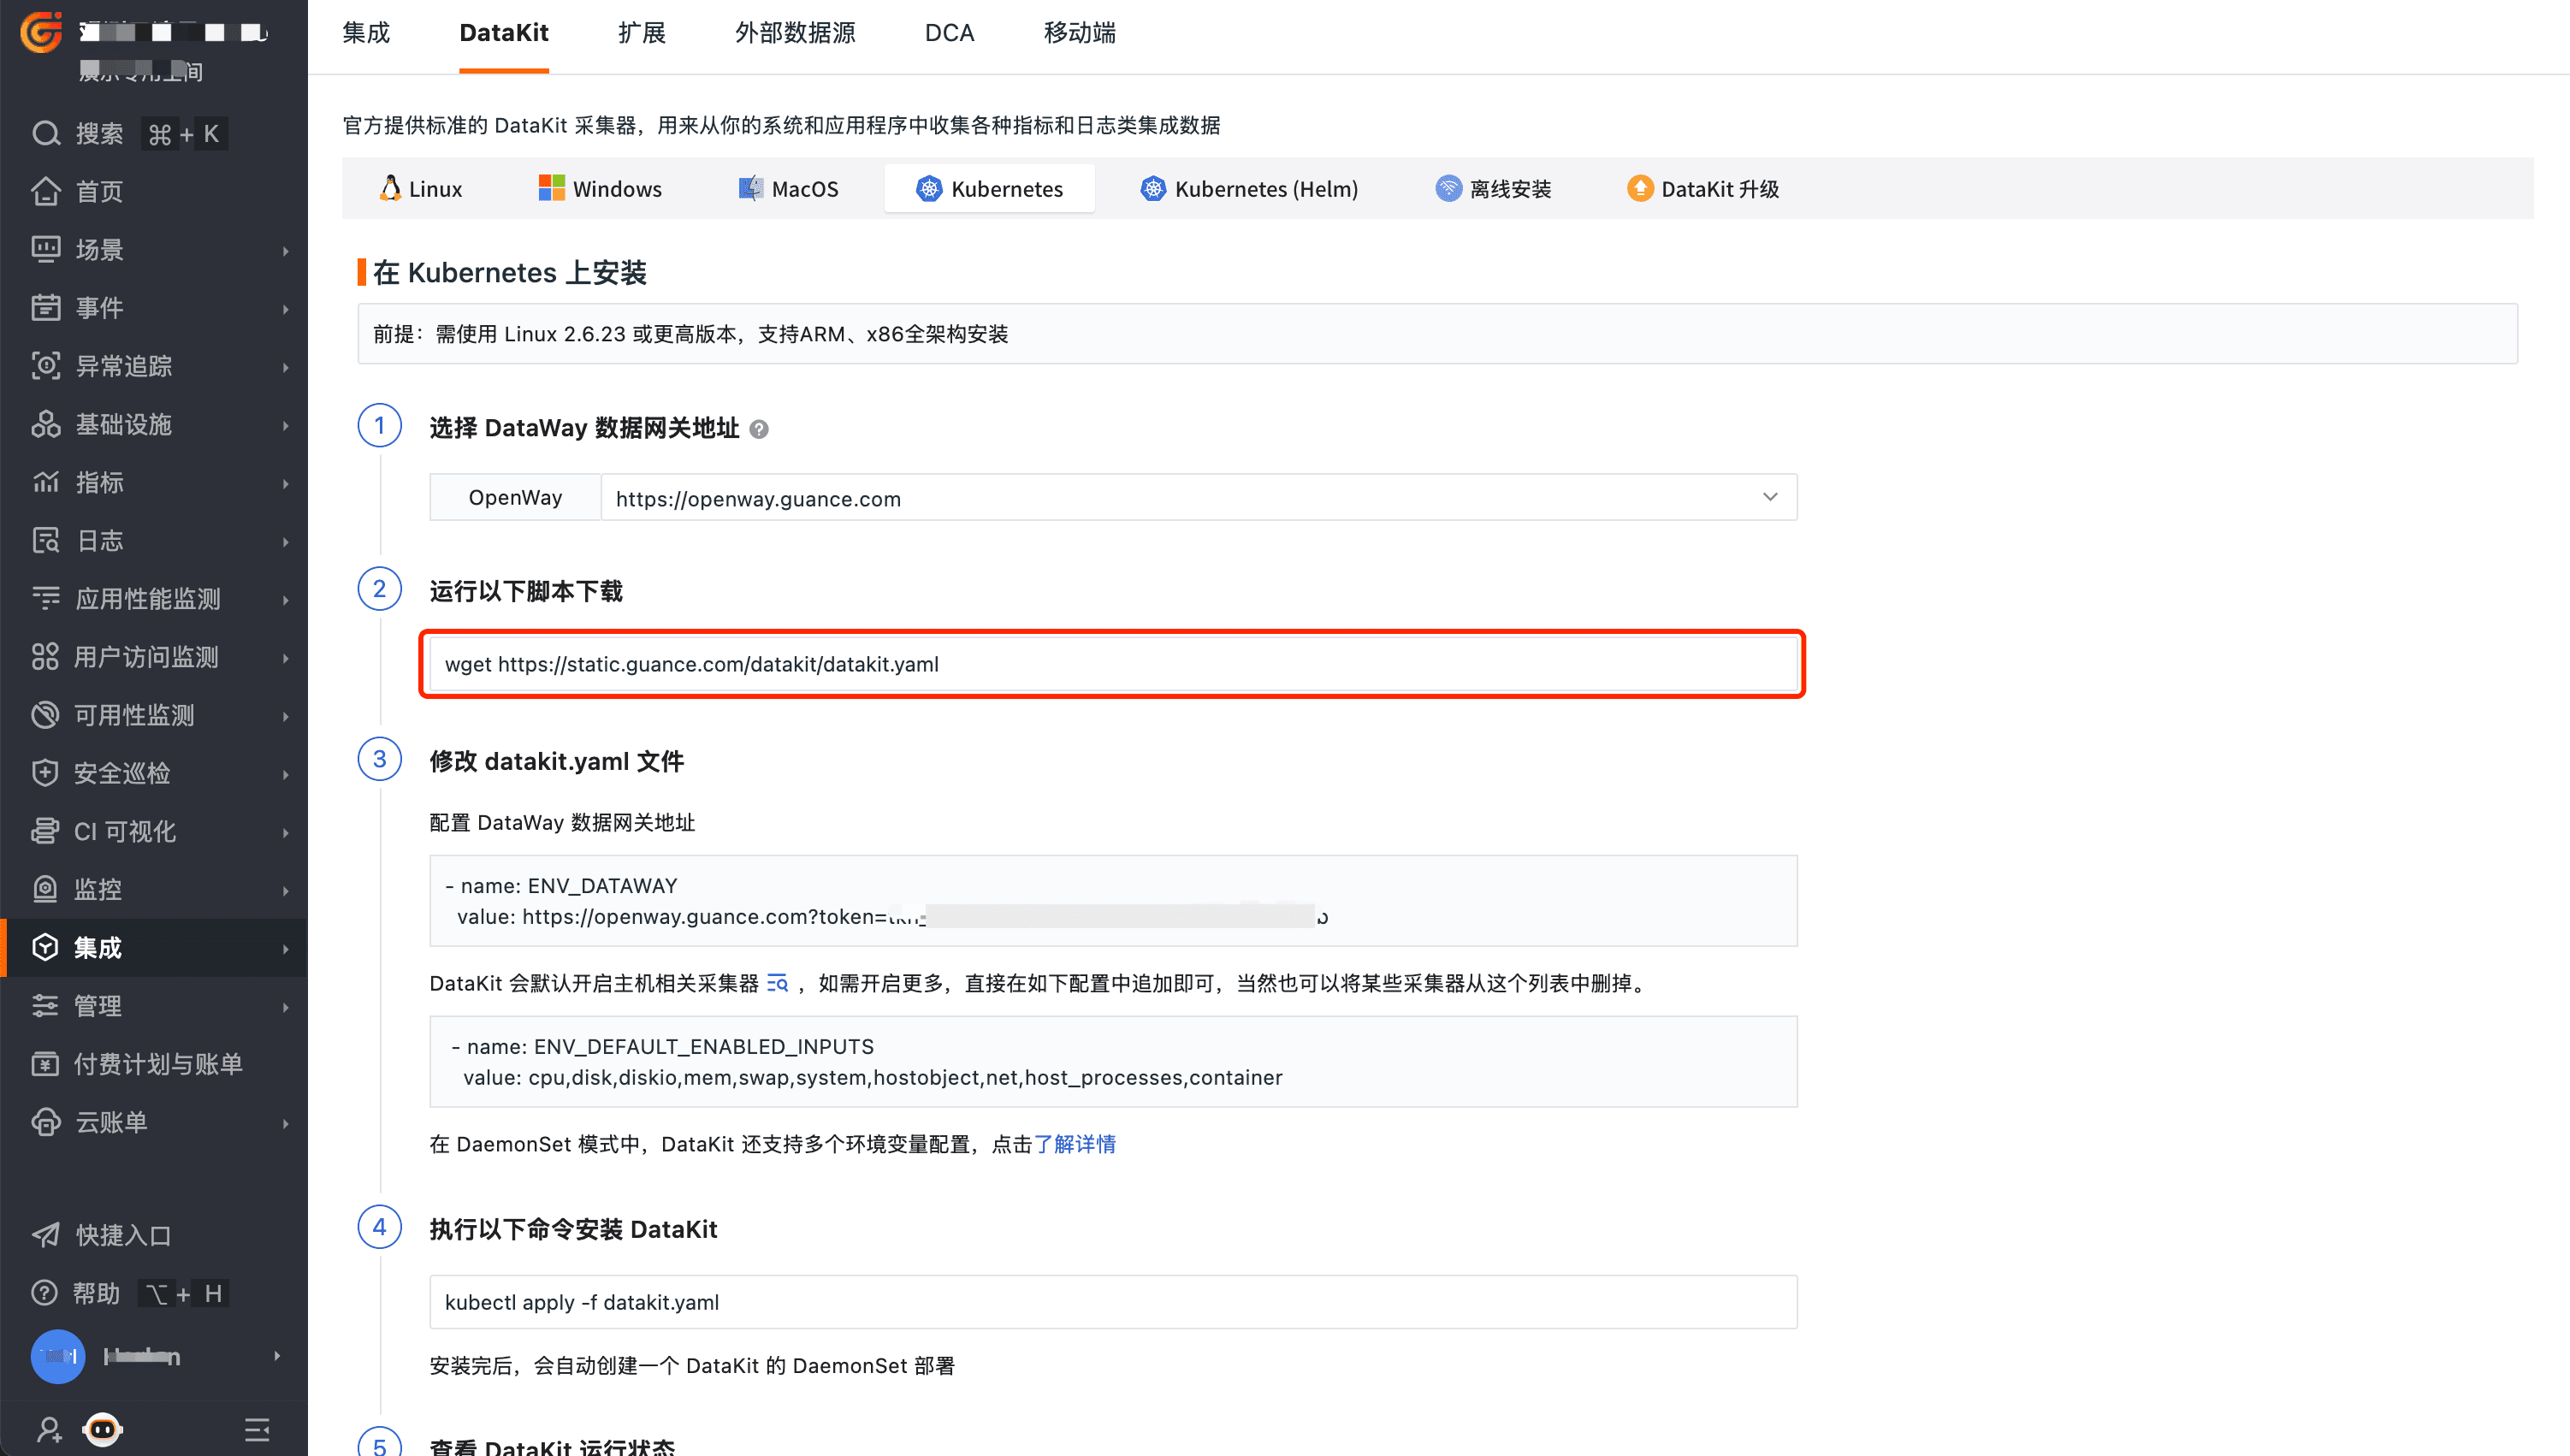
编辑 datakit.yaml ,把 token 粘贴到 ENV_DATAWAY 环境变量值中“token=”后面。
kubectl apply -f datakit.yaml
kubectl get pod -n datakit
采集器配置
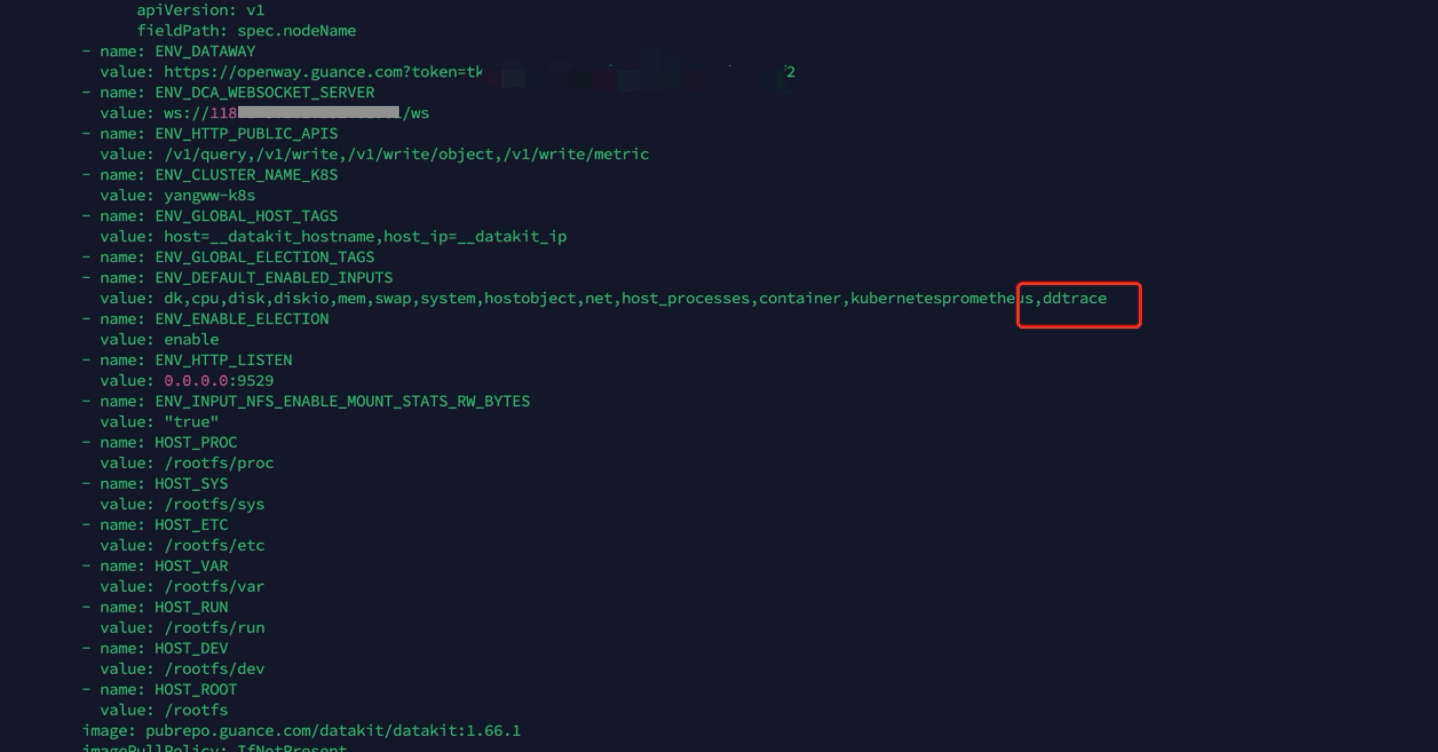
ArgoCD 指标采集
datakit.yaml 修改 KubernetesPrometheus 采集配置。
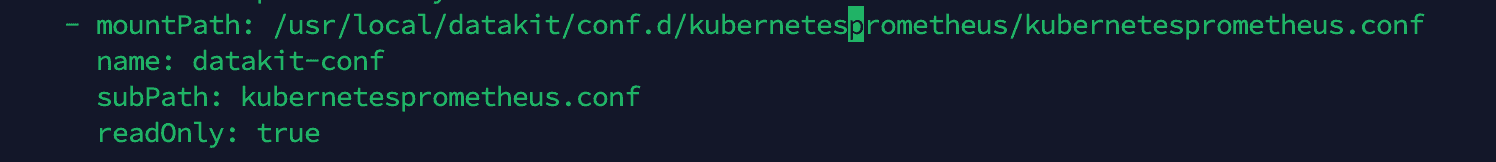
mountPath 挂载把 KubernetesPrometheus 的配置文件挂载到容器内。
          - mountPath: /usr/local/datakit/conf.d/kubernetesprometheus/kubernetesprometheus.conf
            name: datakit-conf
            subPath: kubernetesprometheus.conf
            readOnly: true
添加 datakit.yaml 的 configmap 文件下添加 kubernetesprometheus.conf。
    kubernetesprometheus.conf: |-
      [inputs.kubernetesprometheus]
        [[inputs.kubernetesprometheus.instances]]
          role       = "service"
          namespaces = ["argocd"]
          selector   = "app.kubernetes.io/name=argocd-server-metrics"

          scrape     = "true"
          scheme     = "http"
          port       = "__kubernetes_service_port_metrics_targetport"
          path       = "/metrics"
          params     = ""

          [inputs.kubernetesprometheus.instances.custom]
            measurement        = "argocd-server"
            job_as_measurement = false
            [inputs.kubernetesprometheus.instances.custom.tags]
              svc_name      = "__kubernetes_service_name"
              pod_name      = "__kubernetes_service_target_name"
              pod_namespace = "__kubernetes_service_target_namespace"
        [[inputs.kubernetesprometheus.instances]]
          role       = "service"
          namespaces = ["argocd"]
          selector   = "aapp.kubernetes.io/name=argocd-metrics"

          scrape     = "true"
          scheme     = "http"
          port       = "__kubernetes_service_port_metrics_targetport"
          path       = "/metrics"
          params     = ""

          [inputs.kubernetesprometheus.instances.custom]
            measurement        = "argocd"
            job_as_measurement = false
            [inputs.kubernetesprometheus.instances.custom.tags]
              svc_name      = "__kubernetes_service_name"
              pod_name      = "__kubernetes_service_target_name"
              pod_namespace = "__kubernetes_service_target_namespace"

        [[inputs.kubernetesprometheus.instances]]
          role       = "service"
          namespaces = ["argocd"]
          selector   = "app.kubernetes.io/name=argocd-notifications-controller-metrics"

          scrape     = "true"
          scheme     = "http"
          port       = "__kubernetes_service_port_metrics_targetport"
          path       = "/metrics"
          params     = ""

          [inputs.kubernetesprometheus.instances.custom]
            measurement        = "argocd-application-controller"
            job_as_measurement = false
            [inputs.kubernetesprometheus.instances.custom.tags]
              svc_name      = "__kubernetes_service_name"
              pod_name      = "__kubernetes_service_target_name"
              pod_namespace = "__kubernetes_service_target_namespace"

      [inputs.kubernetesprometheus.global_tags]
        instance = "__kubernetes_mate_instance"
        host     = "__kubernetes_mate_host"
- role :填需要采集的负载的类型,比如 service,nodes,deployment,statefulset
- namespaces: 填对应的 ArgoCD 采集指标服务所在的空间
- selector: 填对应服务的label信息,或者 selector 信息
- port: ArgoCD 指标暴露的端口,这里默认不用改
- path:指标暴露的路径
- measurement: 自定义指标集名称
把 datakit.yaml 上传到可以连接到 Kubernetes 集群的主机上,执行如下命令。
kubectl apply -f datakit.yaml
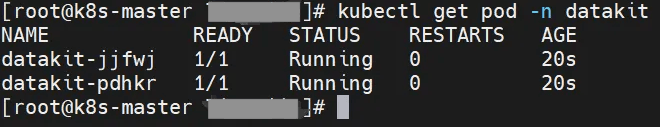
kubectl get pod -n datakit
当看到状态是“Running”后表示安装 DataKit 成功。
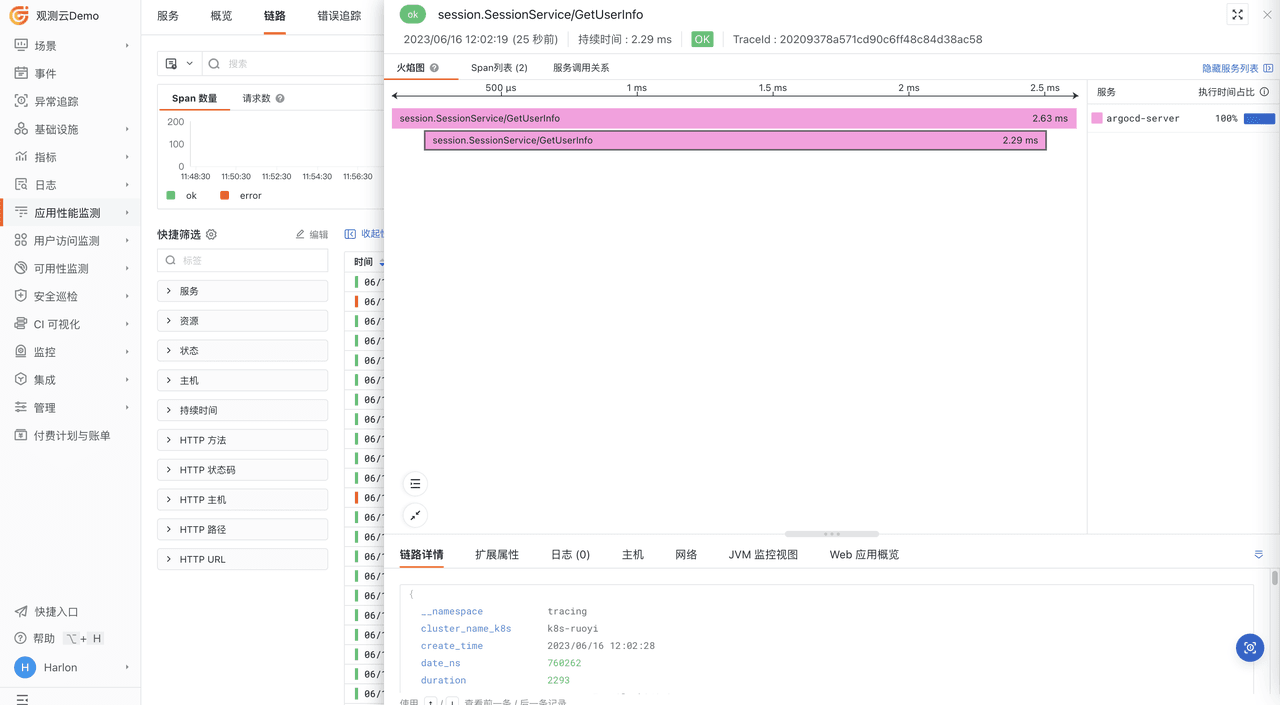
ArgoCD 链路采集
修改 datakit.yaml 打开 opentelemetry 链路采集器。
apiVersion: v1
kind: ConfigMap
metadata:
  name: datakit-conf
  namespace: datakit
data:
  #### opentelemetry
  opentelemetry.conf: |-
    [[inputs.opentelemetry]]
      [inputs.opentelemetry.http]
       enable = true
       http_status_ok = 200

      [inputs.opentelemetry.grpc]
       trace_enable = true
       metric_enable = true
       addr = "0.0.0.0:4317"
apiVersion: apps/v1
kind: DaemonSet
metadata:
  labels:
    app: daemonset-datakit
  name: datakit
  namespace: datakit
spec:
  ...
  template:
    ...
    spec:
      ...
      containers:
        ...
        volumeMounts:
        ...
        - mountPath: /usr/local/datakit/conf.d/opentelemetry/opentelemetry.conf
          name: datakit-conf
          subPath: opentelemetry.conf
        ...
开启 datakit 服务 opentelemetry svc 的端口。
apiVersion: v1
kind: Service
metadata:
  name: datakit-service
  namespace: datakit
spec:
  selector:
    app: daemonset-datakit
  ports:
    - name: datakit
      protocol: TCP
      port: 9529
      targetPort: 9529
    - name: opentelemetry
      protocol: TCP
      port: 4317
      targetPort: 4317
修改 Argo CD 的 ConfigMap argocd-cmd-params-cm,加入 otlp.address 地址,即可获取 Argo CD 的链路。
argocd-cmd-params-cm.yaml
apiVersion: v1
kind: ConfigMap
metadata:
  labels:
    app.kubernetes.io/name: argocd-cmd-params-cm
    app.kubernetes.io/part-of: argocd
  name: argocd-cmd-params-cm
  namespace: argocd
data:
  otlp.address: datakit-service.datakit:4317
执行命令:kubectl apply -f argocd-cmd-params-cm.yaml 然后重启 ArgoCD 服务即可。
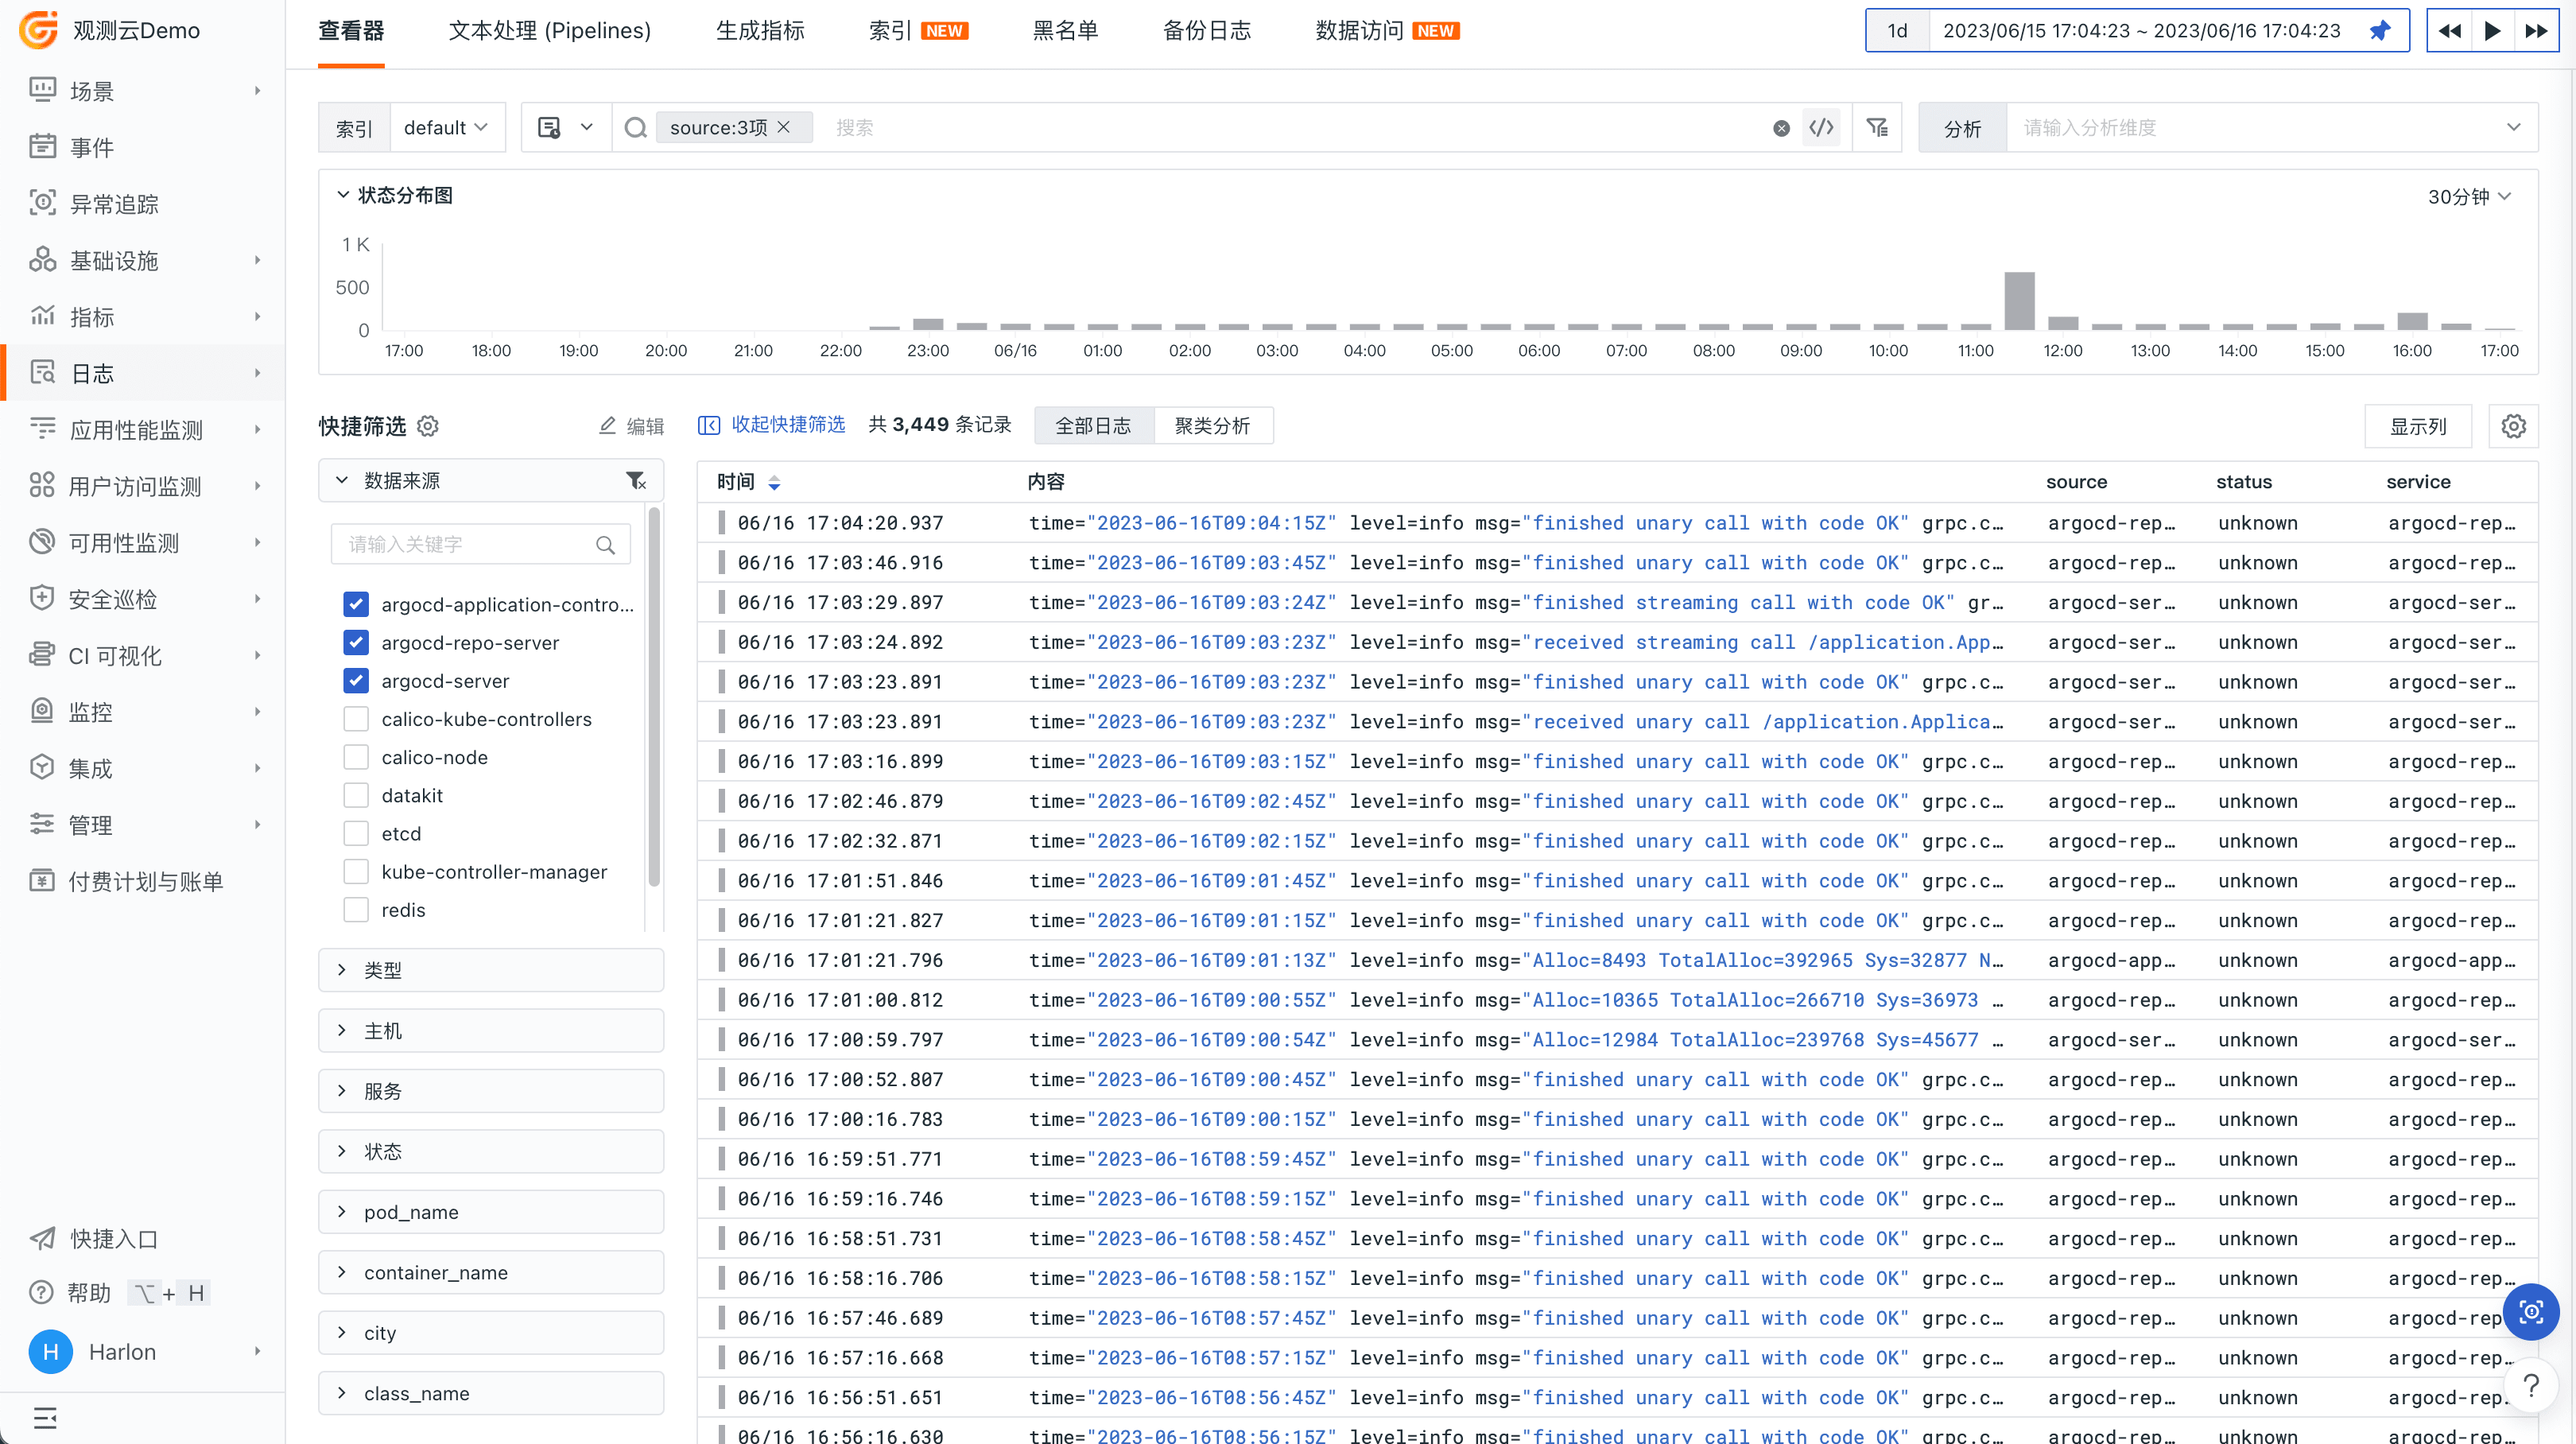
ArgoCD 日志采集
DataKit 默认会采集容器的标准输出日志,无需额外配置采集。
关键指标
argocd-server
| Metric | Description |
|---|---|
| process_start_time_seconds | The start time of the process since unix epoch in seconds in the API Server |
| go_goroutines | The number of goroutines that currently exist in the API Server |
| grpc_server_handled_total | The total number of RPCs completed on the server regardless of success or failure |
| grpc_server_started_total | The total number of RPCs started on the server |
| go_memstats_alloc_bytes | The number of heap bytes allocated and still in use in the API Server |
argocd-application-controller
| Metric | Description |
|---|---|
| argocd_app_info | Information about Applications. It contains tags such as syncstatus and healthstatus that reflect the application state in Argo CD. The metric value is constant |
| go_memstats_heap_alloc_bytes | The number of heap bytes allocated and still in use in the Application Controller |
| process_cpu_seconds_total | The total user and system CPU time spent in seconds in the Application Controller |
| argocd_app_reconcile_count | Reconcile count |
| argocd_app_reconcile_bucket | Count of Application Reconciliation by Duration Bounds |
| workqueue_depth | Depth of the Workqueue |
| argocd_kubectl_exec_total | Count of Kubectl Executions |
| argocd_app_k8s_request_total | Count of Kubernetes Requests Executed |
| argocd_kubectl_exec_pending | Count of Pending Kubectl Executions |
argocd-repo-server
| Metric | Description |
|---|---|
| argocd_git_request_total | Count of Git Ls-Remote Requests |
| argocd_git_request_duration_seconds_bucket | Git Ls-Remote Requests Performance |
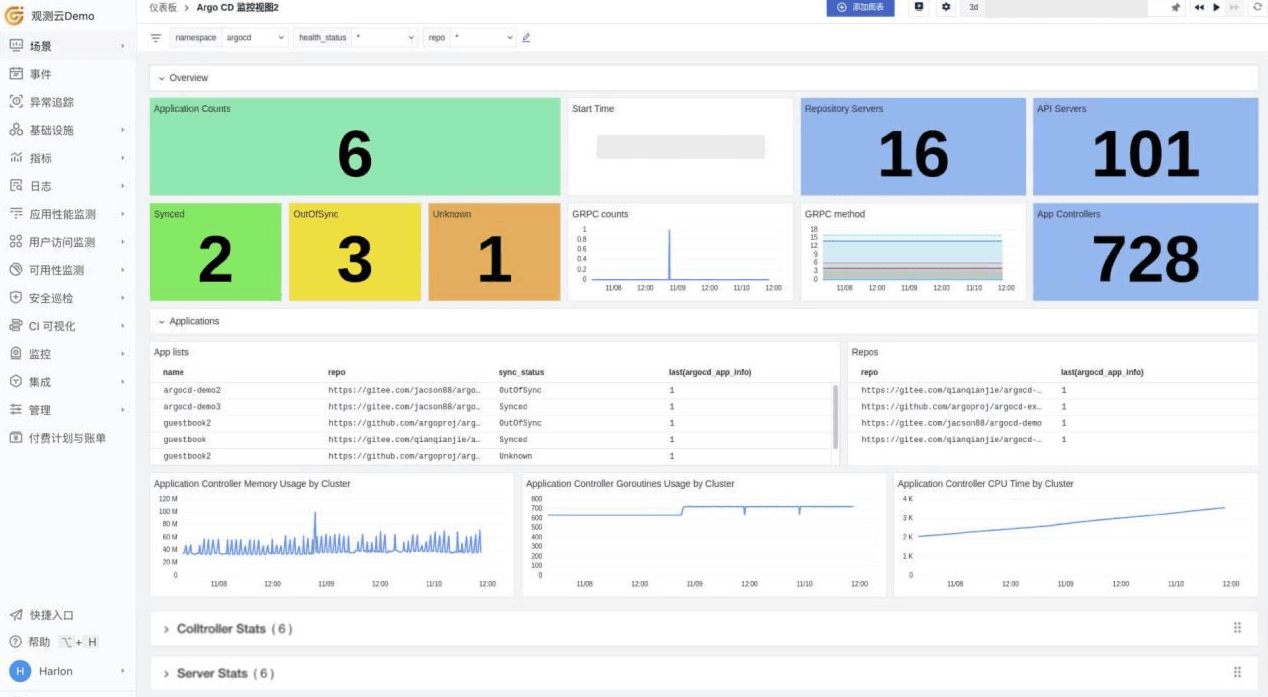
场景视图
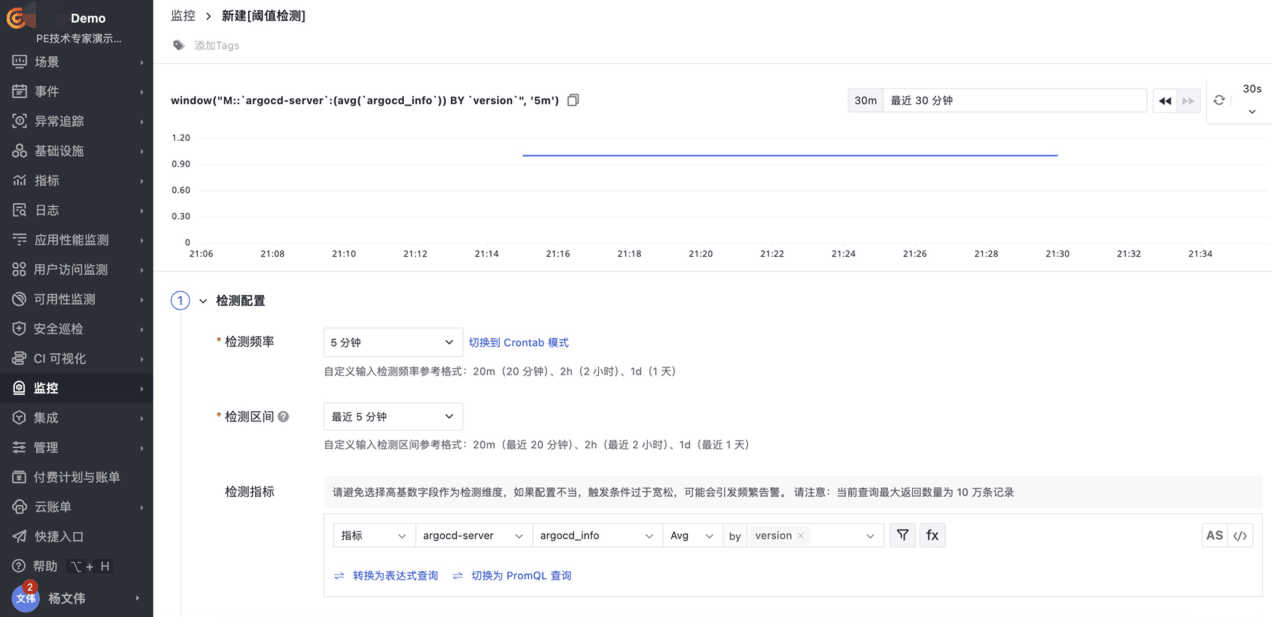
监控器配置
ArgoCD 异常检测
window("M::argocd-server:(avg(argocd_info)) BY version", '5m')