自交互学习:计算病理学中用于分子特征预测的多尺度组织形态学特征的融合与演化|文献速递-医学影像人工智能进展
Title
题目
Self-interactive learning: Fusion and evolution of multi-scalehistomorphology features for molecular traits prediction in computationalpathology
自交互学习:计算病理学中用于分子特征预测的多尺度组织形态学特征的融合与演化
01
文献速递介绍
在计算病理学的最新发展中,借助强大的深度神经网络(DNN),基于全切片图像(WSI)的形态学分型已成为一种新兴工具,在未来临床应用和药物研发方面具有巨大潜力。形态 - 分子分型的核心概念是直接从苏木精 - 伊红(H&E)组织病理学样本中呈现的形态学特征推断出与生物学相关的分子特征,从而避免了对昂贵且耗时的分子检测的需求(西里努昆瓦塔纳(Sirinukunwattana)等人,2021年)。这种方法的成功应用可以对癌症治疗产生深远影响,为个性化医疗提供一种经济高效的解决方案,充分利用全切片图像中包含的丰富信息。这些技术有望减轻对耗时且可能成本高昂的基因测序的依赖(申杜尔(Shendure)等人,2017年;高(Gao)等人,2019年),使具有不同癌症生物标志物的患者能够更快地开始治疗。 在对全切片图像进行建模时,采用卷积神经网络(CNN)等深度神经网络是一种标准策略。然而,直接将它们应用于全分辨率的全切片图像充满挑战,因为全切片图像通常包含数百万像素,超出了当前标准图形处理单元(GPU)的处理能力限制。因此,全切片图像处理的常用策略通常包括将图像分割成小图块,和/或将图像图块预压缩为特征向量以减小输入的大小(坎帕内拉(Campanella)等人,2019年;李(Li)等人,2021c;桥本(Hashimoto)等人,2020年;李(Li)等人,2021a;陆(Lu)等人,2021b;卡拉(Kalra)等人,2021年;利普科娃(Lipkova)等人,2022b)。 在全切片图像上应用深度学习的另一个障碍是难以获得可靠的注释。与疾病相关的信息丰富的组织形态学特征可能很少出现且很微妙。广泛的图块级注释可能会产生极高的人工成本,并且通常很难获取(布伦特(Brunt),2010年;赫克塞尔曼(Hekselman)和耶格尔 - 洛特姆(Yeger-Lotem),2020年)。另一方面,基于弱监督学习的方法通过对图块与切片之间的相关性进行建模,以实现切片级别的预测,而无需在训练时提供图块级别的注释。特别是,多实例学习(MIL)因其在处理全切片图像分析的复杂性方面的有效性而受到了广泛关注。由于对于全切片图像(WSI)中相当数量的背景图块来说,弱监督标签是没有意义的,因此多实例学习(MIL)的优势,如对整体形态的任务驱动感知和对有信息图块的动态选择,是基于子集的方法(如预先选择关键区域或代表性图块集)所无法实现的(巴克(Barker)等人,2016年;卡拉(Kalra)等人,2020年)。多实例学习主要涉及用于对图块进行特征压缩的图块级编码器,以及用于在单个全切片图像中整合所有图块级特征的切片级聚合器。 此外,从组织形态学预测分子特征带来了一些特定的挑战,这些挑战在其他计算病理学任务(如肿瘤检测)中不太相关。首先,收集有基因测序支持的亚型注释需要严格的质量控制,成本高昂,而且通常不同的分子亚型在H&E切片上可能表现出视觉上相似的表型,使得分子亚型不像其他组织病理学分类任务那样易于区分(比拉尔(Bilal)等人,2021年;杨(Yang)等人,2022年;富田(Tomita)等人,2022年)。因此,最近成功的分子分型研究通常需要大量的训练样本(西里努昆瓦塔纳(Sirinukunwattana)等人,2021年;洪(Hong)等人,2021年;尼休斯(Niehues)等人,2023年)。一些方法利用多组学数据(库图尔(Couture)等人,2018年;蔡(Tsai)等人,2023年)、针对与特定表型相关蛋白质的免疫组织化学(IHC)染色图像(陆(Lu)等人,2022年;尼亚斯(Niyas)等人,2023年;黄(Huang)等人,2023年),或手动的像素级感兴趣区域(ROI)注释(黄(Huang)等人,2023年)进行训练。鉴于提供此类额外信息所需的成本和精力,适合开发分子分型模型的注释良好的患者队列通常规模较小。这通常要求模型从细胞水平到切片水平在多个尺度上搜索高度异质的、对分子分型有帮助的判别特征(高(Gao)等人,2022年)。 在本文中,我们提出了一种基于多实例学习(MIL)的新颖方法,用于基于全切片图像的形态 - 分子分型。与大多数现有框架使用预训练的图块级编码器不同,我们的工作(名为Inter-MIL)能够将图块级编码器与切片级特征聚合器一起进行端到端的训练,从而能够在图块级别学习到更多特定于任务的判别特征。为了优化图块级编码器,我们采用了一种伪标签传播策略,该策略捕获了图块与切片级标签之间的相互作用。值得注意的是,这种策略还改进了负责汇总图块级特征的聚合器,从而得到更好的全局组织特征。可视化结果表明,在迭代优化过程中,聚合器的注意力通常会更倾向于与专家认为重要的区域对齐。同时,图块级图像特征变得更具判别性。此外,使用基于梯度的方法检查编码器激活情况,我们提取了更细粒度的注意力,这些注意力能够捕捉单个图块内的细胞特征,超越了与任务无关的预训练编码器的能力。借助所提出的Inter-MIL,图块级特征是以与任务相关的方式提取的。 本研究的主要贡献借助图1总结如下: (1)新颖的Inter-MIL框架 - 我们通过局部和大规模粒度特征之间的交互设计了一种迭代优化策略。我们提出的方法——Inter-MIL提高了在小组织病理学数据集上多实例学习的学习效率。Inter-MIL还为图块级编码器和切片级聚合器在不同特征尺度上引入了优化步骤。 (2)更具代表性的特征 - Inter-MIL从多个尺度搜索分子亚型的代表性特征,既能够识别细胞病理学特征,又能改进对粗粒度特征的搜索。 (3)Inter-MIL特征增强了判别能力 - Inter-MIL重塑了图块级特征空间,使不同分子亚型的视觉特征更易于区分,从而降低了对新样本进行分型的难度。 (4)对多种分子分型任务的验证 - 我们考虑了四项非常不同的分子分型任务,包括预测浆液性上皮性卵巢癌(SOC)中的高上皮 - 间质转化(EMT)(胡(Hu)等人,2020年、2021年),预测结肠癌(亚伯拉罕(Abraham)等人,2021年)和肺癌(库德雷(Coudray)等人,2018年;贾因(Jain)和马苏德(Massoud),2020年)中的 Kirsten 大鼠肉瘤病毒癌基因(KRAS)突变状态,肺癌中的表皮生长因子受体(EGFR)突变状态(库德雷(Coudray)等人,2018年;荣格(Jung)等人,2022年),以及乳腺浸润性癌中的人表皮生长因子受体2(HER2)扩增(宾德(Binder)等人,2021年)。
Aastract
摘要
Predicting disease-related molecular traits from histomorphology brings great opportunities for precisionmedicine. Despite the rich information present in histopathological images, extracting fine-grained molecularfeatures from standard whole slide images (WSI) is non-trivial. The task is further complicated by thelack of annotations for subtyping and contextual histomorphological features that might span multiplescales. This work proposes a novel multiple-instance learning (MIL) framework capable of WSI-based cancermorpho-molecular subtyping by fusion of different-scale features. Our method, debuting as Inter-MIL, followsa weakly-supervised scheme. It enables the training of the patch-level encoder for WSI in a task-awareoptimisation procedure, a step normally not modelled in most existing MIL-based WSI analysis frameworks. Wedemonstrate that optimising the patch-level encoder is crucial to achieving high-quality fine-grained and tissuelevel subtyping results and offers a significant improvement over task-agnostic encoders. Our approach deploysa pseudo-label propagation strategy to update the patch encoder iteratively, allowing discriminative subtypefeatures to be learned. This mechanism also empowers extracting fine-grained attention within image tiles(the small patches), a task largely ignored in most existing weakly supervised-based frameworks. With InterMIL, we carried out four challenging cancer molecular subtyping tasks in the context of ovarian, colorectal,lung, and breast cancer. Extensive evaluation results show that Inter-MIL is a robust framework for cancermorpho-molecular subtyping with superior performance compared to several recently proposed methods, insmall dataset scenarios where the number of available training slides is less than 100. The iterative optimisationmechanism of Inter-MIL significantly improves the quality of the image features learned by the patch embeddedand generally directs the attention map to areas that better align with experts’ interpretation, leading to theidentification of more reliable histopathology biomarkers. Moreover, an external validation cohort is used toverify the robustness of Inter-MIL on molecular trait prediction.
从组织形态学来预测与疾病相关的分子特征为精准医学带来了巨大的机遇。尽管组织病理学图像中蕴含着丰富的信息,但从标准的全切片图像(WSI)中提取细粒度的分子特征并非易事。由于缺乏对可能跨越多个尺度的亚型和上下文组织形态学特征的注释,这项任务变得更加复杂。 这项工作提出了一种新颖的多实例学习(MIL)框架,该框架能够通过融合不同尺度的特征,基于全切片图像对癌症进行形态 - 分子亚型分类。我们的方法,即Inter-MIL首次亮相,它遵循一种弱监督方案。它能够在任务感知的优化过程中对全切片图像的切片级编码器进行训练,而这一步骤在大多数现有的基于多实例学习的全切片图像分析框架中通常未被建模。 我们证明了对切片级编码器进行优化对于实现高质量的细粒度和组织水平的亚型分类结果至关重要,并且与不考虑任务的编码器相比有显著的改进。我们的方法采用了一种伪标签传播策略来迭代更新切片编码器,从而能够学习到具有判别性的亚型特征。这种机制还能够在图像小块(小切片)中提取细粒度的注意力,而这一任务在大多数现有的基于弱监督的框架中大多被忽略。 借助Inter-MIL,我们在卵巢癌、结直肠癌、肺癌和乳腺癌的背景下开展了四项具有挑战性的癌症分子亚型分类任务。大量的评估结果表明,在可用训练切片数量少于100的小数据集场景中,Inter-MIL是一个用于癌症形态 - 分子亚型分类的强大框架,与最近提出的几种方法相比具有更优越的性能。Inter-MIL的迭代优化机制显著提高了由切片嵌入所学习到的图像特征的质量,并且通常会将注意力图引导到与专家解释更相符的区域,从而能够识别出更可靠的组织病理学生物标志物。此外,我们使用了一个外部验证队列来验证Inter-MIL在分子特征预测方面的稳健性。
Method
方法
3.1. Datasets and processing
Experimental datasets. In this section, we describe the datasetsused to validate the proposed approach. We conducted four subtypingtasks: (1) OV-EMT: Approximately 20% of serous ovarian cancers(SOCs) are classified as EMT-high tumours, which are associated withpoor survival (Hu et al., 2021). Here, we analysed 70 WSIs fromTCGA-OV dataset with a binary EMT status (38 EMT-high vs. 32EMT-low); (2) COLU-KRAS: Mutations in the KRAS gene are oftenassociated with different cancer types, including lung and colorectalcancer (Abraham et al., 2021; Jain and Massoud, 2020). The presenceof KRAS mutations in colorectal cancer can have implications fortreatment decisions (Lievre et al., 2006). Here we present a combinedcohort of 112 WSIs with KRAS mutation status (44 mutated vs. 68wild-type) from TCGA-COAD and TCGA-LUAD datasets; (3) LU-EGFR:Detection of EGFR mutations is now a standard part of the diagnosticworkup for patients with non-small cell lung cancer (NSCLC), as ithelps guide treatment decisions (Li et al., 2013). Here we utilised 261WSIs from TCGA-LUAD dataset for subtyping EGFR mutation status(75 mutated vs. 186 wild-type); (4) BR-HER2: HER2 is a protein thatis overexpressed in approximately 15%–20% of breast cancers. HER2-positive breast cancers tend to be more aggressive and less responsive tohormone treatments compared to HER2-negative cancers (Gianni et al.,2010). 415 WSIs from the TCGA-BRCA dataset where HER2 status wasdetermined based on fluorescence amplification in situ hybridisation(FISH) expression (77 positives vs. 338 negatives) were used. Forannotations, EMT status used in OV-EMT is available in Hu et al. (2020)and Hu et al. (2021) while the subtype labels for the other tasks areavailable in the TCGA repository (Tomczak et al., 2015).In addition to the TCGA cohorts, samples of patients with newly diagnosed advanced colorectal cancer taken FOCUS clinical trial (part ofS:CORT project) (Seymour et al., 2007; Malla et al., 2021; Sirinukunwattanaet al., 2021) were used, which contains 666 slides of resection specimens from 362 patients. For all samples, histology slides matched RNAsequencing results are available. In our study, a subset of FOCUS wasused for external validation. In which, we selected 200 WSIs fromthe first 100 patients, with KRAS mutation status as the label. Forthe patients, the distribution of the KRAS status is 56 mutated vs. 44wild-type. Additional information on the external validation datasetand preprocessing details, including the data acquisition protocol andpopulation characteristics of the FOCUS cohort, is in the supplementarymaterial.The proximity the tissue used for generating H&E slides and RNAsequencing is one critical quality metric that needs to be taken intoconsideration. The FOCUS cohort has been generated under a very strictquality assurance protocol. However, it is known that the correlationbetween H&E slides and RNA sequencing in the TCGA cohort is morevariable.
3.1 数据集与处理 实验数据集:在本节中,我们将描述用于验证所提出方法的数据集。我们进行了四项亚型分类任务: (1)OV-EMT(卵巢癌上皮 - 间质转化):大约20%的浆液性卵巢癌(SOCs)被归类为上皮 - 间质转化(EMT)高的肿瘤,这类肿瘤与较差的生存率相关(胡(Hu)等人,2021年)。在此,我们分析了来自癌症基因组图谱(TCGA)卵巢癌(OV)数据集的70张全切片图像(WSI),这些图像具有二元的EMT状态(38例EMT高 vs. 32例EMT低); (2)COLU-KRAS(结肠癌KRAS基因):KRAS基因的突变通常与不同的癌症类型相关,包括肺癌和结直肠癌(亚伯拉罕(Abraham)等人,2021年;贾因(Jain)和马苏德(Massoud),2020年)。结直肠癌中KRAS突变的存在可能会对治疗决策产生影响(利夫雷(Lievre)等人,2006年)。在这里,我们展示了一个由112张全切片图像组成的联合队列,这些图像来自TCGA结肠癌(COAD)和TCGA肺腺癌(LUAD)数据集,具有KRAS突变状态(44例突变 vs. 68例野生型); (3)LU-EGFR(肺癌表皮生长因子受体):检测表皮生长因子受体(EGFR)突变现在是非小细胞肺癌(NSCLC)患者诊断检查的标准部分,因为它有助于指导治疗决策(李(Li)等人,2013年)。在此,我们利用来自TCGA肺腺癌(LUAD)数据集的261张全切片图像来对EGFR突变状态进行亚型分类(75例突变 vs. 186例野生型); (4)BR-HER2(乳腺癌人表皮生长因子受体2):人表皮生长因子受体2(HER2)是一种在大约15% - 20%的乳腺癌中过度表达的蛋白质。与HER2阴性乳腺癌相比,HER2阳性乳腺癌往往更具侵袭性,对激素治疗的反应也更差(贾尼(Gianni)等人,2010年)。我们使用了来自TCGA乳腺癌(BRCA)数据集的415张全切片图像,其中HER2状态是根据荧光原位杂交(FISH)表达来确定的(77例阳性 vs. 338例阴性)。 关于注释,“OV-EMT”中使用的EMT状态可在胡(Hu)等人(2020年)和胡(Hu)等人(2021年)的研究中获取,而其他任务的亚型标签可在TCGA数据库中找到(托姆恰克(Tomczak)等人,2015年)。 除了TCGA队列外,还使用了来自FOCUS临床试验(S:CORT项目的一部分)(西摩(Seymour)等人,2007年;马拉(Malla)等人,2021年;西里努昆瓦塔纳(Sirinukunwattana)等人,2021年)中,新诊断的晚期结直肠癌患者的样本,该样本包含来自362名患者的666张切除标本切片。对于所有样本,都有与组织学切片匹配的RNA测序结果。在我们的研究中,FOCUS的一个子集被用于外部验证。其中,我们从最初的100名患者中选择了200张全切片图像,以KRAS突变状态作为标签。对于这些患者,KRAS状态的分布是56例突变 vs. 44例野生型。关于外部验证数据集的更多信息以及预处理细节,包括数据采集协议和FOCUS队列的人群特征,可在补充材料中找到。 用于生成苏木精 - 伊红(H&E)切片的组织与RNA测序所用组织的接近程度是一个需要考虑的关键质量指标。FOCUS队列是在非常严格的质量保证协议下生成的。然而,众所周知,TCGA队列中H&E切片与RNA测序之间的相关性更具可变性。
Conclusion
结论
In summary, we introduce a novel weakly supervised MIL approachfor predicting molecular subtypes from histological WSIs, utilising aself-interactive algorithm to bridge multi-scale histopathological features. This method facilitates the learning of highly discriminativefeatures in latent space and enhances interpretability through improvedvisualisation outcomes.Notably, Inter-MIL introduces a simple and efficient communicationmechanism for features across different scales in scenarios with a smallamount of data, an achievement not accomplished in other studies.Thus, Inter-MIL presents a viable solution to practical challenges suchas datasets with a scant amount of cases and indeterminate biomarkerlocations. Moreover, Inter-MIL’s design allows seamless integrationwith other models, enabling users to adopt any advanced deep learning architecture for encoders and aggregators or to leverage otherpre-trained fundamental models.Future efforts will aim to tackle existing technical hurdles, performmore robust uncertainty estimation, broaden Inter-MIL’s applicabilityacross varied tasks, and assess the tile-level feature pool’s utility in diverse applications. Moreover, we intend to investigate Inter-MIL’s integration with more DNN architectures like Graph Neural Networks (Leeet al., 2022) and Vision Transformers (Chen et al., 2022b; Azad et al.,2024b) to adeptly capture contextually rich spatial information onWSIs.
总之,我们引入了一种新颖的弱监督多实例学习(MIL)方法,用于从组织学全切片图像(WSI)中预测分子亚型,该方法利用一种自交互算法来衔接多尺度的组织病理学特征。这种方法有助于在潜在空间中学习具有高度判别性的特征,并通过改进的可视化结果增强了解释性。 值得注意的是,在数据量较少的情况下,Inter-MIL为不同尺度的特征引入了一种简单而高效的交互机制,这是其他研究中未能实现的成果。因此,Inter-MIL为诸如病例数量稀少的数据集以及生物标志物位置不确定等实际挑战提供了可行的解决方案。此外,Inter-MIL的设计允许与其他模型无缝集成,使用户能够采用任何先进的深度学习架构作为编码器和聚合器,或者利用其他预训练的基础模型。 未来的工作将致力于解决现有的技术难题,进行更可靠的不确定性估计,拓宽Inter-MIL在各种任务中的适用性,并评估图块级特征池在不同应用中的效用。此外,我们打算研究Inter-MIL与更多深度神经网络架构的集成,如图神经网络(李(Lee)等人,2022年)和视觉Transformer(陈(Chen)等人,2022b;阿扎德(Azad)等人,2024b),以便熟练地捕捉全切片图像上具有丰富上下文的空间信息。
Figure
图
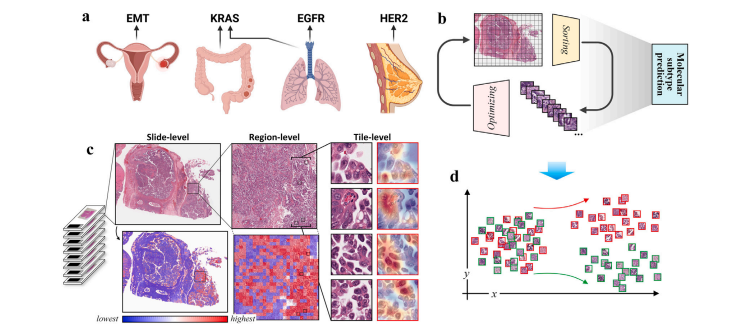
Fig. 1. Molecular trait prediction and feature investigation: task, method, and vision. a, Task: Prediction of 4 molecular traits on datasets of 4 cancer types. b, Method: Ournovel Inter-MIL approach to drive self-interaction between global biopsy WSI features and fine-grained tile-level features. c, Vision: From left to right, presented at slide-level,region-level, and fine-grained tile-level attention interpretation of models, where the Grad-CAM tool (Selvaraju et al., 2017) provides an attention interpretation that highlightsindividual nuclei. d, Vision: The proposed Inter-MIL approach is expected to provide a more discriminative feature space for informative tiles from all slides.
图1:分子特征预测与特征研究:任务、方法与展望。a,任务:在四种癌症类型的数据集上预测4种分子特征。b,方法:我们新颖的Inter-MIL方法可促使全局活检全切片图像(WSI)特征与细粒度的图块级特征之间进行自交互。c,展望:从左至右,展示了模型在切片级别、区域级别以及细粒度图块级别的注意力解读,其中梯度加权类激活映射(Grad-CAM)工具(塞尔瓦拉朱(Selvaraju)等人,2017年)提供了一种突出单个细胞核的注意力解读。d,展望:所提出的Inter-MIL方法有望为来自所有切片的有信息图块提供一个更具判别性的特征空间。
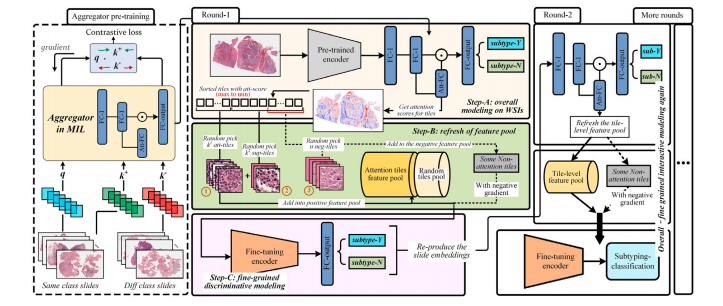
Fig. 2. Overview of the Inter-MIL framework. The framework is divided into three parts, from left to right, highlighting its various components and functions. Left, The aggregatoris pretrained using contrastive learning, where embeddings of slides of the same and different subtypes are fed into the aggregator in pairs. The training objective is to minimisethe distance between embeddings from the same subtype while maximising the distance between embeddings from different subtypes. Middle, The self-interaction MIL algorithmconsists of three steps within each round: (1) train AttPool network with pretrained tile embeddings to obtain the attention value for each tile, (2) constructing a tile-level featurepool with high-attention tiles and supplementary tiles (defined in Eq. (4)), optionally including low-attention tiles (defined in Eq. (5)), and (3) fine-tuning the CNN encoder (usingResNet) with the tile-level feature pool. Right, The tile embeddings are reproduced for the next round of AttPool training, and the subsequent rounds of self-interaction MILcontinue until convergence is achieved.
图2:Inter-MIL框架概述。该框架从左到右分为三个部分,突出展示了其各个组成部分和功能。左侧部分:聚合器使用对比学习进行预训练,将相同亚型和不同亚型切片的嵌入向量成对输入到聚合器中。训练目标是最小化相同亚型嵌入向量之间的距离,同时最大化不同亚型嵌入向量之间的距离。中间部分:自交互多实例学习(MIL)算法在每一轮中包含三个步骤:(1)使用预训练的图块嵌入来训练注意力池化(AttPool)网络,以获取每个图块的注意力值;(2)使用高注意力图块和补充图块(定义见公式(4))构建图块级特征池,可选择包含低注意力图块(定义见公式(5));(3)利用图块级特征池对卷积神经网络(CNN)编码器(使用残差网络ResNet)进行微调。右侧部分:重现图块嵌入向量,用于下一轮的AttPool训练,后续的自交互MIL轮次继续进行,直到达到收敛状态。
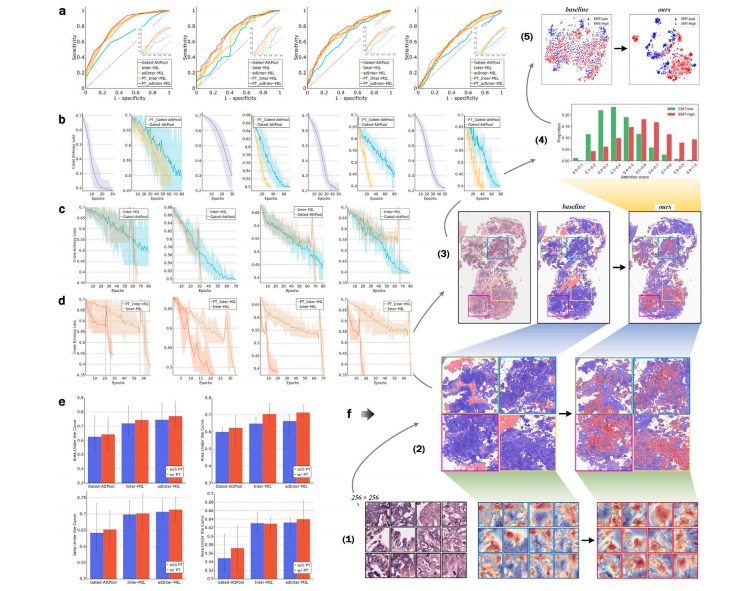
Fig. 3. Highlighted results and discussion. a, AUC-ROC curves of different models, for tasks: OV-EMT, COLU-KRAS, LU-EGFR, and BR-HER2, from left to right. Likewise below.b, log of loss for MIL aggregator pretraining and log of loss comparison for Gate-AttPool models with/without aggregator pretraining. c, log of loss comparison for Gate-AttPoolmodels and Inter-MIL models. d, log of loss comparison for Inter-MIL models with/without aggregator pretraining. e, AUC performance comparison for Gate-AttPool, Inter-MIL,and adInter-MIL models with/without aggregator pretraining. From left to right in a∼d and left-top to right-bottom in e, the charts illustrate the results on OV-EMT, COLU-KRAS,LU-EGFR*, and BR-HER2 tasks. f, Model interpretation comparison at various scales of the baseline model (on the left) and adInter-MIL model (ours, on the right), which uses thecase of OV-EMT task as an instance. From bottom to top, f-(1), Fine-grained scale. Gradient activation heatmaps of the instanced tile images. f-(2) and f-(3), Macroscopic scale.Attention heatmaps on representative regions, and their corresponding location on the slide. f-(4), Attention score statistics in the slide-level. Attention score distribution of tileswith different prediction results on EMT-low/high. f-(5), Feature space visualisation at the test cohort level. The feature space t-SNE (Van der Maaten and Hinton, 2008) mappingof high informative tiles from all test slides
图3:重点结果与讨论。 a. 不同模型的受试者工作特征曲线下面积(AUC-ROC)曲线,从左至右分别对应“OV-EMT”、“COLU-KRAS”、“LU-EGFR”和“BR-HER2”任务。以下同理。 b. 多实例学习(MIL)聚合器预训练的损失函数对数值,以及有无聚合器预训练的门控注意力池化(Gate-AttPool)模型的损失函数对数值比较。 c. Gate-AttPool模型与Inter-MIL模型的损失函数对数值比较。 d. 有无聚合器预训练的Inter-MIL模型的损失函数对数值比较。 e. 有无聚合器预训练的Gate-AttPool、Inter-MIL和自适应Inter-MIL(adInter-MIL)模型的AUC性能比较。在a到d中从左至右,以及在e中从左上角到右下角,图表展示了“OV-EMT”、“COLU-KRAS”、“LU-EGFR”和“BR-HER2”任务的结果。 f. 基线模型(左侧)和adInter-MIL模型(我们的模型,右侧)在不同尺度下的模型解释比较,以“OV-EMT”任务的案例为例。从下到上: f-(1) 细粒度尺度。实例化图块图像的梯度激活热图。 f-(2) 和 f-(3) 宏观尺度。代表性区域上的注意力热图,以及它们在切片上的相应位置。 f-(4) 切片级别的注意力分数统计。EMT低/高的不同预测结果的图块的注意力分数分布。 f-(5) 测试队列级别的特征空间可视化。所有测试切片中高信息含量图块的特征空间t分布随机邻域嵌入(t-SNE)映射(范德马腾(Van der Maaten)和辛顿(Hinton),2008年) 。
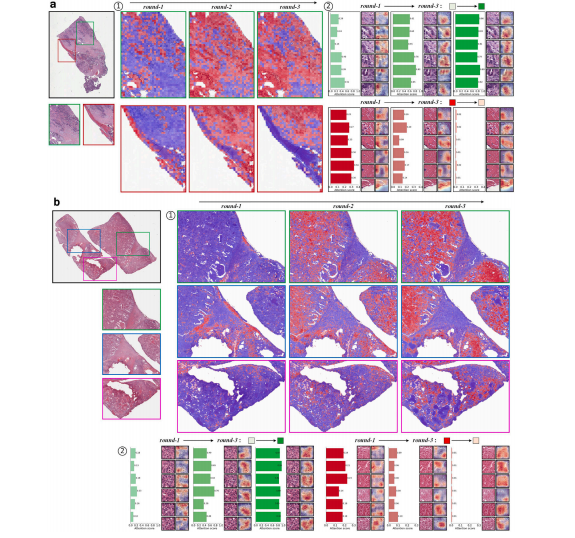
Fig. 4. Attention evolution of tile-level features after each self-interaction round. a, Example test case from the OV-EMT task. b, Example test case from the COLU-KRAS task. Theimages on the left show the location of the example regions in the original WSIs. ① shows the evolution of the attention heatmap in different slide regions. Colour transition fromblue to red indicates a rise in attention and vice versa. ② examples of tiles highly informative to the morphological classification task (green histograms) and of low relevance tothe task (red histograms). The histogram, tile image and its attention heatmap demonstrate the attention evolution of these regions. Here in both presented scenarios, attentionscores increase over time for tiles representing densely nuclear regions, and decrease for tiles containing connective tissue
图4:每次自交互轮次后图块级特征的注意力演变情况。 a. 来自“OV-EMT”任务的测试用例示例。 b. 来自“COLU-KRAS”任务的测试用例示例。左侧的图像展示了示例区域在原始全切片图像(WSI)中的位置。 ① 展示了不同切片区域中注意力热图的演变情况。颜色从蓝色过渡到红色表示注意力增加,反之亦然。 ② 对形态学分类任务具有高信息含量的图块示例(绿色柱状图)以及与该任务相关性低的图块示例(红色柱状图)。柱状图、图块图像及其注意力热图展示了这些区域的注意力演变情况。在这两种展示的场景中,代表细胞核密集区域的图块的注意力分数随着时间推移而增加,而包含结缔组织的图块的注意力分数则会降低。
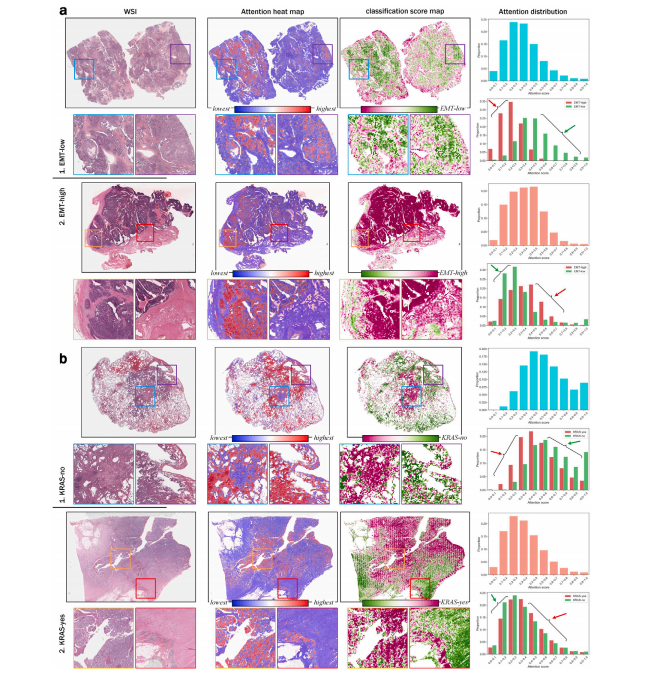
Fig. 5. Distributions of slide-level attention and classification scores in two morpho-molecular subtyping classification tasks. a, Example cases from the OV-EMT classification task,top: EMT-low case, bottom: EMT-high case. b, Example cases from the COLU-KRAS task, top: KRAS-no case, bottom: KRAS-yes case. For both a and b, from left to right: 1. theoriginal WSI and the selected regions of interest; 2. attention heatmap; 3. classification score map; 4. Tile-attention histograms. Top: the proportion of tiles in the different attentionranges, bottom: proportions of tiles with prediction results of EMT-low/high (KRAS-no/yes). Here, we observe that in cases of different subtypes, tiles with higher attention obtainprediction scores that correspond more closely to their subtypes.
图5:两项形态 - 分子亚型分类任务中切片级注意力和分类分数的分布情况。 a. “OV-EMT”分类任务的示例案例,上方:EMT低的案例,下方:EMT高的案例。 b. “COLU-KRAS”任务的示例案例,上方:KRAS无突变的案例,下方:KRAS有突变的案例。 对于a和b两者,从左至右依次为:1. 原始全切片图像(WSI)以及选定的感兴趣区域;2. 注意力热图;3. 分类分数图;4. 图块注意力柱状图。上方:处于不同注意力范围的图块所占比例,下方:预测结果为EMT低/高(KRAS无突变/有突变)的图块所占比例。 在此,我们观察到,在不同亚型的案例中,注意力较高的图块所得到的预测分数与它们各自的亚型更为接近。
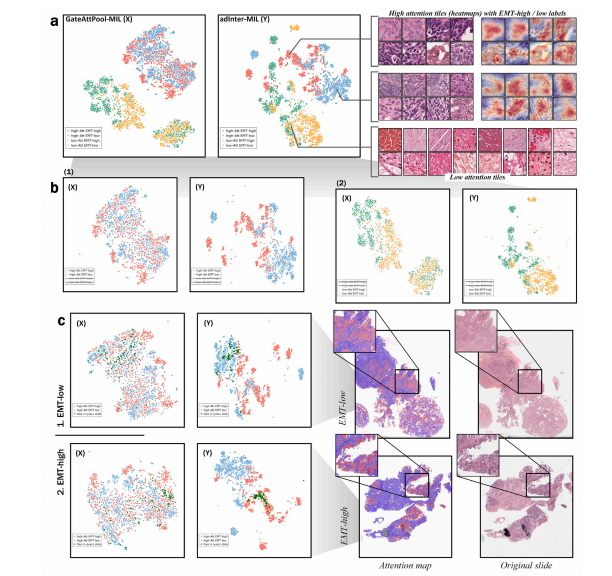
Fig. 6. A comparison of the feature spaces of all the representative tiles in the OV-EMT dataset for two of trained models. a, Left: the distribution of highly informative tilesand tiles with low task relevance in the learned cohort feature space, for the GatedAttPool-MIL (X) model and the adInter-MIL (Y) models; Right: example highly informativeEMT-high/EMT-low tiles and examples of tiles without discriminative features. b, Comparison of the feature spaces of the (X) and (Y) models for highly informative tiles andtiles with low task relevance. c, The distributions of the highly informative tiles (green) taken from the two example cases: with EMT-low and EMT-high status respectively overthe feature spaces of the two tested models. It can be seen that informative tiles form clearer, more separate clusters in the feature space of the adInter-MIL model. The tilescorresponding to the two example cases are located within the clusters corresponding to their correct label in the adInter-MIL feature space.
图6:在“OV-EMT”数据集中,针对两个已训练模型的所有代表性图块的特征空间比较。 a. 左侧:在已学习的队列特征空间中,对于门控注意力池化多实例学习(GatedAttPool-MIL,记为X)模型和自适应交互多实例学习(adInter-MIL,记为Y)模型,高信息含量图块和与任务相关性低的图块的分布情况;右侧:高信息含量的EMT高/EMT低图块示例以及无判别特征的图块示例。 b. 针对高信息含量图块和与任务相关性低的图块,比较(X)模型和(Y)模型的特征空间。 c. 分别从两个示例案例(EMT低和EMT高状态)中选取的高信息含量图块(绿色)在两个测试模型的特征空间中的分布情况。可以看出,在adInter-MIL模型的特征空间中,信息含量高的图块形成了更清晰、更分离的簇。在adInter-MIL特征空间中,与这两个示例案例相对应的图块位于与其正确标签相对应的簇内。
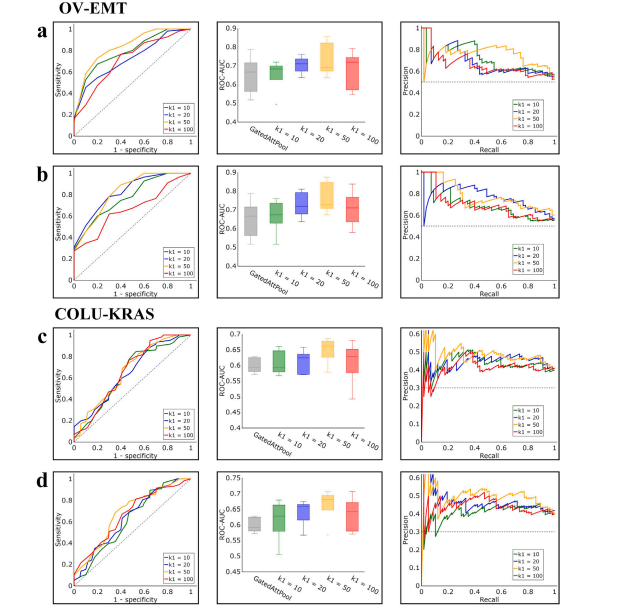
Fig. 7. Fluctuations in performance with various values of parameter 𝑘 1 , which could be 10, 20, 50 (used), and 100. a and b refer to the methods of Inter-MIL and adInter-MIL, onthe task of OV-EMT, while c and d show the performance of Inter-MIL and adInter-MIL, on the task of COLU-KRAS. For a, b, c, and d, the left shows the AUC-ROC curve underdifferent values of 𝑘 1 , the mid shows the result comparison of ROC-AUC, and the right shows the Precision–Recall Curve (PRC) under different values of 𝑘 1 .
图7:当参数(k_1)取不同值(可以是10、20、50(已使用的值)和100)时的性能波动情况。a和b指的是在“OV-EMT”任务中Inter-MIL和adInter-MIL方法的情况,而c和d展示了在“COLU-KRAS”任务中Inter-MIL和adInter-MIL的性能表现。对于a、b、c和d,左侧显示了在不同(k_1)值下的受试者工作特征曲线下面积(AUC-ROC)曲线,中间展示了受试者工作特征曲线下面积(ROC-AUC)的结果比较,右侧显示了在不同(k_1)值下的精确率-召回率曲线(PRC) 。
Table
表
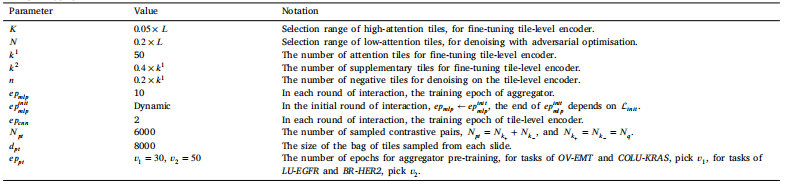
Table 1Setting of hyperparameters.
表1 超参数设置。
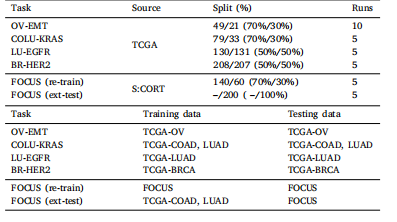
Table 2Summary of data preparation information.
表2 数据准备信息汇总。
Table 3Results on multiple molecular subtyping tasks with ROC-AUC ± std (%) over 10 runs for task OV-EMT and 5 runs for tasksCOLU-KRAS, LU-EGFR, and BR-HRER2.
表3 多个分子亚型分类任务的结果,对于“OV-EMT”任务,给出的是10次运行的受试者工作特征曲线下面积(ROC-AUC)±标准差(%);对于“COLU-KRAS”、“LU-EGFR”和“BR-HER2”任务,给出的是5次运行的相应结果。
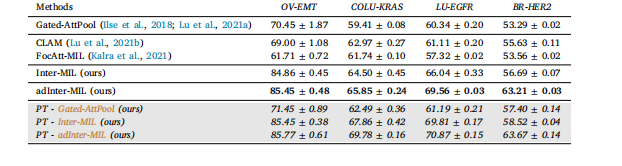
Table 4Results on multiple molecular subtyping tasks with BACC ± std (%) over 10 runs for task OV-EMT and 5 runs for tasksCOLU-KRAS, LU-EGFR, and BR-HRER2.
表4 多个分子亚型分类任务的结果,对于“OV-EMT”任务,给出的是10次运行的平衡准确率(BACC)±标准差(%);对于“COLU-KRAS”、“LU-EGFR”和“BR-HER2”任务,给出的是5次运行的相应结果。
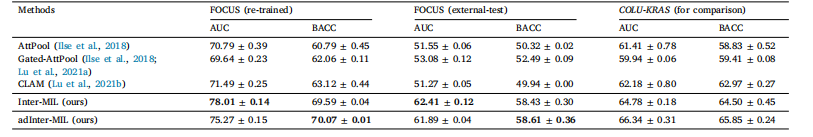
Table 5Results on KRAS mutation status prediction with ROC-AUC ± std (%) and BACC ± std (%) over 5 runs for external validation on FOCUS cohort, compared with the internalvalidation results on COLU-KRAS task.
表5 在FOCUS队列上进行外部验证时,关于KRAS突变状态预测的结果,以受试者工作特征曲线下面积(ROC-AUC)±标准差(%)和平衡准确率(BACC)±标准差(%)呈现,且是5次运行的结果,并与“COLU-KRAS”任务的内部验证结果进行了比较。