JVM内存结构深度解析:堆、栈、方法区、元空间、直接内存
目录
摘要
第一章:JVM内存结构总览与运行时数据区
1.1 JVM内存模型架构
1.2 运行时数据区详细解析
第二章:堆内存结构与分代收集机制
2.1 堆内存分代模型
2.2 垃圾收集算法与实现
第三章:虚拟机栈与栈帧详细解析
3.1 栈帧结构与执行引擎
第四章:方法区、永久代与元空间演进
4.1 从永久代到元空间的架构变革
第五章:直接内存与堆外内存管理
5.1 直接内存机制与使用场景
第六章:内存监控、调优与故障诊断
6.1 JVM内存监控工具链
6.2 内存泄漏诊断与优化
总结
核心要点总结
调优建议
未来趋势
参考链接
摘要
JVM内存结构是Java性能优化的核心基础。本文从运行时数据区出发,深入解析堆内存分代模型、虚拟机栈帧结构、方法区与元空间演进、直接内存机制等核心概念,通过内存监控工具、GC日志分析和实战调优案例,揭示JVM内存管理的内部原理和性能优化实践。
第一章:JVM内存结构总览与运行时数据区
1.1 JVM内存模型架构
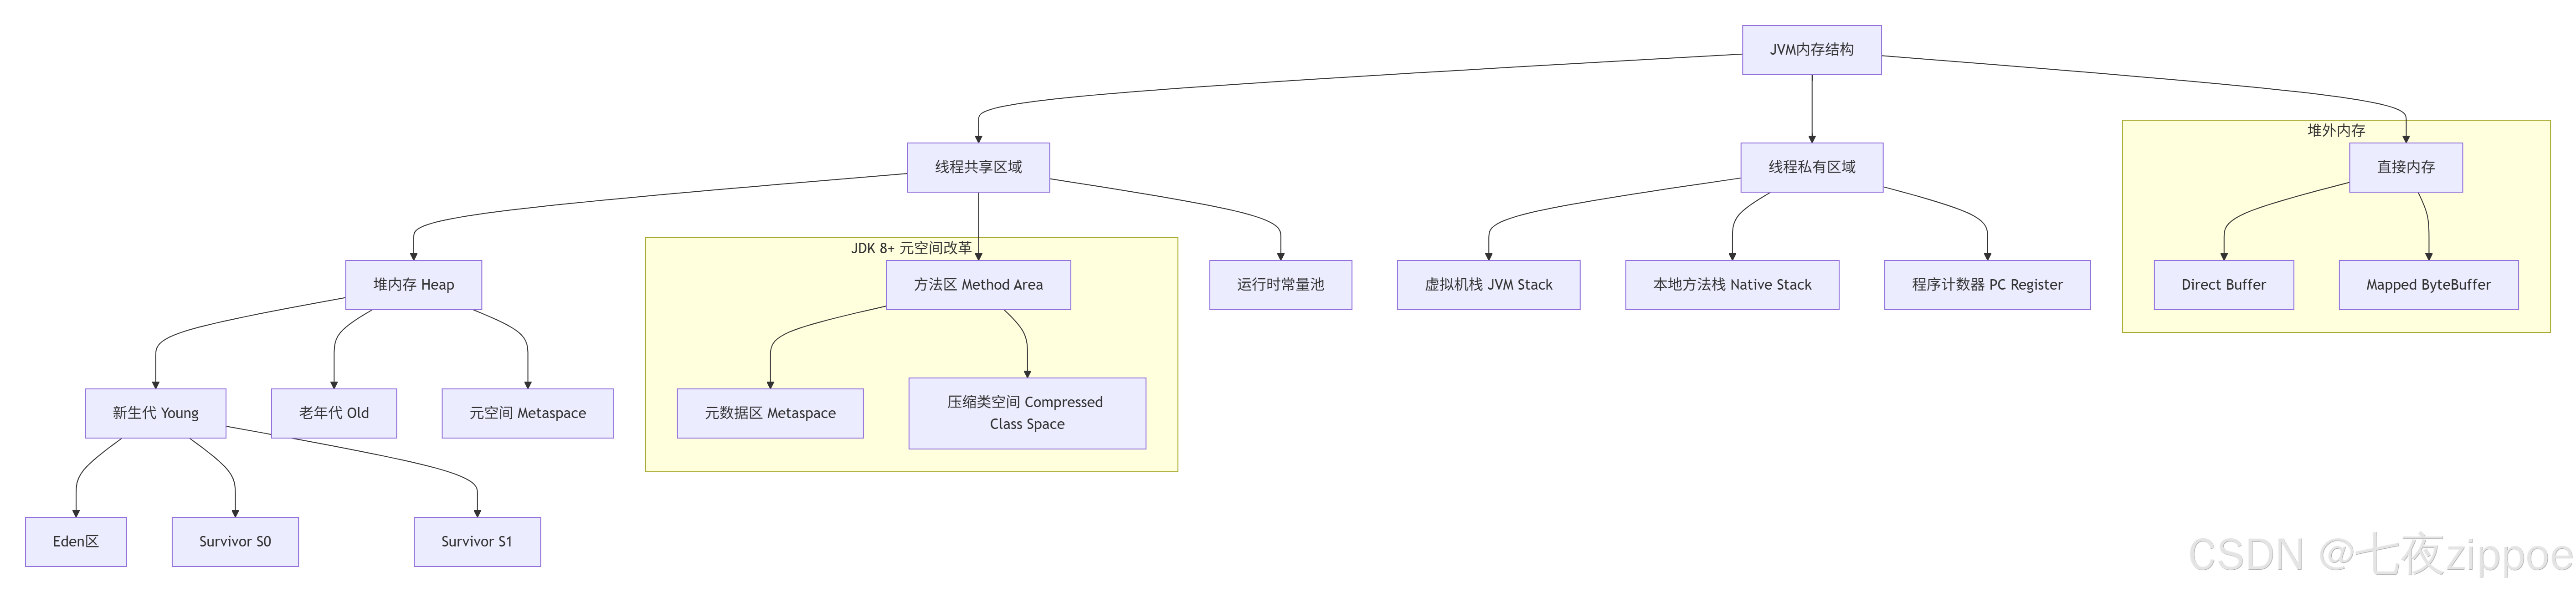
JVM内存区域核心特性对比:
/*** JVM内存区域特性详解*/
public class JVMMemoryRegions {// 内存区域类型枚举public enum MemoryRegionType {HEAP("堆内存", true, true, "所有线程共享,GC主要区域"),STACK("虚拟机栈", false, false, "线程私有,存储栈帧"),METASPACE("元空间", true, true, "类元数据存储,JDK8+"),DIRECT("直接内存", false, true, "堆外内存,NIO使用");private final String name;private final boolean shared;    // 是否线程共享private final boolean gc;        // 是否受GC管理private final String description;MemoryRegionType(String name, boolean shared, boolean gc, String desc) {this.name = name;this.shared = shared;this.gc = gc;this.description = desc;}}// 内存区域大小配置示例public class MemoryConfiguration {// 堆内存配置private long heapSize = 1024 * 1024 * 1024; // 1Gprivate long youngRatio = 3;                 // 新生代比例private long survivorRatio = 8;              // Survivor区比例// 元空间配置(JDK8+)private long metaspaceSize = 256 * 1024 * 1024;  // 256Mprivate long maxMetaspaceSize = 512 * 1024 * 1024; // 512M// 栈内存配置private int stackSize = 1024 * 1024; // 1M per thread// 直接内存配置private long maxDirectMemory = 512 * 1024 * 1024; // 512M}
}
1.2 运行时数据区详细解析
/*** 运行时数据区深度分析*/
public class RuntimeDataAreas {// 1. 程序计数器(Program Counter Register)public class ProgramCounter {// 特性:线程私有、无OOM、执行字节码行号指示器private volatile long currentAddress; // 当前指令地址public void executeMethod() {// 每个线程独立的程序计数器// 存储下一条要执行的字节码指令地址}}// 2. Java虚拟机栈(JVM Stack)public class JavaVirtualMachineStack {private final Stack<StackFrame> frames = new Stack<>();private final int maxDepth; // 栈深度限制// 栈帧结构public class StackFrame {// 局部变量表(Local Variables)private final Object[] localVariables;// 操作数栈(Operand Stack)private final Stack<Object> operandStack;// 动态链接(Dynamic Linking)private Method method;private Class<?> clazz;// 方法返回地址private int returnAddress;public StackFrame(Method method, int maxLocals, int stackSize) {this.method = method;this.localVariables = new Object[maxLocals];this.operandStack = new Stack<>();}}// 栈内存溢出模拟public void causeStackOverflow() {causeStackOverflow(); // 递归调用导致栈深度溢出}}// 3. 本地方法栈(Native Method Stack)public class NativeMethodStack {// 为Native方法服务,HotSpot将本地方法栈和虚拟机栈合二为一}// 4. Java堆(Heap)内存结构public class JavaHeap {private final YoungGeneration youngGen;  // 新生代private final OldGeneration oldGen;      // 老年代// 对象内存分配流程public Object allocateObject(Class<?> clazz) {// 1. 尝试在Eden区分配Object obj = youngGen.allocate(clazz);if (obj != null) return obj;// 2. 触发Minor GC后重试youngGen.minorGC();obj = youngGen.allocate(clazz);if (obj != null) return obj;// 3. 尝试老年代分配obj = oldGen.allocate(clazz);if (obj != null) return obj;// 4. 触发Full GCfullGC();obj = oldGen.allocate(clazz);if (obj != null) return obj;// 5. 内存不足,抛出OOMthrow new OutOfMemoryError("Java heap space");}}// 5. 方法区(Method Area)与元空间public class MethodArea {// JDK7之前:永久代(PermGen)// JDK8+:元空间(Metaspace)private final ClassLoaderData classLoaderData;private final RuntimeConstantPool constantPool;// 存储内容:类信息、常量、静态变量、即时编译器代码public void loadClass(String className) {// 类加载过程在方法区记录元数据ClassMetadata metadata = new ClassMetadata(className);// 存储到元空间storeClassMetadata(metadata);}}
}
第二章:堆内存结构与分代收集机制
2.1 堆内存分代模型
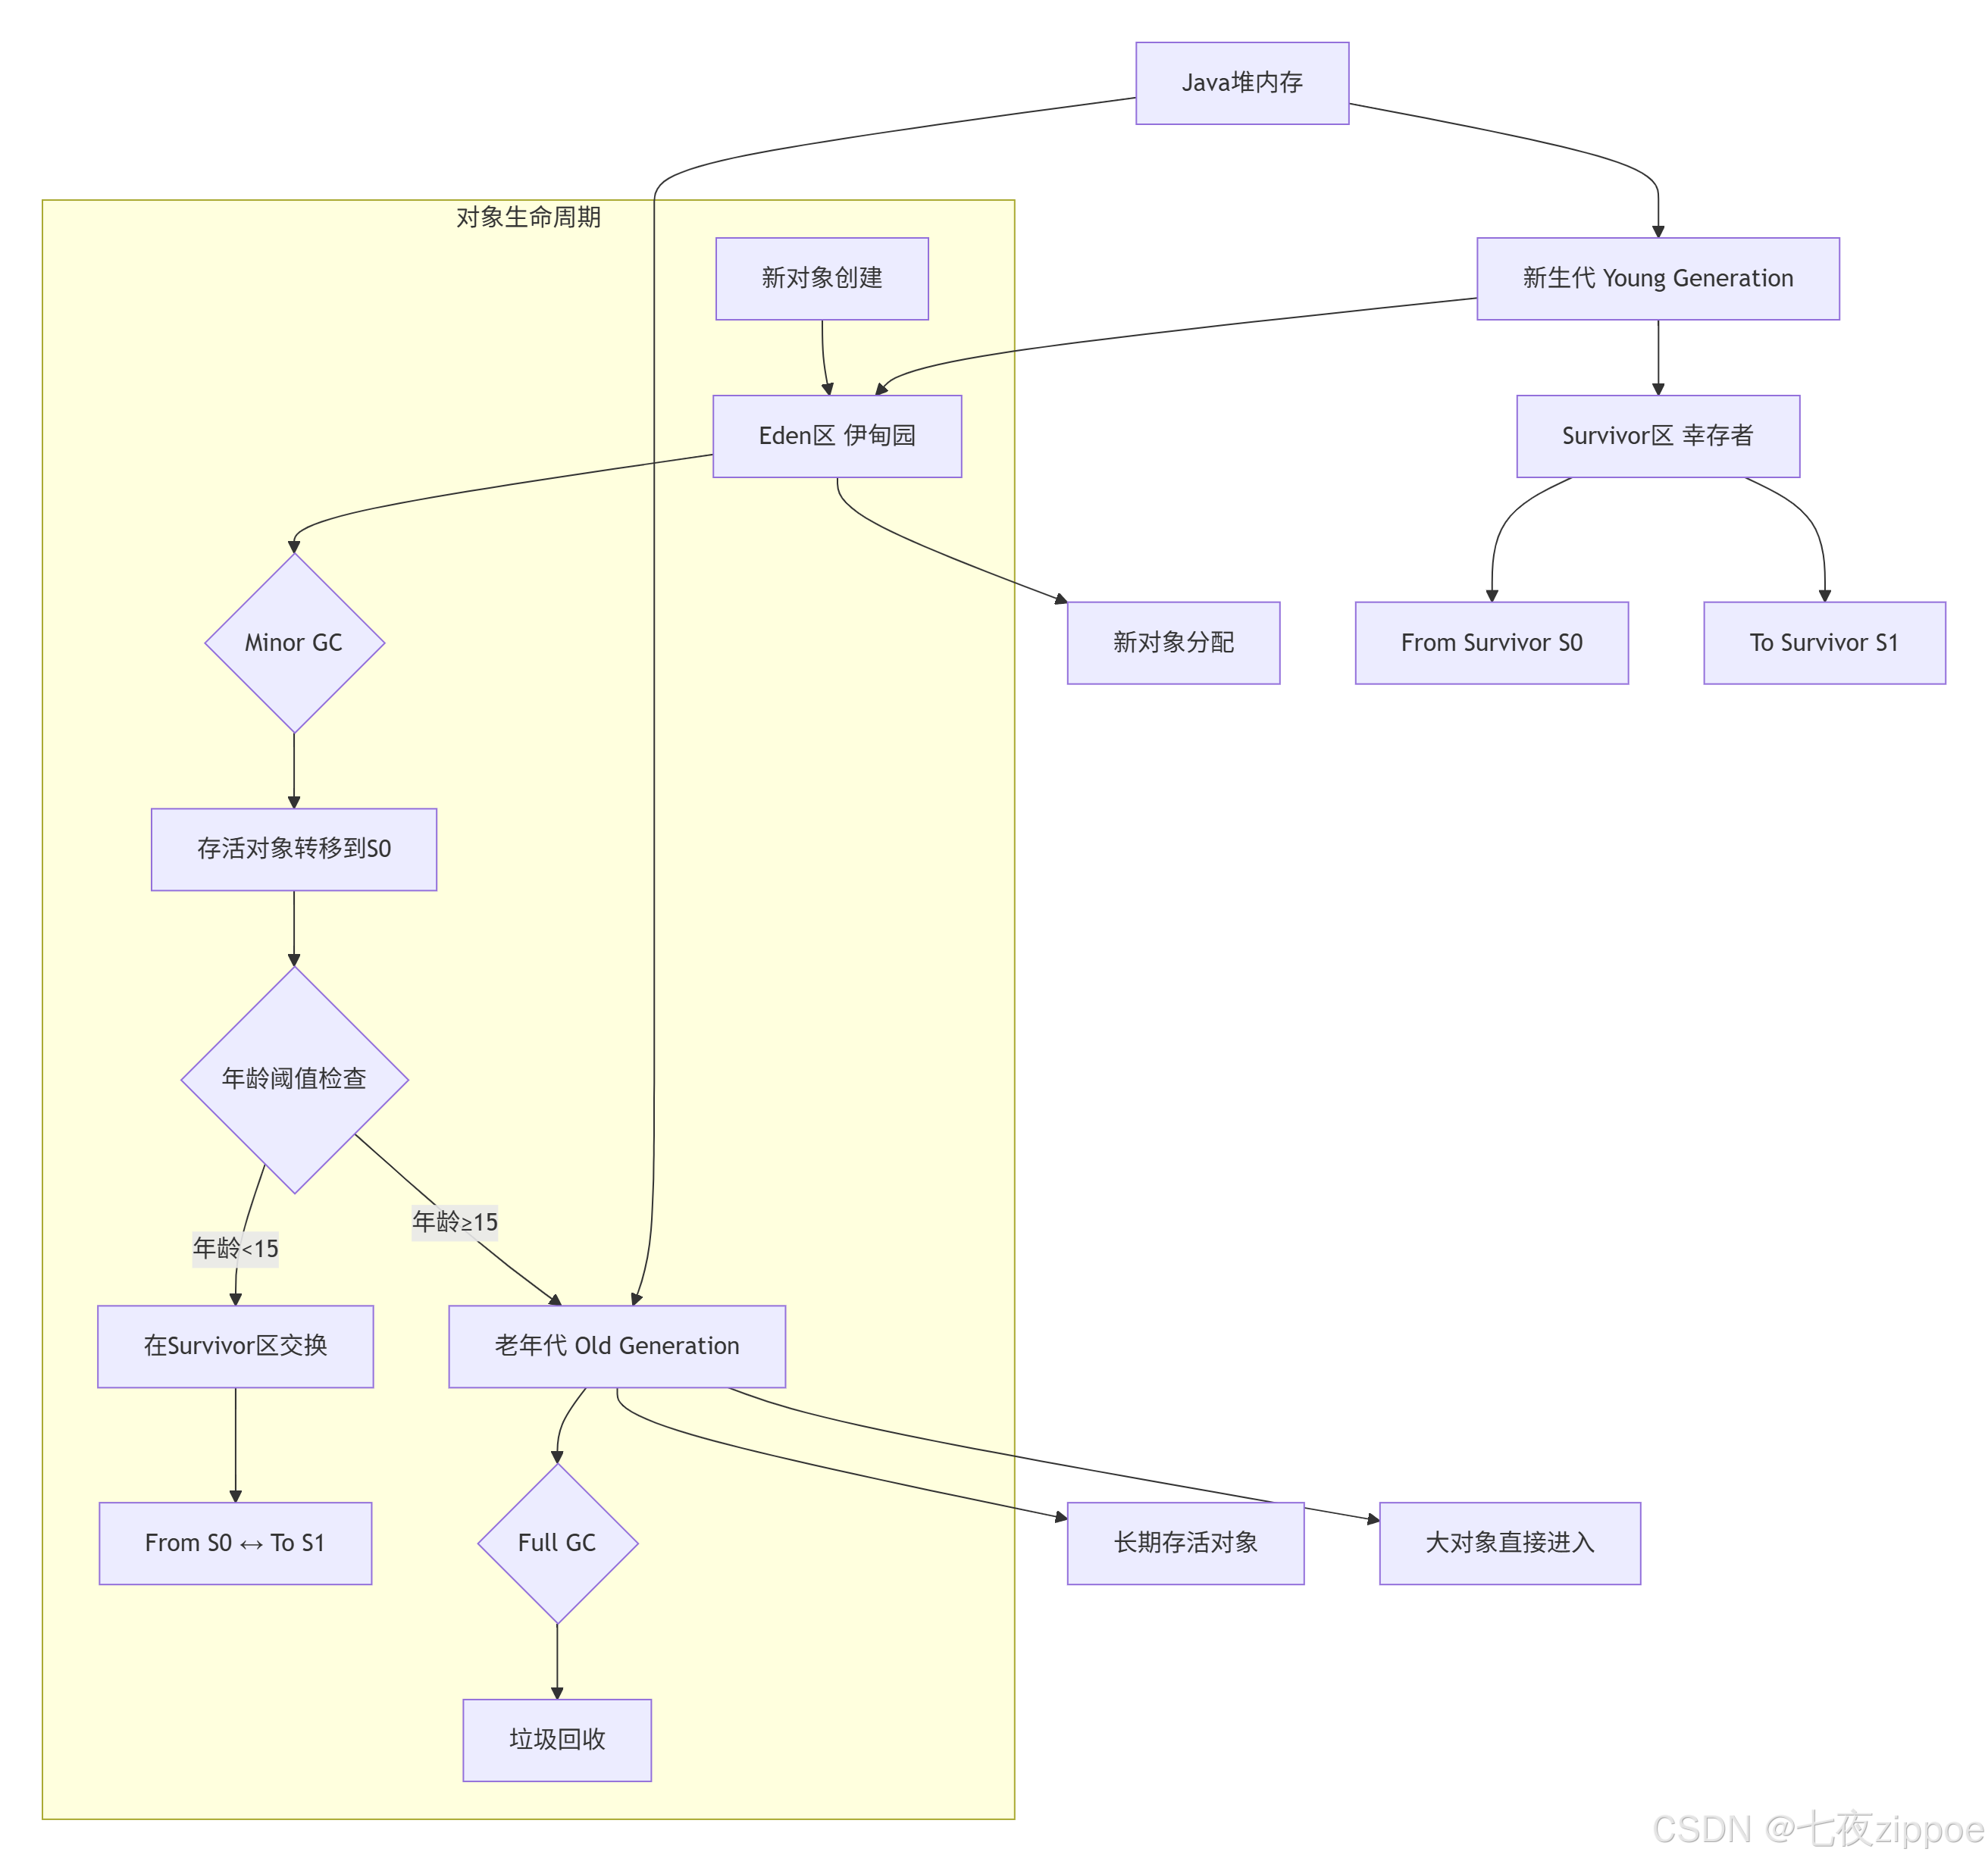
堆内存分代配置与对象分配:
/*** 堆内存分代模型详解*/
public class HeapGenerationModel {// 堆内存分代比例配置public class GenerationConfiguration {// 年轻代占比(-XX:NewRatio)private double newRatio = 2.0; // 年轻代:老年代 = 1:2// Eden与Survivor比例(-XX:SurvivorRatio)private int survivorRatio = 8; // Eden:Survivor = 8:1:1// 对象晋升年龄阈值(-XX:MaxTenuringThreshold)private int maxTenuringThreshold = 15;// 大对象直接进入老年代阈值private int pretenureSizeThreshold = 1024 * 1024; // 1MB}// 对象分配流程模拟public class ObjectAllocator {private final YoungAllocator youngAllocator;private final OldAllocator oldAllocator;private int objectAge = 0;public Object allocate(Class<?> clazz, int size) {// 1. 检查是否为大对象if (size > pretenureSizeThreshold) {return oldAllocator.allocate(clazz, size);}// 2. 尝试在Eden区分配Object obj = youngAllocator.allocateEden(clazz, size);if (obj != null) {return obj;}// 3. Eden区不足,触发Minor GCminorGC();// 4. 重新尝试分配obj = youngAllocator.allocateEden(clazz, size);if (obj != null) {return obj;}// 5. 尝试老年代分配return oldAllocator.allocate(clazz, size);}// 对象年龄增长模拟public void incrementAge(Object obj) {objectAge++;if (objectAge >= maxTenuringThreshold) {promoteToOldGeneration(obj); // 晋升老年代}}}// GC日志分析示例public class GCLogAnalyzer {// 典型的GC日志模式public void analyzeGCLog(String logLine) {// [GC (Allocation Failure) [PSYoungGen: 8192K->1024K(9216K)] //  8192K->2048K(19456K), 0.0023456 secs]// 解析关键信息:// - GC原因:Allocation Failure(分配失败)// - 年轻代:回收前8M->回收后1M(总9M)// - 堆内存:回收前8M->回收后2M(总19M)// - 耗时:2.3毫秒}// 内存溢出分析public void analyzeOOM(OutOfMemoryError error) {// Java heap space - 堆内存不足// PermGen space - 永久代不足(JDK7)// Metaspace - 元空间不足(JDK8+)// Unable to create new native thread - 栈内存不足}}
}
2.2 垃圾收集算法与实现
/*** 垃圾收集算法深度解析*/
public class GarbageCollectionAlgorithms {// 1. 标记-清除算法(Mark-Sweep)public class MarkSweepGC {public void garbageCollect() {// 第一阶段:标记存活对象markLiveObjects();// 第二阶段:清除未标记对象sweepDeadObjects();}private void markLiveObjects() {// 从GC Roots开始遍历标记// 包括:虚拟机栈、本地方法栈、静态变量、常量等}private void sweepDeadObjects() {// 清理未标记的对象内存// 问题:产生内存碎片}}// 2. 复制算法(Copying)- 年轻代使用public class CopyingGC {private MemoryRegion fromSpace; // From Survivorprivate MemoryRegion toSpace;   // To Survivorpublic void minorGC() {// 将Eden和From Survivor的存活对象复制到To SurvivorcopyLiveObjects(fromSpace, toSpace);// 交换From和To角色swapSpaces();}}// 3. 标记-整理算法(Mark-Compact)- 老年代使用public class MarkCompactGC {public void fullGC() {markLiveObjects();     // 标记存活对象calculateNewAddresses(); // 计算新地址compactMemory();       // 整理内存updateReferences();    // 更新引用}}// 4. 分代收集策略public class GenerationalGC {private final double minorGCTime = 0.1;  // 年轻代GC时间private final double fullGCTime = 1.0;   // Full GC时间public void collect() {// 年轻代:复制算法,频率高,速度快if (youngGen.isFull()) {long start = System.currentTimeMillis();youngGen.minorGC();minorGCTime = System.currentTimeMillis() - start;}// 老年代:标记-整理,频率低,速度慢if (oldGen.isFull()) {long start = System.currentTimeMillis();oldGen.fullGC();fullGCTime = System.currentTimeMillis() - start;}}}
}
第三章:虚拟机栈与栈帧详细解析
3.1 栈帧结构与执行引擎
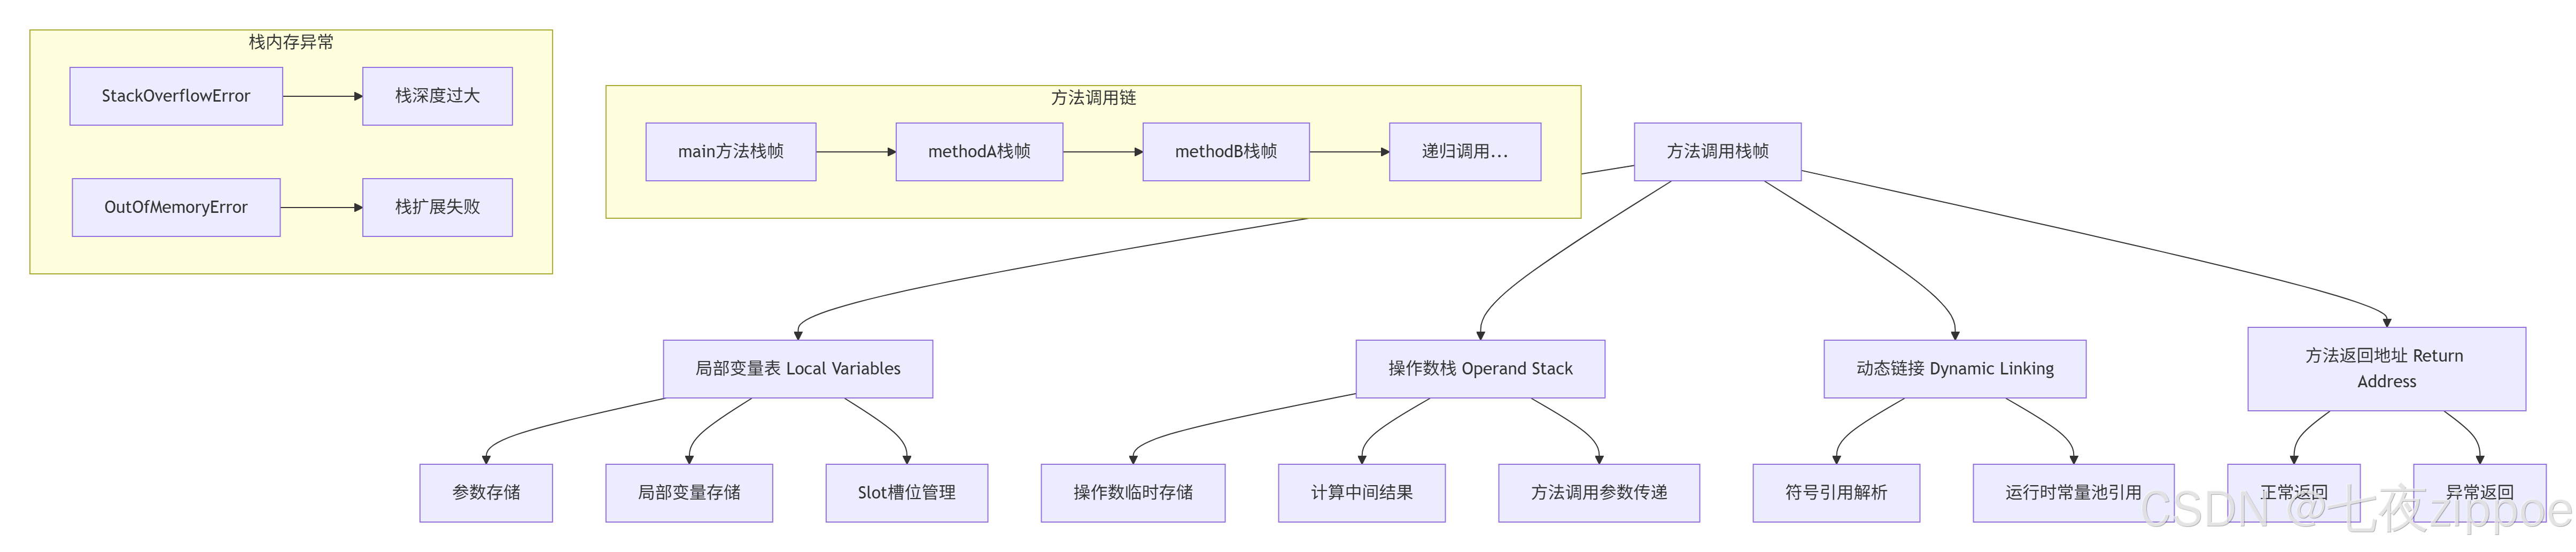
栈帧详细实现与操作:
/*** 虚拟机栈与栈帧实现详解*/
public class JVMStackImplementation {// 栈帧完整结构public class StackFrame {private final Method method;           // 当前执行方法private final Class<?> declaringClass; // 方法所属类// 1. 局部变量表(Local Variable Table)private final Object[] localVariables;private final int maxLocals;// 2. 操作数栈(Operand Stack)private final Stack<Object> operandStack;private final int maxStack;// 3. 动态链接(Dynamic Linking)private final ConstantPool constantPool; // 运行时常量池引用private int pc; // 程序计数器(当前方法内)// 4. 方法返回信息private StackFrame callerFrame;    // 调用者栈帧private int returnPc;              // 返回地址public StackFrame(Method method, Object[] args) {this.method = method;this.maxLocals = method.getMaxLocals();this.maxStack = method.getMaxStack();this.localVariables = new Object[maxLocals];this.operandStack = new Stack<>();// 初始化局部变量表(参数存入)System.arraycopy(args, 0, localVariables, 0, args.length);}// 字节码执行模拟public void executeBytecode() {while (pc < method.getCodeLength()) {int opcode = method.getBytecode(pc);switch (opcode) {case Opcodes.ILOAD:  // 加载int到操作数栈int index = method.getBytecode(pc + 1);operandStack.push(localVariables[index]);pc += 2;break;case Opcodes.IADD:   // 整数加法int value2 = (Integer) operandStack.pop();int value1 = (Integer) operandStack.pop();operandStack.push(value1 + value2);pc += 1;break;case Opcodes.IRETURN: // 方法返回returnToCaller();break;}}}}// 方法调用深度监控public class StackDepthMonitor {private static final int MAX_STACK_DEPTH = 1024;private int currentDepth = 0;public void methodEnter(Method method) {currentDepth++;if (currentDepth > MAX_STACK_DEPTH) {throw new StackOverflowError("Method call too deep: " + currentDepth);}// 记录方法调用栈logStackTrace(method);}public void methodExit() {currentDepth--;}// 栈内存监控public void monitorStackUsage() {Thread thread = Thread.currentThread();int stackSize = thread.getStackTrace().length;long freeMemory = Runtime.getRuntime().freeMemory();if (stackSize > MAX_STACK_DEPTH * 0.8) {// 栈深度预警System.out.println("Stack depth warning: " + stackSize);}}}
}
第四章:方法区、永久代与元空间演进
4.1 从永久代到元空间的架构变革
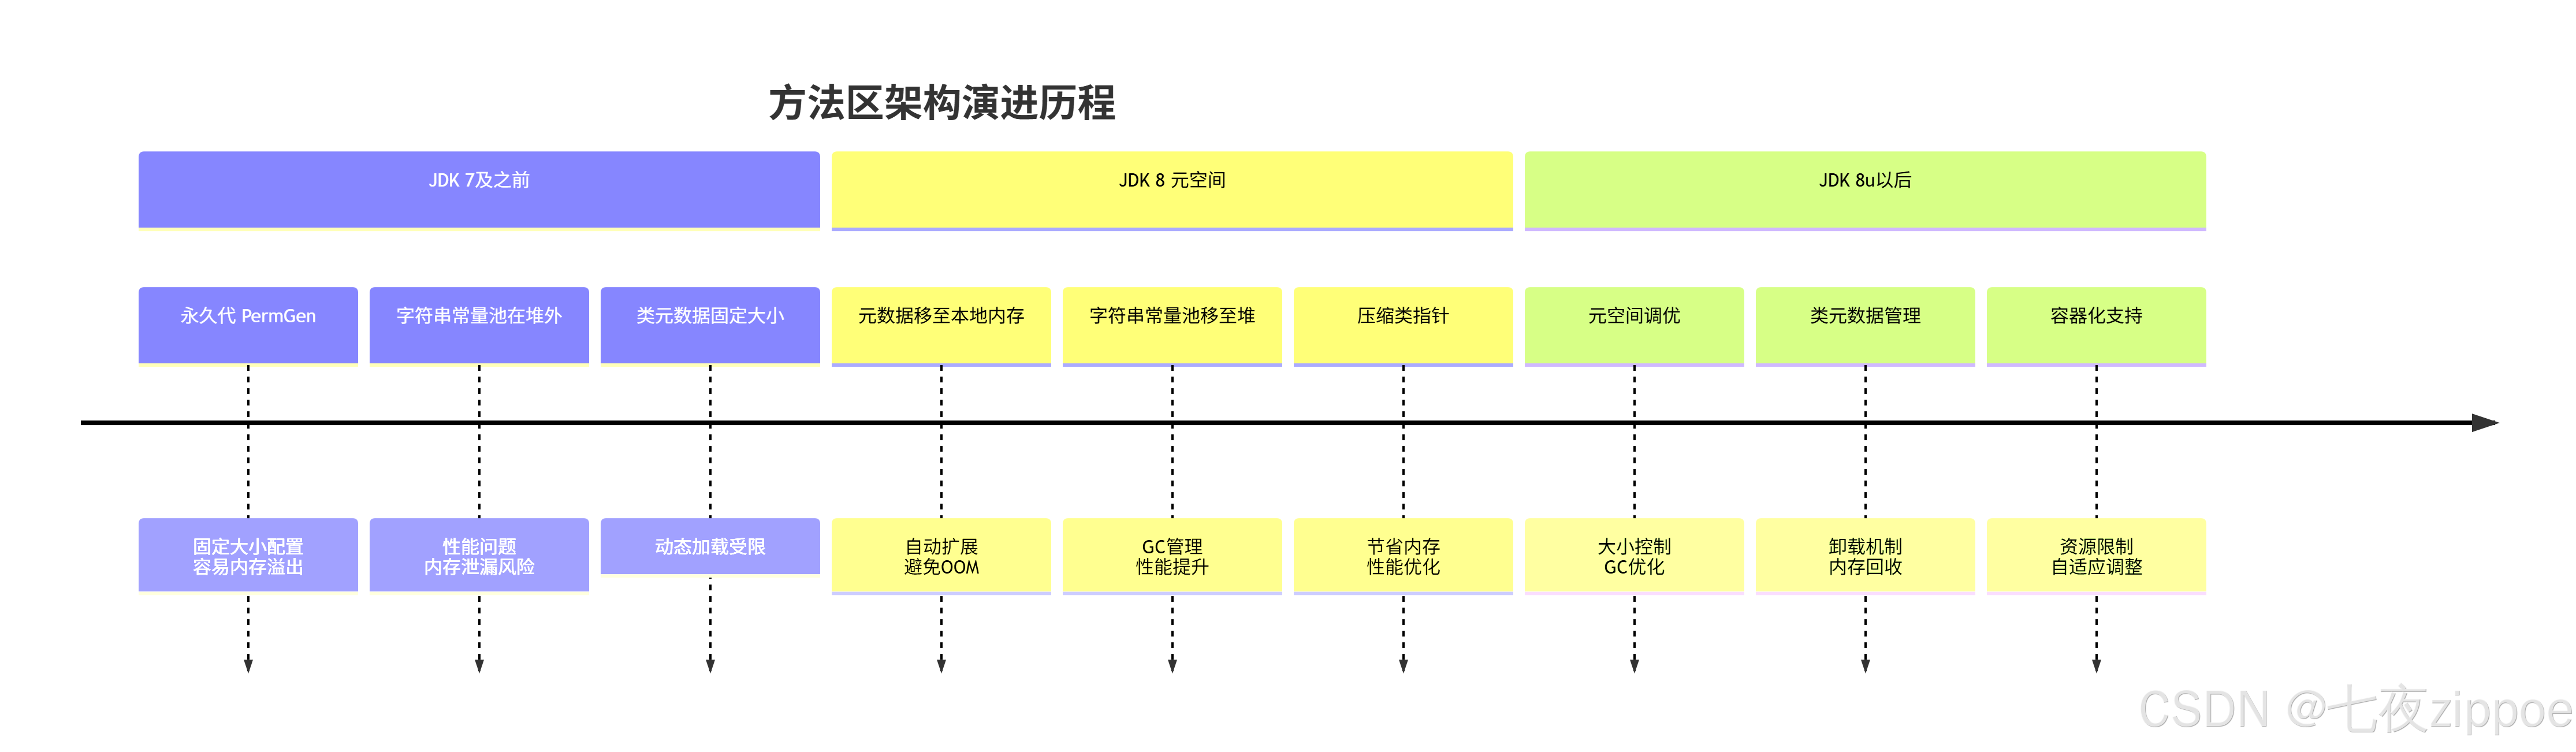
元空间内部机制详解:
/*** 元空间架构与内存管理*/
public class MetaspaceArchitecture {// 元空间核心组件public class MetaspaceStructure {// 1. 类加载器数据区(ClassLoaderData)private final Map<ClassLoader, ClassLoaderData> loaderDataMap;// 2. 元数据分配器private final MetadataAllocator allocator;// 3. 压缩类指针空间private final CompressedClassSpace compressedClassSpace;// 元空间统计信息public class MetaspaceStats {private long usedMetaspace;      // 已使用元空间private long capacityMetaspace;  // 元空间容量private long committedMetaspace; // 提交内存大小private long maxMetaspace;       // 最大元空间}}// 类元数据生命周期管理public class ClassMetadataLifecycle {// 类加载阶段public Class<?> loadClass(String name, byte[] bytecode) {// 1. 元空间分配内存存储类元数据ClassMetadata metadata = allocateClassMetadata(name);// 2. 解析常量池、方法、字段等元数据parseConstantPool(metadata, bytecode);parseMethods(metadata, bytecode);parseFields(metadata, bytecode);// 3. 链接和初始化linkClass(metadata);initializeClass(metadata);return metadata.getJavaClass();}// 类卸载条件public boolean canUnloadClass(Class<?> clazz) {// 1. 类的所有实例都被回收if (hasActiveInstances(clazz)) return false;// 2. 类的ClassLoader被回收if (clazz.getClassLoader() != null && isClassLoaderAlive(clazz.getClassLoader())) return false;// 3. 类对应的java.lang.Class对象没有被引用if (isClassObjectReferenced(clazz)) return false;return true;}}// 元空间监控与调优public class MetaspaceMonitor {private final MBeanServer mbeanServer;private final ObjectName metaspaceMBean;public void monitorMetaspace() {// 获取元空间使用情况long used = (Long) mbeanServer.getAttribute(metaspaceMBean, "Used");long capacity = (Long) mbeanServer.getAttribute(metaspaceMBean, "Capacity");long committed = (Long) mbeanServer.getAttribute(metaspaceMBean, "Committed");double usageRatio = (double) used / capacity;if (usageRatio > 0.8) {// 元空间使用率过高预警System.out.println("Metaspace usage high: " + usageRatio);}}// 元空间GC触发条件public void checkMetaspaceGC() {// 当元空间使用达到阈值时触发GCif (needMetaspaceGC()) {System.gc(); // 触发Full GC回收元空间}}}
}
第五章:直接内存与堆外内存管理
5.1 直接内存机制与使用场景
/*** 直接内存(堆外内存)深度解析*/
public class DirectMemoryManagement {// 直接内存分配器public class DirectByteBufferAllocator {private static final Unsafe unsafe = getUnsafe();private long allocatedMemory = 0;private final long maxDirectMemory;// 分配直接内存public ByteBuffer allocateDirect(int capacity) {// 检查内存限制if (allocatedMemory + capacity > maxDirectMemory) {// 尝试GC回收已清理的直接内存System.gc();try {Thread.sleep(100);} catch (InterruptedException e) {Thread.currentThread().interrupt();}if (allocatedMemory + capacity > maxDirectMemory) {throw new OutOfMemoryError("Direct buffer memory");}}// 使用Unsafe分配本地内存long address = unsafe.allocateMemory(capacity);allocatedMemory += capacity;// 创建Cleaner用于内存释放Cleaner cleaner = Cleaner.create(this, new Deallocator(address, capacity));return new DirectByteBuffer(address, capacity, cleaner);}// 内存释放器private static class Deallocator implements Runnable {private final long address;private final long size;Deallocator(long address, long size) {this.address = address;this.size = size;}@Overridepublic void run() {unsafe.freeMemory(address);allocatedMemory -= size;}}}// 直接内存使用场景public class DirectMemoryUsage {// 场景1:大文件内存映射public void memoryMappedFile() throws IOException {RandomAccessFile file = new RandomAccessFile("largefile.dat", "rw");FileChannel channel = file.getChannel();// 创建内存映射缓冲区MappedByteBuffer buffer = channel.map(FileChannel.MapMode.READ_WRITE, 0, channel.size());// 直接操作文件内容,避免内核态到用户态拷贝while (buffer.hasRemaining()) {byte b = buffer.get();processByte(b);}// 强制刷盘buffer.force();}// 场景2:网络IO高性能缓冲区public void networkIOBuffer() {// 分配直接内存作为网络缓冲区ByteBuffer buffer = ByteBuffer.allocateDirect(64 * 1024); // 64KB// 在NIO通道中使用SocketChannel channel = SocketChannel.open();channel.read(buffer);  // 零拷贝读取buffer.flip();channel.write(buffer); // 零拷贝写入}// 场景3:原生内存操作public void nativeMemoryOperation() {ByteBuffer buffer = ByteBuffer.allocateDirect(1024);// 获取直接内存地址long address = ((DirectBuffer) buffer).address();// 使用Unsafe直接操作内存unsafe.putInt(address, 123);     // 写入intint value = unsafe.getInt(address); // 读取int}}// 直接内存监控工具public class DirectMemoryMonitor {public void monitorDirectMemory() {try {// 通过BufferPoolMXBean监控List<BufferPoolMXBean> pools = ManagementFactory.getPlatformMXBeans(BufferPoolMXBean.class);for (BufferPoolMXBean pool : pools) {if ("direct".equals(pool.getName())) {System.out.println("Direct Buffer Count: " + pool.getCount());System.out.println("Direct Memory Used: " + pool.getMemoryUsed());System.out.println("Direct Memory Total: " + pool.getTotalCapacity());}}} catch (Exception e) {e.printStackTrace();}}}
}
第六章:内存监控、调优与故障诊断
6.1 JVM内存监控工具链
/*** JVM内存监控与诊断工具*/
public class JVMMemoryMonitoring {// 1. 命令行监控工具public class CommandLineTools {// jstat - 运行时监控public void jstatMonitoring() {// jstat -gc <pid> 1000 10// 每1秒采集一次GC情况,共10次// 输出指标:// S0C/S1C: Survivor区容量// S0U/S1U: Survivor区使用量// EC/EU: Eden区容量/使用量// OC/OU: 老年代容量/使用量// MC/MU: 元空间容量/使用量// YGC/YGCT: 年轻代GC次数/时间// FGC/FGCT: Full GC次数/时间// GCT: 总GC时间}// jmap - 内存转储public void jmapHeapDump() {// jmap -heap <pid>        # 堆内存概要// jmap -histo <pid>        # 对象直方图// jmap -dump:format=b,file=heap.bin <pid> # 堆转储}// jstack - 线程栈分析public void jstackAnalysis() {// jstack <pid> > thread.dump// 分析线程状态、锁竞争、死锁等}}// 2. JMX监控接口public class JMXMemoryMonitor {private final MBeanServer mbeanServer;public void monitorMemoryUsage() {// 获取内存池MBeanList<MemoryPoolMXBean> pools = ManagementFactory.getMemoryPoolMXBeans();for (MemoryPoolMXBean pool : pools) {MemoryUsage usage = pool.getUsage();String poolName = pool.getName();System.out.println("Pool: " + poolName);System.out.println("  Used: " + usage.getUsed() / 1024 / 1024 + "MB");System.out.println("  Max: " + usage.getMax() / 1024 / 1024 + "MB");System.out.println("  Usage: " + (usage.getUsed() * 100 / usage.getMax()) + "%");}}// GC监控public void monitorGC() {List<GarbageCollectorMXBean> gcBeans = ManagementFactory.getGarbageCollectorMXBeans();for (GarbageCollectorMXBean gc : gcBeans) {System.out.println("GC: " + gc.getName());System.out.println("  Count: " + gc.getCollectionCount());System.out.println("  Time: " + gc.getCollectionTime() + "ms");}}}// 3. 程序化内存监控public class ProgrammaticMonitor {private final ScheduledExecutorService scheduler = Executors.newScheduledThreadPool(1);public void startMemoryMonitoring() {scheduler.scheduleAtFixedRate(() -> {try {Runtime runtime = Runtime.getRuntime();long total = runtime.totalMemory();long free = runtime.freeMemory();long used = total - free;long max = runtime.maxMemory();System.out.printf("Memory Usage: Used=%dMB, Free=%dMB, Total=%dMB, Max=%dMB%n",used / 1024 / 1024, free / 1024 / 1024, total / 1024 / 1024, max / 1024 / 1024);// 监控堆外内存monitorDirectMemory();} catch (Exception e) {e.printStackTrace();}}, 0, 5, TimeUnit.SECONDS); // 每5秒监控一次}}
}
6.2 内存泄漏诊断与优化
/*** 内存泄漏检测与优化实践*/
public class MemoryLeakDetection {// 1. 内存泄漏模式识别public class MemoryLeakPatterns {// 模式1:静态集合引起的内存泄漏public class StaticCollectionLeak {private static final Map<String, Object> CACHE = new HashMap<>();public void addToCache(String key, Object value) {CACHE.put(key, value); // 对象永远无法被GC}}// 模式2:监听器未注销public class ListenerLeak {private final List<EventListener> listeners = new ArrayList<>();public void addListener(EventListener listener) {listeners.add(listener);// 忘记移除:removeListener方法缺失}}// 模式3:内部类持有外部类引用public class InnerClassLeak {private byte[] largeData = new byte[10 * 1024 * 1024]; // 10MBpublic Runnable createTask() {return new Runnable() { // 匿名内部类隐式持有外部类引用@Overridepublic void run() {System.out.println("Processing: " + largeData.length);}};}}}// 2. 内存分析工具使用public class HeapDumpAnalysis {// 生成堆转储文件public void generateHeapDump() {try {// 使用JMX触发堆转储HotSpotDiagnosticMXBean diagnostic = ManagementFactory.getPlatformMXBean(HotSpotDiagnosticMXBean.class);diagnostic.dumpHeap("heapdump.hprof", true);} catch (IOException e) {e.printStackTrace();}}// 分析堆转储文件public void analyzeHeapDump() {// 使用Eclipse MAT或JProfiler分析:// 1. 查找大对象// 2. 分析对象引用链// 3. 识别内存泄漏点// 4. 查看GC Roots路径}}// 3. 内存优化最佳实践public class MemoryOptimization {// 优化1:使用软引用/弱引用缓存public class SoftReferenceCache<K, V> {private final Map<K, SoftReference<V>> cache = new HashMap<>();public void put(K key, V value) {cache.put(key, new SoftReference<>(value));}public V get(K key) {SoftReference<V> ref = cache.get(key);return ref != null ? ref.get() : null;}}// 优化2:对象池化public class ObjectPool<T> {private final Queue<SoftReference<T>> pool = new ConcurrentLinkedQueue<>();private final Supplier<T> factory;public T borrowObject() {SoftReference<T> ref;while ((ref = pool.poll()) != null) {T obj = ref.get();if (obj != null) return obj;}return factory.get();}public void returnObject(T obj) {pool.offer(new SoftReference<>(obj));}}// 优化3:及时释放资源public class ResourceCleanup {public void processWithCleanup() {ByteBuffer buffer = null;try {buffer = ByteBuffer.allocateDirect(1024);// 使用buffer...} finally {if (buffer != null) {// 显式清理直接内存if (buffer.isDirect()) {Cleaner cleaner = ((DirectBuffer) buffer).cleaner();if (cleaner != null) {cleaner.clean();}}}}}}}
}
总结
JVM内存结构是Java应用性能的基石,通过本文的深入解析,我们可以得出以下关键结论:
核心要点总结
-
堆内存管理:分代模型优化GC效率,合理配置各区域比例
-
栈内存控制:注意递归深度和线程数量,避免StackOverflowError
-
元空间优化:JDK8+的元空间需要合理配置大小,监控类加载情况
-
直接内存使用:适合大内存操作,但需要谨慎管理防止内存泄漏
调优建议
-
监控先行:使用JVM工具持续监控内存使用情况
-
渐进调优:根据实际负载逐步调整内存参数
-
预防为主:在编码阶段注意内存泄漏风险
-
工具熟练:掌握MAT、JProfiler等分析工具的使用
未来趋势
-
容器化适配:JVM在容器环境中的内存自动配置
-
ZGC/Shenandoah:新一代低延迟垃圾收集器的内存管理
-
云原生优化:面向微服务和Serverless的内存优化策略
深入理解JVM内存结构,是编写高性能、高稳定性Java应用的基础,也是进行有效性能调优的前提条件。
参考链接
-
Oracle官方JVM规范
-
Java性能调优指南
-
Eclipse Memory Analyzer
-
JVM Troubleshooting Guide
-
Garbage Collection Tuning
-
JVM Internals Blog