MATLAB 模拟台风路径和强度变化
MATLAB 模拟台风路径和强度变化
% 台风模拟程序
% 该程序模拟台风的路径、中心气压和最大风速变化clear; clc; close all;%% 初始化参数设置
% 时间参数
t_total = 72; % 模拟总时间(小时)
dt = 1; % 时间步长(小时)
t = 0:dt:t_total; % 时间向量
n = length(t); % 时间步数% 初始位置(经纬度) - 示例:西北太平洋某区域
lat = zeros(1, n); % 纬度数组
lon = zeros(1, n); % 经度数组
lat(1) = 15; % 初始纬度(度)
lon(1) = 125; % 初始经度(度)% 台风强度参数
P_center = zeros(1, n); % 中心气压(hPa)
V_max = zeros(1, n); % 最大风速(m/s)
P_center(1) = 980; % 初始中心气压
V_max(1) = 35; % 初始最大风速% 运动参数
speed = zeros(1, n); % 移动速度(km/h)
direction = zeros(1, n); % 移动方向(度,从正北顺时针)
speed(1) = 15; % 初始移动速度
direction(1) = 30; % 初始移动方向(30度即东北偏北)%% 模拟台风运动和强度变化
for i = 2:n% 模拟移动方向变化 - 加入随机扰动,总体向西北方向移动direction(i) = direction(i-1) + 2*(rand-0.5) - 0.3;direction(i) = mod(direction(i), 360); % 保持在0-360度% 模拟移动速度变化speed(i) = speed(i-1) + 0.5*(rand-0.5);speed(i) = max(5, min(30, speed(i))); % 限制速度范围% 计算经纬度变化(简化计算)% 1度纬度 ≈ 111 km,1度经度在纬度lat处 ≈ 111*cos(lat) kmdlat = (speed(i)*dt / 111) * cosd(direction(i));dlon = (speed(i)*dt / (111*cosd(lat(i-1)))) * sind(direction(i));lat(i) = lat(i-1) + dlat;lon(i) = lon(i-1) + dlon;% 模拟强度变化 - 先增强后减弱if i < n/3% 前1/3时间增强:气压降低,风速增大P_center(i) = P_center(i-1) - 0.8*(rand);V_max(i) = V_max(i-1) + 0.3*(rand);else% 后2/3时间减弱:气压升高,风速减小P_center(i) = P_center(i-1) + 0.5*(rand);V_max(i) = V_max(i-1) - 0.2*(rand);end% 限制物理合理范围P_center(i) = max(950, min(1010, P_center(i))); % 气压范围V_max(i) = max(10, min(60, V_max(i))); % 风速范围
end%% 可视化结果
figure('Name','台风路径模拟','Position',[100 100 1000 600]);% 绘制底图(简化为网格)
subplot(2,2,1);
hold on; grid on;
axis equal;
xlabel('经度(度)'); ylabel('纬度(度)');
title('台风路径');% 绘制路径和当前位置
for i = 1:nsubplot(2,2,1);plot(lon(1:i), lat(1:i), 'b-', 'LineWidth',1.5); % 路径plot(lon(i), lat(i), 'ro', 'MarkerSize',8, 'LineWidth',2); % 当前位置% 绘制强度相关图表subplot(2,2,2);plot(t(1:i), V_max(1:i), 'r-', 'LineWidth',1.5);xlabel('时间(小时)'); ylabel('最大风速(m/s)');title('台风最大风速变化');grid on;subplot(2,2,3);plot(t(1:i), P_center(1:i), 'b-', 'LineWidth',1.5);xlabel('时间(小时)'); ylabel('中心气压(hPa)');title('台风中心气压变化');grid on;% 显示当前信息subplot(2,2,4);text(0.1, 0.6, ['时间: ' num2str(t(i)) '小时'], 'FontSize',12);text(0.1, 0.5, ['位置: (' num2str(lon(i),2) ',' num2str(lat(i),2) ')'], 'FontSize',12);text(0.1, 0.4, ['风速: ' num2str(V_max(i),2) 'm/s'], 'FontSize',12);text(0.1, 0.3, ['气压: ' num2str(P_center(i),3) 'hPa'], 'FontSize',12);text(0.1, 0.2, ['移速: ' num2str(speed(i),2) 'km/h'], 'FontSize',12);text(0.1, 0.1, ['方向: ' num2str(direction(i),0) '度'], 'FontSize',12);axis off;drawnow; % 实时更新图形pause(0.1); % 控制动画速度
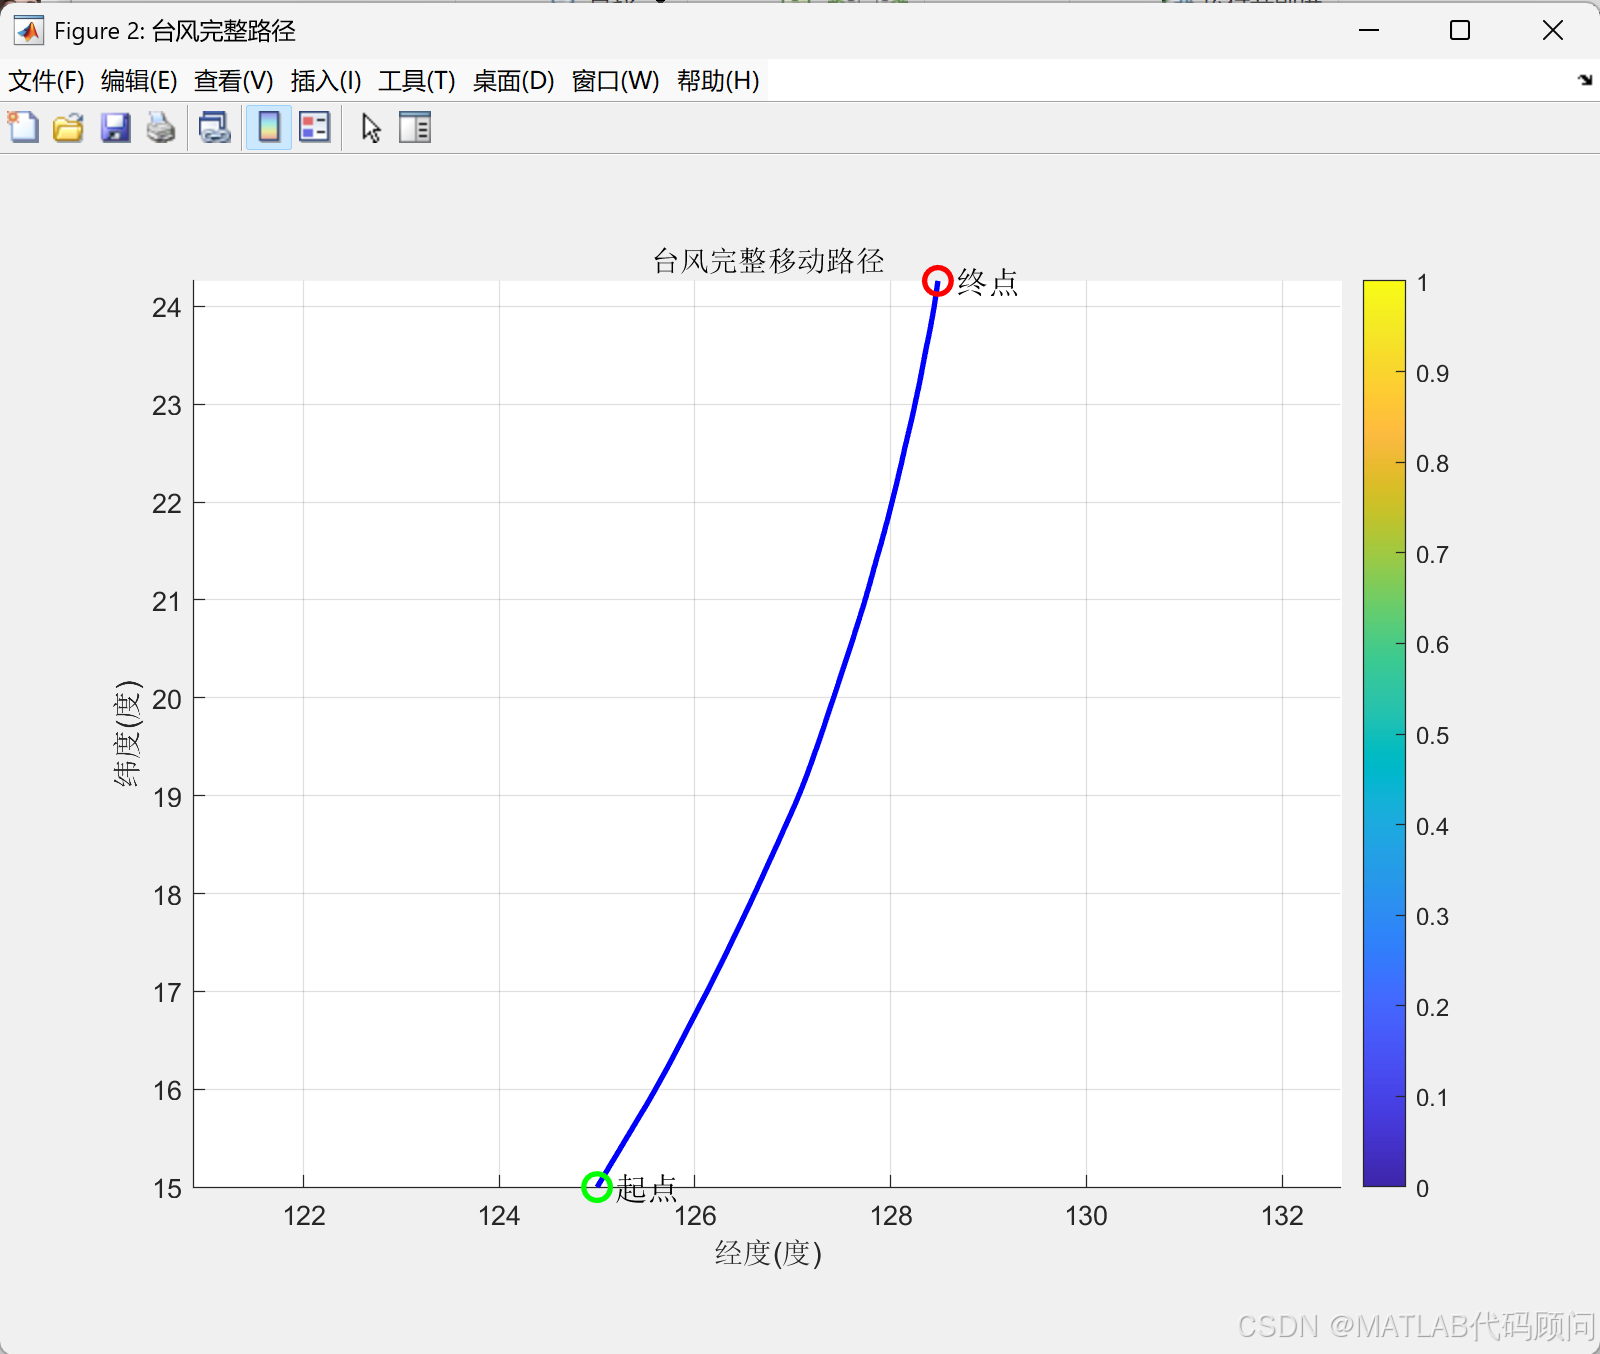
end% 绘制最终完整路径图
figure('Name','台风完整路径','Position',[200 200 800 600]);
hold on; grid on;
axis equal;
plot(lon, lat, 'b-', 'LineWidth',2);
plot(lon(1), lat(1), 'go', 'MarkerSize',10, 'LineWidth',2); % 起点
plot(lon(end), lat(end), 'ro', 'MarkerSize',10, 'LineWidth',2); % 终点
text(lon(1), lat(1), ' 起点','FontSize',12);
text(lon(end), lat(end), ' 终点','FontSize',12);
xlabel('经度(度)'); ylabel('纬度(度)');
title('台风完整移动路径');
colorbar;% 绘制强度参数完整变化图
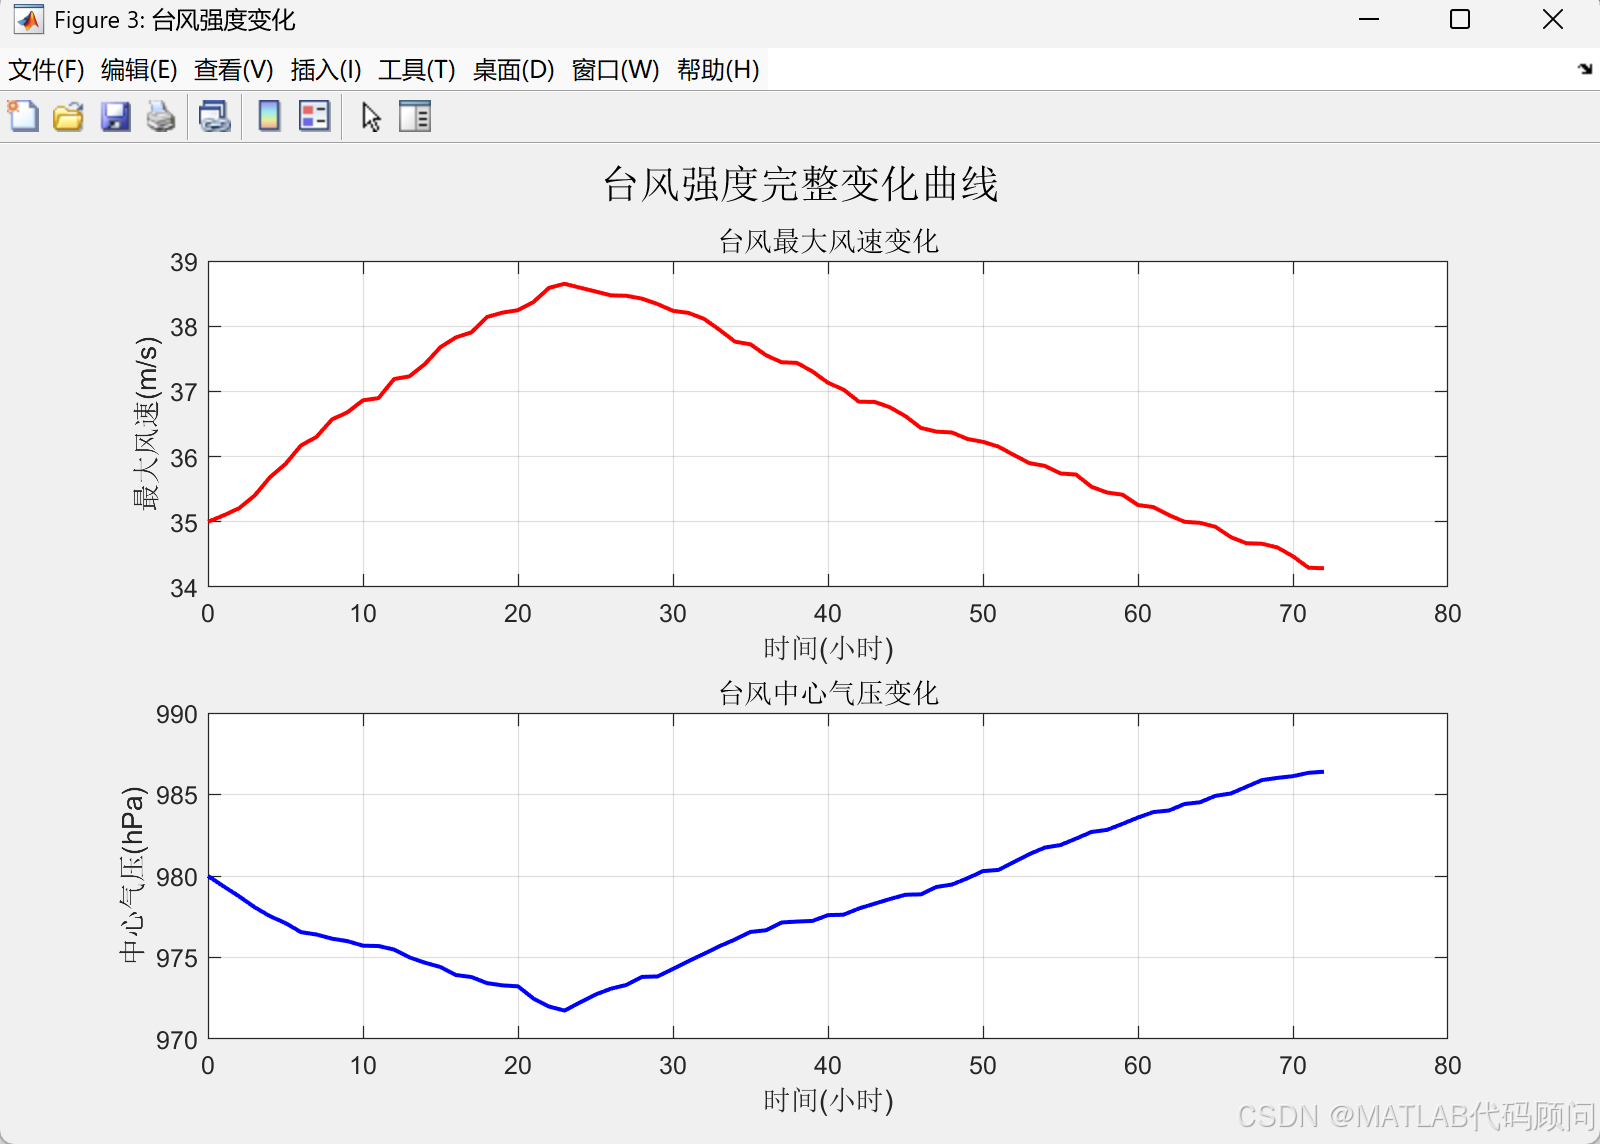
figure('Name','台风强度变化','Position',[300 300 800 500]);
subplot(2,1,1);
plot(t, V_max, 'r-', 'LineWidth',1.5);
xlabel('时间(小时)'); ylabel('最大风速(m/s)');
title('台风最大风速变化');
grid on;subplot(2,1,2);
plot(t, P_center, 'b-', 'LineWidth',1.5);
xlabel('时间(小时)'); ylabel('中心气压(hPa)');
title('台风中心气压变化');
grid on;sgtitle('台风强度完整变化曲线');