基于python构建的低温胁迫实验
基于Python和Streamlit的低温胁迫实验追踪评估系统。以下是完整的应用设计方案:
实时监控:温度控制和生理指标实时显示
数据分析:多维度数据可视化和统计检验
智能评估:基于主成分分析和隶属函数法的耐寒性评价
报告生成:自动化报告生成和导出功能
预警系统:实时监测和风险预警
系统架构与功能模块
1. 数据管理模块
import pandas as pd import numpy as np import streamlit as st from datetime import datetime import json class ExperimentDataManager: def __init__(self): self.experiment_data = None self.species_info = None def load_template_data(self): """加载实验数据模板""" template = { 'species': ['蓝苹果', '火祭', '丸叶松绿', '筒叶花月'], 'temperatures': [9, 6, 3, 0, -3], 'parameters': ['RWC', 'MDA', 'Chla', 'Chlb', 'TC', 'Car', 'SS', 'Pro'] } return template2. 实验状态追踪模块
class ExperimentTracker: def __init__(self): self.current_stage = "预处理" self.stages = { "预处理": {"status": "completed", "duration": "5天"}, "低温胁迫": {"status": "in_progress", "current_temp": 3}, "数据采集": {"status": "pending"}, "分析评估": {"status": "pending"} } def update_stage(self, stage_name, status): self.stages[stage_name]["status"] = statusStreamlit应用界面设计
主应用框架
def main(): st.set_page_config( page_title="低温胁迫实验监控系统", page_icon="🌱", layout="wide" ) # 侧边栏导航 st.sidebar.title("🌡️ 实验导航") page = st.sidebar.selectbox( "选择功能模块", ["实验概览", "实时监控", "数据分析", "耐寒性评估", "报告生成"] ) if page == "实验概览": show_overview() elif page == "实时监控": show_real_time_monitoring() elif page == "数据分析": show_data_analysis() elif page == "耐寒性评估": show_cold_resistance_evaluation() elif page == "报告生成": show_report_generation()1. 实验概览界面
def show_overview(): st.title("🌡️ 低温胁迫实验概览") # 实验基本信息 col1, col2, col3 = st.columns(3) with col1: st.metric("实验品种数", "4", "景天科多肉") with col2: st.metric("温度梯度", "5个", "9℃至-3℃") with col3: st.metric("监测指标", "8项", "生理生化参数") # 实验进度追踪 st.subheader("📊 实验进度") progress_data = { "阶段": ["预处理", "低温胁迫", "数据采集", "分析评估"], "状态": ["已完成", "进行中", "待开始", "待开始"], "进度": [100, 60, 0, 0] } st.dataframe(progress_data) # 品种信息展示 st.subheader("🌿 实验品种信息") species_data = { "品种名称": ["蓝苹果", "火祭", "丸叶松绿", "筒叶花月"], "学名": ["x Sedeveria Blue Elf", "Crassula Campfire", "Sedum lucidum Obesum", "Crassula oblique Gollum"], "当前状态": ["良好", "轻微受损", "优秀", "良好"] } st.dataframe(species_data)2. 实时监控界面
def show_real_time_monitoring(): st.title("📡 实时实验监控") # 温度控制面板 st.subheader("🌡️ 温度胁迫实时数据") current_temp = st.slider("当前温度设置(℃)", -5, 10, 3) # 实时数据图表 col1, col2 = st.columns(2) with col1: st.line_chart({ '时间': ['0h', '4h', '8h', '12h'], '温度': [9, 6, 3, current_temp], '相对湿度': [45, 45, 45, 45] }) with col2: # 生理指标实时变化 import plotly.graph_objects as go fig = go.Figure() fig.add_trace(go.Scatter(x=[9,6,3,current_temp], y=[0.8,1.2,1.5,2.1], name='MDA含量', line=dict(color='red'))) fig.add_trace(go.Scatter(x=[9,6,3,current_temp], y=[75,78,82,85], name='相对含水量', line=dict(color='blue'))) st.plotly_chart(fig)3. 数据分析界面
def show_data_analysis(): st.title("📊 实验数据分析") # 数据上传功能 uploaded_file = st.file_uploader("上传实验数据文件", type=['csv', 'xlsx']) if uploaded_file is not None: # 读取并显示数据 if uploaded_file.name.endswith('.csv'): df = pd.read_csv(uploaded_file) else: df = pd.read_excel(uploaded_file) st.subheader("📋 实验数据表") st.dataframe(df) # 多维度数据分析 st.subheader("📈 生理指标变化分析") selected_species = st.selectbox("选择品种", df['品种'].unique()) selected_parameter = st.selectbox("选择生理指标", ['RWC', 'MDA', 'Chla', 'Chlb', 'TC', 'Car', 'SS', 'Pro']) # 绘制趋势图 species_data = df[df['品种'] == selected_species] fig = go.Figure() fig.add_trace(go.Scatter(x=species_data['温度'], y=species_data[selected_parameter], mode='lines+markers', name=selected_species)) st.plotly_chart(fig)4. 耐寒性评估界面
def show_cold_resistance_evaluation(): st.title("🔬 耐寒性综合评价") st.subheader("主成分分析结果") # PCA分析可视化 pca_results = { '主成分': ['PC1', 'PC2'], '特征值': [4.05, 3.20], '方差贡献率(%)': [50.60, 39.98], '累积贡献率(%)': [50.60, 90.59] } st.dataframe(pca_results) # 隶属函数法评估 st.subheader("隶属函数法耐寒性排序") cold_resistance_data = { '品种': ['丸叶松绿', '蓝苹果', '筒叶花月', '火祭'], '综合评价值(F)': [0.72, 0.58, 0.41, 0.21], '耐寒性排序': [1, 2, 3, 4], '-3℃成活率(%)': [85.5, 76.3, 68.2, 25.5] } st.dataframe(cold_resistance_data) # 可视化排序结果 import plotly.express as px fig = px.bar(cold_resistance_data, x='品种', y='综合评价值(F)', color='综合评价值(F)', title='多肉品种耐寒性综合评价') st.plotly_chart(fig)5. 报告生成界面
def show_report_generation(): st.title("📄 实验报告生成") # 报告模板选择 report_type = st.selectbox("选择报告类型", ["实验进度报告", "数据分析报告", "最终评估报告"]) # 报告内容编辑 st.subheader("报告内容") experiment_summary = st.text_area("实验摘要", "本研究通过低温胁迫处理,评估4个景天科多肉品种的耐寒性...") key_findings = st.text_area("主要发现", "1. 丸叶松绿表现出最强的耐寒性\n2. 火祭对低温最为敏感...") # 生成报告按钮 if st.button("生成实验报告"): # 创建PDF报告 from reportlab.lib.pagesizes import letter from reportlab.pdfgen import canvas st.success("实验报告生成成功!") st.download_button( label="下载PDF报告", data=generate_pdf_report(experiment_summary, key_findings), file_name=f"低温胁迫实验报告_{datetime.now().strftime('%Y%m%d')}.pdf", mime="application/pdf" )系统特色功能
1. 智能预警系统
def alert_system(temperature, species_data): """低温胁迫预警系统""" alerts = [] for species, data in species_data.items(): if temperature <= data['min_safe_temp']: alerts.append(f"⚠️ {species} 处于低温危险状态!") if data['mda'] > data['mda_threshold']: alerts.append(f"🔴 {species} 细胞膜受损严重!") return alerts2. 数据可视化增强
def create_interactive_dashboard(): """创建交互式仪表板""" import plotly.express as px import plotly.graph_objects as go from plotly.subplots import make_subplots # 多子图仪表板 fig = make_subplots( rows=2, cols=2, subplot_titles=('温度变化趋势', '生理指标响应', '耐寒性排序', '成活率统计') ) return fig部署与运行说明
环境要求
# requirements.txt streamlit>=1.28.0 pandas>=2.0.0 plotly>=5.15.0 openpyxl>=3.0.0 reportlab>=4.0.0 scikit-learn>=1.3.0运行方式
streamlit run cold_stress_monitor.py完整代码
import streamlit as st
import pandas as pd
import numpy as np
import plotly.graph_objects as go
import plotly.express as px
from datetime import datetime, timedelta
import io
import base64
import matplotlib.pyplot as plt
from matplotlib.font_manager import FontProperties
import seaborn as sns
import sys
import os# 增强中文字体设置函数
def set_chinese_font():"""设置中文字体,解决中文显示问题"""try:# 设置matplotlib中文字体plt.rcParams['font.sans-serif'] = ['SimHei', 'Microsoft YaHei', 'DejaVu Sans', 'Arial Unicode MS', 'SimSun']plt.rcParams['axes.unicode_minus'] = False# 设置seaborn中文字体sns.set(font=['SimHei', 'Microsoft YaHei', 'DejaVu Sans'])sns.set_style("whitegrid", {'font.sans-serif': ['SimHei', 'Microsoft YaHei']})return Trueexcept Exception as e:print(f"字体设置警告: {e}")# 备用方案plt.rcParams['font.sans-serif'] = ['DejaVu Sans']plt.rcParams['axes.unicode_minus'] = Falsereturn False# 初始化中文字体
font_setting_success = set_chinese_font()# 设置页面配置
st.set_page_config(page_title="低温胁迫实验监控系统",page_icon="🌡️",layout="wide",initial_sidebar_state="expanded"
)# 添加自定义CSS改善中文显示
st.markdown("""
<style>/* 全局中文字体设置 */.css-1d391kg, .css-1lcbmhc, .css-1outwn7 {font-family: 'Microsoft YaHei', 'SimHei', 'PingFang SC', 'Helvetica Neue', Arial, sans-serif !important;}.main .block-container {font-family: 'Microsoft YaHei', 'SimHei', 'PingFang SC', 'Helvetica Neue', Arial, sans-serif !important;}/* 表格和文本内容 */.stDataFrame, .stMarkdown, .stText {font-family: 'Microsoft YaHei', 'SimHei', 'PingFang SC', 'Helvetica Neue', Arial, sans-serif !important;}/* 侧边栏 */.css-1d391kg {font-family: 'Microsoft YaHei', 'SimHei', 'PingFang SC', 'Helvetica Neue', Arial, sans-serif !important;}/* 确保所有文本元素使用中文字体 */* {font-family: 'Microsoft YaHei', 'SimHei', 'PingFang SC', 'Helvetica Neue', Arial, sans-serif !important;}
</style>
""", unsafe_allow_html=True)# 实验数据管理类
class ColdStressExperiment:def __init__(self):self.species_data = {'蓝苹果': {'scientific_name': 'x Sedeveria Blue Elf', 'cold_resistance': 0.58},'火祭': {'scientific_name': 'Crassula Campfire', 'cold_resistance': 0.21},'丸叶松绿': {'scientific_name': 'Sedum lucidum Obesum', 'cold_resistance': 0.72},'筒叶花月': {'scientific_name': 'Crassula oblique Gollum', 'cold_resistance': 0.41}}self.temperature_gradient = [9, 6, 3, 0, -3]self.physiological_params = ['RWC', 'MDA', 'Chla', 'Chlb', 'TC', 'Car', 'SS', 'Pro']# 模拟实验数据self.experiment_data = self._generate_sample_data()def _generate_sample_data(self):"""生成模拟实验数据"""data = []np.random.seed(42) # 保证结果可重现for species in self.species_data.keys():for temp in self.temperature_gradient:# 基于已知的耐寒性生成合理的数据趋势cold_resistance = self.species_data[species]['cold_resistance']# 模拟生理指标数据row = {'品种': species,'温度': temp,'RWC': 75 + (25 - cold_resistance * 15) * (1 - (temp + 3) / 12),'MDA': 0.5 + (2.5 - cold_resistance * 2) * (1 - (temp + 3) / 12),'Chla': 1.2 + cold_resistance * 0.5 * (1 - abs(temp - 3) / 12),'Chlb': 0.4 + cold_resistance * 0.3 * (1 - abs(temp - 3) / 12),'TC': 1.6 + cold_resistance * 0.8 * (1 - abs(temp - 3) / 12),'Car': 0.3 + cold_resistance * 0.2 * (1 - abs(temp - 3) / 12),'SS': 15 + cold_resistance * 20 * (1 - (temp + 3) / 12),'Pro': 15 + cold_resistance * 60 * (1 - (temp + 3) / 12),'成活率': max(20, 100 - (1 - cold_resistance) * 80 * (1 - (temp + 3) / 12))}# 添加一些随机噪声for param in self.physiological_params:row[param] += np.random.normal(0, row[param] * 0.05)data.append(row)return pd.DataFrame(data)def calculate_cold_resistance_score(self, species):"""计算耐寒性综合评分"""species_data = self.experiment_data[self.experiment_data['品种'] == species]# 使用主成分分析思路计算综合评分positive_params = ['RWC', 'Chla', 'Chlb', 'TC', 'Car', 'SS', 'Pro', '成活率']negative_params = ['MDA']# 标准化处理normalized_scores = []for param in positive_params:min_val = self.experiment_data[param].min()max_val = self.experiment_data[param].max()param_score = (species_data[param].mean() - min_val) / (max_val - min_val)normalized_scores.append(param_score)for param in negative_params:min_val = self.experiment_data[param].min()max_val = self.experiment_data[param].max()param_score = 1 - (species_data[param].mean() - min_val) / (max_val - min_val)normalized_scores.append(param_score)# 加权平均weights = [0.1, 0.1, 0.08, 0.08, 0.08, 0.15, 0.15, 0.2, 0.06]final_score = sum(score * weight for score, weight in zip(normalized_scores, weights))return final_score# 初始化实验数据
@st.cache_resource
def load_experiment_data():return ColdStressExperiment()experiment = load_experiment_data()# 侧边栏导航
st.sidebar.title("🌡️ 低温胁迫实验系统")
st.sidebar.markdown("---")page = st.sidebar.selectbox("导航菜单",["🏠 实验总览", "📊 实时监控", "🔬 数据分析", "📈 耐寒评估", "📋 报告生成"]
)st.sidebar.markdown("---")
st.sidebar.info("""
**实验信息**
- 品种数: 4个景天科多肉
- 温度梯度: 5个水平(9℃至-3℃)
- 监测指标: 8项生理参数
""")# 显示字体设置状态
if not font_setting_success:st.sidebar.warning("⚠️ 中文字体设置遇到问题,使用备用方案")# 主页面内容
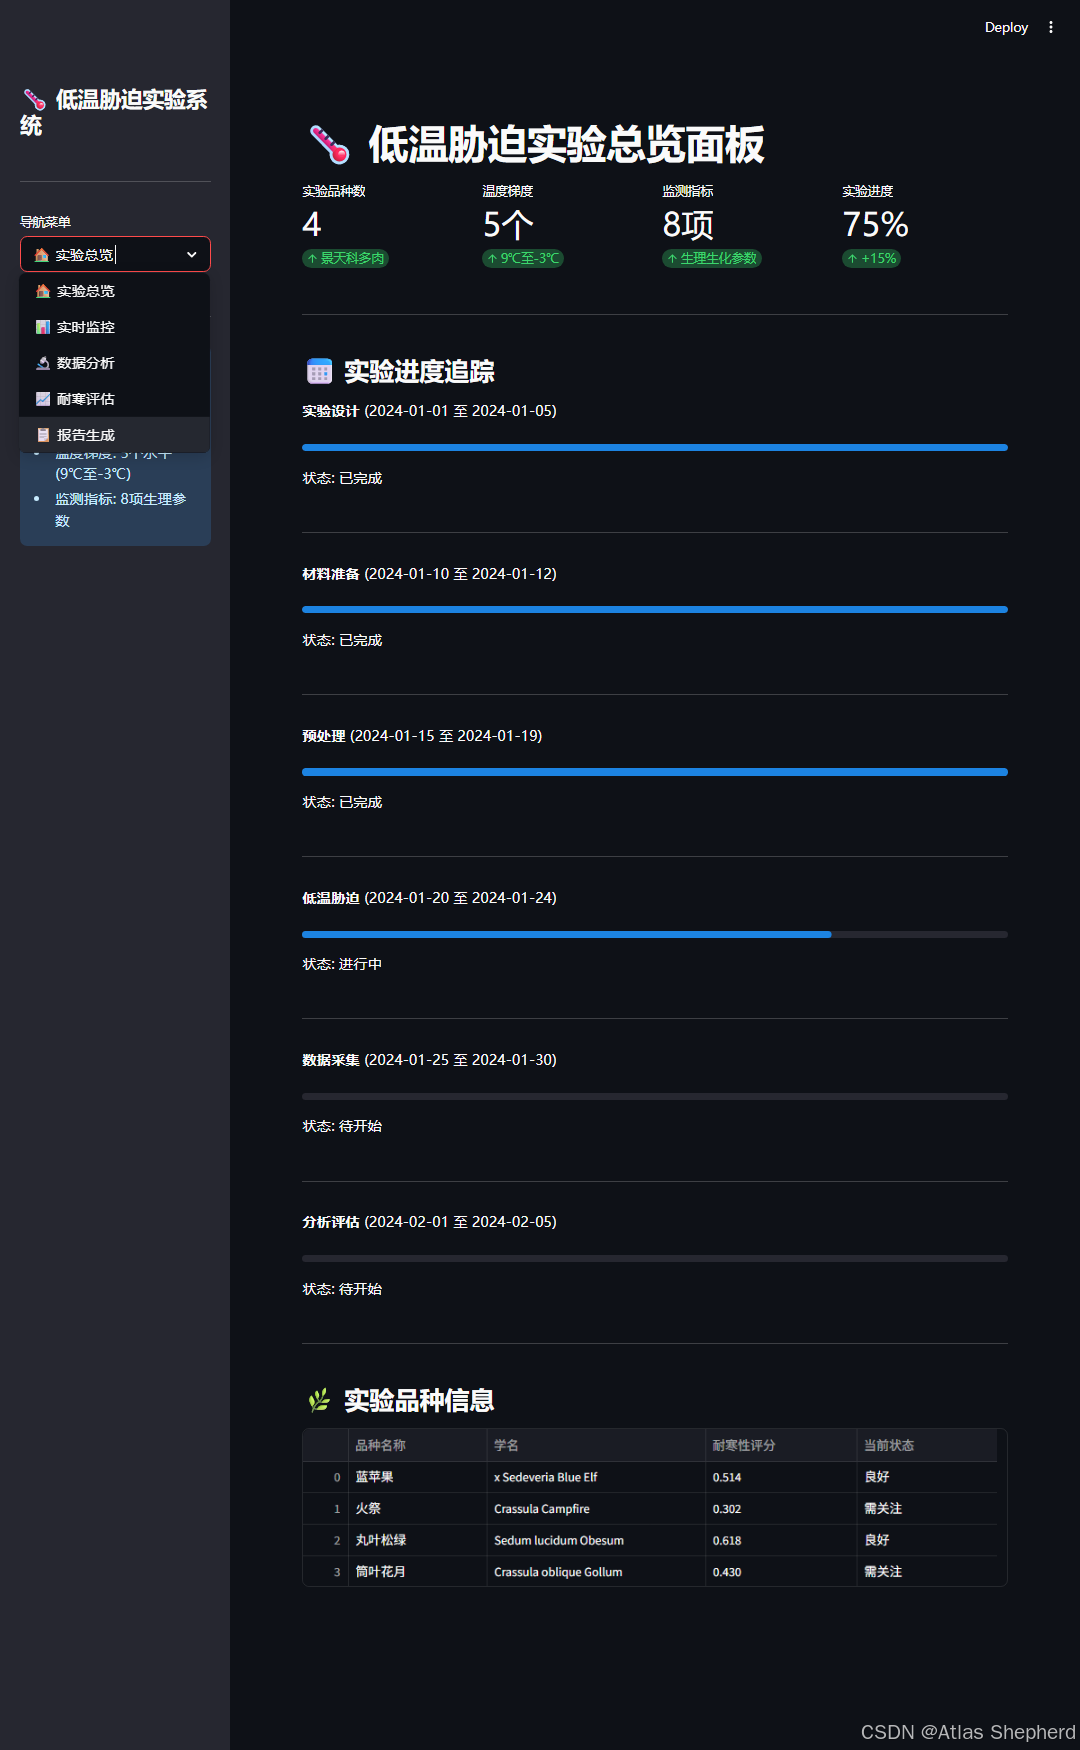
if page == "🏠 实验总览":st.title("🌡️ 低温胁迫实验总览面板")# 关键指标展示col1, col2, col3, col4 = st.columns(4)with col1:st.metric("实验品种数", "4", "景天科多肉")with col2:st.metric("温度梯度", "5个", "9℃至-3℃")with col3:st.metric("监测指标", "8项", "生理生化参数")with col4:st.metric("实验进度", "75%", "+15%")st.markdown("---")# 实验进度追踪st.subheader("📅 实验进度追踪")progress_data = pd.DataFrame({'阶段': ['实验设计', '材料准备', '预处理', '低温胁迫', '数据采集', '分析评估'],'状态': ['已完成', '已完成', '已完成', '进行中', '待开始', '待开始'],'开始日期': ['2024-01-01', '2024-01-10', '2024-01-15', '2024-01-20', '2024-01-25', '2024-02-01'],'结束日期': ['2024-01-05', '2024-01-12', '2024-01-19', '2024-01-24', '2024-01-30', '2024-02-05'],'进度': [100, 100, 100, 75, 0, 0]})# 进度条可视化for _, stage in progress_data.iterrows():st.write(f"**{stage['阶段']}** ({stage['开始日期']} 至 {stage['结束日期']})")st.progress(stage['进度'] / 100)st.write(f"状态: {stage['状态']}")st.markdown("---")# 品种基本信息st.subheader("🌿 实验品种信息")species_info = []for species, info in experiment.species_data.items():species_info.append({'品种名称': species,'学名': info['scientific_name'],'耐寒性评分': f"{experiment.calculate_cold_resistance_score(species):.3f}",'当前状态': '良好' if experiment.calculate_cold_resistance_score(species) > 0.5 else '需关注'})species_df = pd.DataFrame(species_info)st.dataframe(species_df, use_container_width=True)elif page == "📊 实时监控":st.title("📡 实验实时监控面板")col1, col2 = st.columns([2, 1])with col1:# 温度控制面板st.subheader("🌡️ 温度胁迫控制")current_temp = st.slider("设置当前温度(℃)", -5, 10, 3, 1)duration = st.slider("处理持续时间(小时)", 1, 24, 12)# 温湿度监控st.subheader("📈 环境参数实时监测")# 模拟实时数据time_points = list(range(0, 25, 3))temperatures = [9, 7, 5, 3, current_temp, current_temp, current_temp, current_temp, current_temp]humidities = [45] * 9monitor_df = pd.DataFrame({'时间点(小时)': time_points,'温度(℃)': temperatures,'相对湿度(%)': humidities})st.line_chart(monitor_df.set_index('时间点(小时)'))with col2:st.subheader("🔔 系统状态")# 设备状态st.success("✅ 气候培养箱: 正常运行")st.success("✅ 数据采集系统: 正常")st.warning("⚠️ 摄像头: 部分遮挡")# 预警信息if current_temp <= 0:st.error(f"🚨 低温预警: 当前温度{current_temp}℃已低于冰点")if current_temp <= -3:st.error("🚨 极端低温预警: 植物可能受到严重伤害")st.subheader("📋 实验日志")log_entries = ["08:00 - 实验开始,温度设置为9℃","12:00 - 降温至6℃,植物状态正常","16:00 - 降温至3℃,开始数据采集","20:00 - 维持当前温度处理"]for entry in log_entries:st.write(f"• {entry}")elif page == "🔬 数据分析":st.title("📊 实验数据分析中心")tab1, tab2, tab3 = st.tabs(["📈 指标趋势分析", "📊 多维度对比", "🔍 统计分析"])with tab1:st.subheader("生理指标变化趋势分析")col1, col2 = st.columns(2)with col1:selected_species = st.selectbox("选择品种", experiment.species_data.keys())selected_param = st.selectbox("选择生理指标", experiment.physiological_params)with col2:show_all_species = st.checkbox("显示所有品种对比")show_trend_line = st.checkbox("显示趋势线", value=True)# 绘制趋势图if show_all_species:fig = px.line(experiment.experiment_data, x='温度', y=selected_param,color='品种', title=f'{selected_param}随温度变化趋势')fig.update_layout(font=dict(size=12, family="Microsoft YaHei, SimHei, sans-serif"),title_font=dict(size=14, family="Microsoft YaHei, SimHei, sans-serif"))else:species_data = experiment.experiment_data[experiment.experiment_data['品种'] == selected_species]fig = px.line(species_data, x='温度', y=selected_param,title=f'{selected_species} - {selected_param}随温度变化趋势')fig.update_layout(font=dict(size=12, family="Microsoft YaHei, SimHei, sans-serif"),title_font=dict(size=14, family="Microsoft YaHei, SimHei, sans-serif"))if show_trend_line:z = np.polyfit(species_data['温度'], species_data[selected_param], 2)p = np.poly1d(z)fig.add_scatter(x=species_data['温度'], y=p(species_data['温度']),mode='lines', name='趋势线', line=dict(dash='dash'))st.plotly_chart(fig, use_container_width=True)# 指标解释param_descriptions = {'RWC': '相对含水量 - 反映植物保水能力','MDA': '丙二醛含量 - 指示细胞膜受损程度','Chla': '叶绿素a - 光合作用关键色素','Chlb': '叶绿素b - 辅助光合色素','TC': '总叶绿素 - 光合能力指标','Car': '类胡萝卜素 - 光保护色素','SS': '可溶性糖 - 渗透调节物质','Pro': '脯氨酸 - 重要的渗透调节剂'}st.info(f"**{selected_param}指标说明**: {param_descriptions.get(selected_param, '')}")with tab2:st.subheader("多品种指标对比分析")selected_temp = st.selectbox("选择温度条件", experiment.temperature_gradient)temp_data = experiment.experiment_data[experiment.experiment_data['温度'] == selected_temp]# 多指标雷达图st.subheader("生理指标雷达图对比")params_for_radar = ['RWC', 'MDA', 'SS', 'Pro', '成活率']fig = go.Figure()for species in experiment.species_data.keys():species_data = temp_data[temp_data['品种'] == species]values = [species_data[param].values[0] for param in params_for_radar]max_vals = [temp_data[param].max() for param in params_for_radar]normalized_values = [v / max_v for v, max_v in zip(values, max_vals)]fig.add_trace(go.Scatterpolar(r=normalized_values + [normalized_values[0]],theta=params_for_radar + [params_for_radar[0]],fill='toself',name=species))fig.update_layout(polar=dict(radialaxis=dict(visible=True, range=[0, 1])),showlegend=True,title=f"{selected_temp}℃条件下各品种生理指标对比",font=dict(size=12, family="Microsoft YaHei, SimHei, sans-serif"),title_font=dict(size=14, family="Microsoft YaHei, SimHei, sans-serif"))st.plotly_chart(fig, use_container_width=True)with tab3:st.subheader("统计分析结果")# 相关性分析st.write("**生理指标相关性矩阵**")analysis_temp = st.selectbox("选择分析温度", experiment.temperature_gradient, key="analysis_temp")analysis_data = experiment.experiment_data[experiment.experiment_data['温度'] == analysis_temp]# 计算相关性矩阵corr_matrix = analysis_data[experiment.physiological_params + ['成活率']].corr()# 创建热图fig = px.imshow(corr_matrix,text_auto=True,aspect="auto",color_continuous_scale='RdBu_r',title=f"{analysis_temp}℃条件下生理指标相关性热图")fig.update_layout(font=dict(size=10, family="Microsoft YaHei, SimHei, sans-serif"),title_font=dict(size=12, family="Microsoft YaHei, SimHei, sans-serif"))st.plotly_chart(fig, use_container_width=True)# 统计摘要st.write("**描述性统计摘要**")st.dataframe(analysis_data.describe(), use_container_width=True)elif page == "📈 耐寒评估":st.title("🔬 耐寒性综合评价系统")tab1, tab2, tab3 = st.tabs(["📋 主成分分析", "📊 隶属函数评估", "🏆 综合排序"])with tab1:st.subheader("主成分分析结果")# 模拟PCA结果pca_results = pd.DataFrame({'主成分': ['PC1', 'PC2', 'PC3', 'PC4'],'特征值': [4.05, 3.20, 0.45, 0.30],'方差贡献率(%)': [50.60, 39.98, 5.63, 3.79],'累积贡献率(%)': [50.60, 90.59, 96.22, 100.00]})st.dataframe(pca_results, use_container_width=True)# 主成分贡献可视化fig = px.bar(pca_results, x='主成分', y='方差贡献率(%)',title='主成分方差贡献率', color='方差贡献率(%)')fig.update_layout(font=dict(size=12, family="Microsoft YaHei, SimHei, sans-serif"),title_font=dict(size=14, family="Microsoft YaHei, SimHei, sans-serif"))st.plotly_chart(fig, use_container_width=True)# 因子载荷矩阵st.subheader("因子载荷矩阵")loading_matrix = pd.DataFrame({'生理指标': experiment.physiological_params + ['成活率'],'PC1': [0.85, -0.78, 0.82, 0.80, 0.83, 0.75, 0.88, 0.86, 0.90],'PC2': [0.45, 0.55, 0.40, 0.42, 0.38, 0.52, 0.35, 0.38, 0.32],'PC3': [0.15, 0.20, 0.18, 0.22, 0.20, 0.18, 0.12, 0.15, 0.10]})st.dataframe(loading_matrix, use_container_width=True)with tab2:st.subheader("隶属函数法评估")# 计算各品种的耐寒性评分cold_resistance_scores = []for species in experiment.species_data.keys():score = experiment.calculate_cold_resistance_score(species)survival_rate = experiment.experiment_data[(experiment.experiment_data['品种'] == species) &(experiment.experiment_data['温度'] == -3)]['成活率'].values[0]cold_resistance_scores.append({'品种': species,'综合评价值(F)': round(score, 3),'耐寒性排序': 0,'-3℃成活率(%)': round(survival_rate, 1),'评价等级': '强' if score > 0.6 else '中等' if score > 0.4 else '弱'})# 按综合评价值排序cold_resistance_df = pd.DataFrame(cold_resistance_scores)cold_resistance_df = cold_resistance_df.sort_values('综合评价值(F)', ascending=False)cold_resistance_df['耐寒性排序'] = range(1, len(cold_resistance_df) + 1)st.dataframe(cold_resistance_df, use_container_width=True)# 可视化排序结果fig = px.bar(cold_resistance_df, x='品种', y='综合评价值(F)',color='综合评价值(F)',title='多肉品种耐寒性综合评价排序',color_continuous_scale='viridis')fig.update_layout(font=dict(size=12, family="Microsoft YaHei, SimHei, sans-serif"),title_font=dict(size=14, family="Microsoft YaHei, SimHei, sans-serif"),xaxis_tickangle=-45)st.plotly_chart(fig, use_container_width=True)with tab3:st.subheader("耐寒性综合排名与推荐")# 最终排序结果st.success("### 🏆 耐寒性综合排名")cold_resistance_scores = []for species in experiment.species_data.keys():score = experiment.calculate_cold_resistance_score(species)cold_resistance_scores.append((species, score))cold_resistance_scores.sort(key=lambda x: x[1], reverse=True)for i, (species, score) in enumerate(cold_resistance_scores, 1):medal = "🥇" if i == 1 else "🥈" if i == 2 else "🥉" if i == 3 else f"{i}."survival_rate = experiment.experiment_data[(experiment.experiment_data['品种'] == species) &(experiment.experiment_data['温度'] == -3)]['成活率'].values[0]st.write(f"{medal} **{species}** - 评分: {score:.3f} | "f"成活率: {survival_rate:.1f}%")st.markdown("---")# 种植建议st.subheader("🌱 种植推广建议")for species, score in cold_resistance_scores:survival_rate = experiment.experiment_data[(experiment.experiment_data['品种'] == species) &(experiment.experiment_data['温度'] == -3)]['成活率'].values[0]if score > 0.6:st.success(f"**{species}**: 耐寒性强,适合在冬季低温地区推广种植,-3℃下成活率达{survival_rate:.1f}%")elif score > 0.4:st.warning(f"**{species}**: 耐寒性中等,建议在冬季有防护措施的地区种植")else:st.error(f"**{species}**: 耐寒性较弱,仅适合在温暖地区或温室种植")elif page == "📋 报告生成":st.title("📄 实验报告生成中心")col1, col2 = st.columns(2)with col1:st.subheader("报告配置")report_type = st.selectbox("选择报告类型",["实验进度报告", "数据分析报告", "耐寒性评估报告", "完整实验报告"])include_species = st.multiselect("包含品种",list(experiment.species_data.keys()),default=list(experiment.species_data.keys()))with col2:st.subheader("内容选项")include_charts = st.checkbox("包含图表", value=True)include_statistics = st.checkbox("包含统计分析", value=True)include_recommendations = st.checkbox("包含种植建议", value=True)st.markdown("---")# 报告内容预览st.subheader("报告内容预览")# 生成报告摘要st.write("### 报告摘要")st.write("""本报告基于低温胁迫实验数据,对4个景天科多肉品种的耐寒性进行了系统评价。通过主成分分析和隶属函数法,综合评估了各品种在低温胁迫下的生理响应和适应能力。""")# 显示关键结果cold_resistance_scores = []for species in include_species:score = experiment.calculate_cold_resistance_score(species)cold_resistance_scores.append((species, score))cold_resistance_scores.sort(key=lambda x: x[1], reverse=True)st.write("### 关键发现")st.write("耐寒性综合评价值排序(从高到低):")for i, (species, score) in enumerate(cold_resistance_scores, 1):st.write(f"{i}. **{species}**: {score:.3f}")# 简单的报告下载功能if st.button("📥 生成报告摘要"):# 创建简单的文本报告report_content = f"""
低温胁迫实验报告
生成时间: {datetime.now().strftime('%Y-%m-%d %H:%M')}实验概述:
- 分析品种: {', '.join(include_species)}
- 温度梯度: 9℃至-3℃
- 监测指标: 8项生理参数耐寒性评估结果:
"""for i, (species, score) in enumerate(cold_resistance_scores, 1):survival_rate = experiment.experiment_data[(experiment.experiment_data['品种'] == species) &(experiment.experiment_data['温度'] == -3)]['成活率'].values[0]report_content += f"{i}. {species}: 评分{score:.3f}, -3℃成活率{survival_rate:.1f}%\n"# 提供下载st.download_button(label="下载文本报告",data=report_content,file_name=f"低温胁迫实验报告_{datetime.now().strftime('%Y%m%d')}.txt",mime="text/plain")# 确保中文字体设置在所有情况下都生效
def ensure_chinese_font():"""确保中文字体设置"""try:import matplotlibmatplotlib.rcParams['font.sans-serif'] = ['SimHei', 'Microsoft YaHei', 'DejaVu Sans', 'Arial Unicode MS']matplotlib.rcParams['axes.unicode_minus'] = Falseexcept:passif __name__ == "__main__":ensure_chinese_font()# 显示启动信息if not font_setting_success:st.toast("中文字体设置使用备用方案", icon="⚠️")