你的图表太安静了!3行代码让Highcharts“开口说话“
痛点场景
作为开发者,我们经常遇到这样的需求:
用户想要点击图表元素时获得更多信息
数据大屏需要更生动的交互反馈
移动端用户希望有语音播报功能
传统的解决方案是弹窗或跳转页面,但今天我要教你用Highcharts v12.4的最新特性,让图表真正"活"起来!
核心技术
1. 事件绑定 - 让图表"听得懂"
// Highcharts v12.4 推荐的事件绑定方式
const chart = Highcharts.chart('container', {series: [{type: 'column',data: [29.9, 71.5, 106.4, 129.2, 144.0, 176.0],point: {events: {click: function() {// 这里是点击事件的核心逻辑speakData(this.category, this.y);}}}}]
});
2. 语音合成 - 让图表"说得出"
// 使用Web Speech API实现语音反馈
function speakData(category, value) {if ('speechSynthesis' in window) {const utterance = new SpeechSynthesisUtterance(`${category} 的数据是 ${value} 单位`);utterance.lang = 'zh-CN'; // 中文播报utterance.rate = 1.0;     // 语速speechSynthesis.speak(utterance);}
}
完整实战代码
<!DOCTYPE html>
<html>
<head><script src="https://code.highcharts.com/highcharts.js"></script>
</head>
<body><div id="container" style="width: 600px; height: 400px;"></div><script>// 完整实现代码document.addEventListener('DOMContentLoaded', function() {const chart = Highcharts.chart('container', {chart: {type: 'column',events: {load: function() {console.log('图表加载完成 - Highcharts v12.4');}}},title: {text: '智能语音图表演示',useHTML: true},series: [{name: '销售数据',colorByPoint: true,data: [{name: '产品A',y: 29.9,color: '#1e90ff'}, {name: '产品B', y: 71.5,color: '#2ed573'}, {name: '产品C',y: 106.4,color: '#ffa502'}],point: {events: {click: function() {// 核心交互逻辑if (this.series.chart.isVoiceEnabled) {speakData(this.name, this.y);}showCustomTooltip(this);}}}}],// Highcharts v12.4 增强的响应式配置responsive: {rules: [{condition: {maxWidth: 500},chartOptions: {legend: {layout: 'horizontal',align: 'center',verticalAlign: 'bottom'}}}]}});// 启用语音功能chart.isVoiceEnabled = true;// 语音反馈函数function speakData(name, value) {if ('speechSynthesis' in window && chart.isVoiceEnabled) {speechSynthesis.cancel(); // 停止当前播报const utterance = new SpeechSynthesisUtterance(`${name} 的销售额是 ${value} 万元`);utterance.lang = 'zh-CN';utterance.rate = 0.9;utterance.pitch = 1.2;speechSynthesis.speak(utterance);}}// 自定义提示框function showCustomTooltip(point) {const chart = point.series.chart;// 移除现有提示框if (chart.customTooltip) {chart.customTooltip.destroy();}// 创建自定义提示框chart.customTooltip = chart.renderer.label(`📊 <b>${point.name}</b><br/>✅ 数值: ${point.y}`,point.plotX + chart.plotLeft - 40,point.plotY + chart.plotTop - 60,'rect',0, 0,true).css({color: '#333',fontSize: '14px',padding: '10px',background: 'rgba(255,255,255,0.95)',border: '2px solid #1e90ff',borderRadius: '8px'}).add();}});</script>
</body>
</html>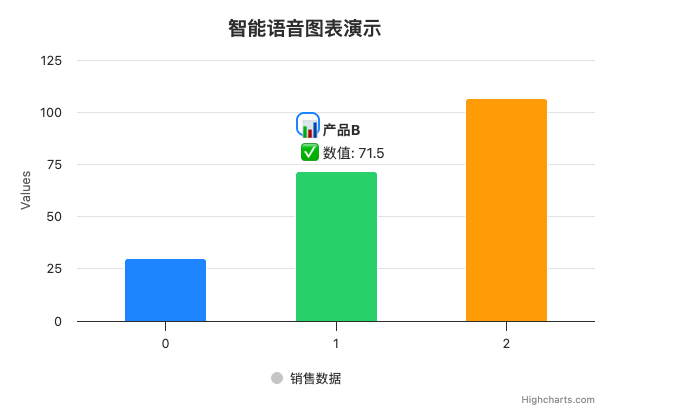
(运行代码生成以上柱状图,单击每一个柱状图发出数据声音!!!)
在这个实现中,我们充分利用了Highcharts 12.4的增强功能:
1. 更安全的事件处理
2. 改进的SVG渲染器
进阶应用
场景1:数据大屏语音播报
// 定时自动播报关键数据
setInterval(function() {const maxPoint = chart.series[0].data.reduce((a, b) => a.y > b.y ? a : b);speakData('当前最高', maxPoint.name, maxPoint.y);
}, 30000);
场景2:移动端触觉反馈
point: {events: {click: function() {// 移动端振动反馈if (navigator.vibrate) {navigator.vibrate(50);}speakData(this.name, this.y);}}
}
效果对比
| 传统图表 | 智能语音图表 |
|---|---|
| ❌ 静态展示 | ✅ 交互反馈 |
| ❌ 需要用户主动理解 | ✅ 主动语音解释 |
| ❌ 无障碍体验差 | ✅ 支持视障用户 |
| ❌ 移动端不友好 | ✅ 多模态交互 |
避坑指南
语音兼容性:
// 检测浏览器支持 const canSpeak = 'speechSynthesis' in window; if (!canSpeak) {console.warn('当前浏览器不支持语音合成'); }性能优化:
// 避免频繁创建语音实例
let currentUtterance = null;
function speak(text) {if (currentUtterance) {speechSynthesis.cancel();}currentUtterance = new SpeechSynthesisUtterance(text);speechSynthesis.speak(currentUtterance);
}
你在项目中遇到过哪些交互难题?
是否需要支持多语言语音播报?
想要实现更复杂的手势交互?
对无障碍访问有特殊需求?
欢迎在评论区分享你的场景! 我会针对高频需求推出续篇教程。