实验二-决策树-葡萄酒
# 导入所需库
import pandas as pd
import numpy as np
from sklearn.model_selection import train_test_split
from sklearn import tree
from sklearn.metrics import accuracy_score, precision_score, recall_score, f1_score
import graphviz
import matplotlib.pyplot as plt# 解决matplotlib中文显示问题
plt.rcParams['font.sans-serif'] = ['SimHei', 'Microsoft YaHei'] # 支持中文的字体列表
plt.rcParams['axes.unicode_minus'] = False # 解决负号显示异常问题# 读取葡萄酒质量数据集(需确保文件路径正确)
data = pd.read_csv("D:data\Wine_Quality_Data.csv")# 查看数据基本信息(观察数据结构、缺失值等)
print("数据前5行:")
print(data.head())
print("\n数据基本信息:")
print(data.info())
print("\n数据描述性统计:")
print(data.describe())# 数据类型转换:将颜色特征(white/red)转换为整数(0/1)
color_map = {'white': 0, 'red': 1}
data['color'] = data['color'].map(color_map).astype(int) # 用map显式映射,替换np.int为内置int# 提取特征列和标签列
# 特征列:除color外的所有列;标签列:color(预测葡萄酒颜色)
feature_cols = [x for x in data.columns if x != 'color']
feature = data[feature_cols] # 特征矩阵
target = data['color'] # 标签向量# 拆分数据集:测试集占比30%,随机种子设为42(保证结果可复现)
Xtrain, Xtest, ytrain, ytest = train_test_split(feature, target, test_size=0.3, random_state=42
)# 检查数据集分布一致性(比较训练集与测试集标签占比)
print("\n训练集标签分布(颜色:样本数):")
print(ytrain.value_counts(normalize=True)) # normalize=True显示占比
print("\n测试集标签分布(颜色:样本数):")
print(ytest.value_counts(normalize=True))# 3.1 基础模型训练与测试(无参数限制)
# 创建决策树分类器实例
dt_base = tree.DecisionTreeClassifier(random_state=42) # 设random_state确保结果稳定
# 用训练集训练模型
dt_base.fit(Xtrain, ytrain)
# 测试集预测与正确率计算
score_base = dt_base.score(Xtest, ytest)
print(f"\n基础模型测试集正确率:{score_base:.4f}")# 3.2 详细性能评估(训练集+测试集的准确率、查准率、查全率、F1值)
# 定义性能评估函数
def measure_error(y_true, y_pred, label):"""计算分类模型的4个关键指标y_true:真实标签,y_pred:预测标签,label:结果名称(如train/test)返回包含4个指标的Series"""return pd.Series({'accuracy': accuracy_score(y_true, y_pred), # 准确率'precision': precision_score(y_true, y_pred, zero_division=0), # 查准率(避免0除错误)'recall': recall_score(y_true, y_pred, zero_division=0), # 查全率'f1': f1_score(y_true, y_pred, zero_division=0) # F1值}, name=label)# 分别在训练集和测试集上预测
ytrain_pred_base = dt_base.predict(Xtrain)
ytest_pred_base = dt_base.predict(Xtest)# 整合训练集与测试集性能指标
train_test_error = pd.concat([measure_error(ytrain, ytrain_pred_base, 'train'),measure_error(ytest, ytest_pred_base, 'test')
], axis=1) # axis=1表示按列拼接print("\n训练集与测试集性能指标对比:")
print(train_test_error)# 定义中文特征名(与feature_cols顺序对应)
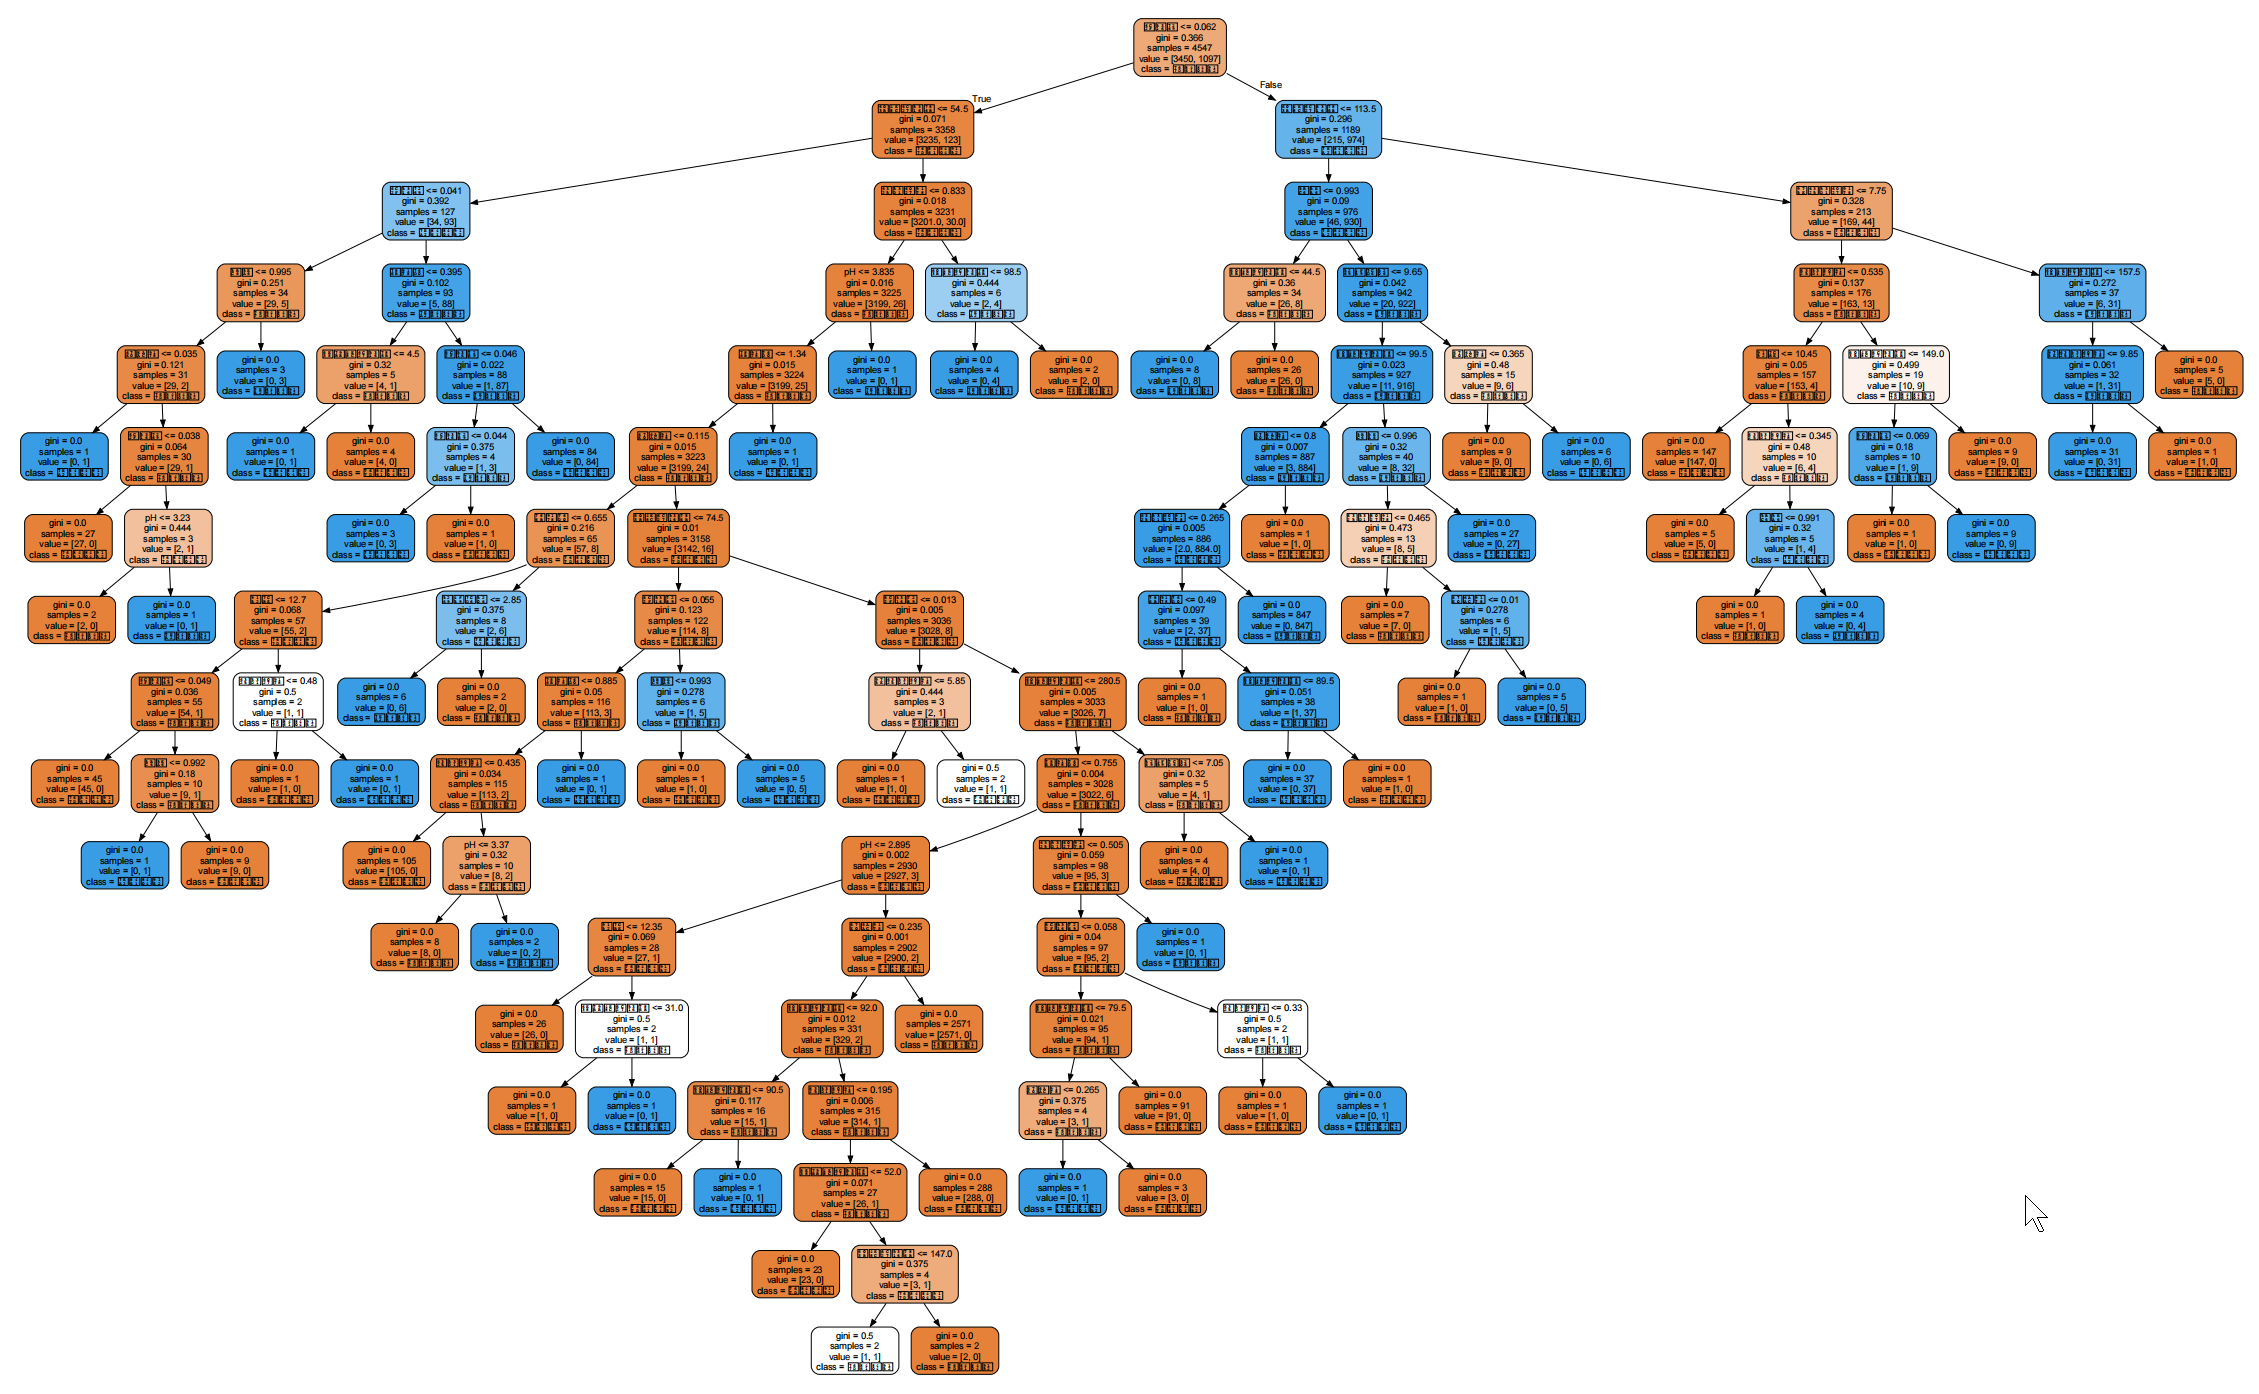
feature_name_cn = ['非挥发性酸', '挥发性酸', '柠檬酸', '剩余糖分', '氯化物','游离二氧化硫', '总二氧化硫', '密度', 'pH', '硫酸盐', '酒精', '质量'
]# 生成树状图数据
dot_data = tree.export_graphviz(dt_base, # 训练好的决策树模型feature_names=feature_name_cn, # 特征中文名称class_names=['白葡萄酒', '红葡萄酒'], # 标签中文名称(0=白,1=红)filled=True, # 节点填充颜色(按类别区分)rounded=True # 节点边框圆角
)# 绘制并显示树状图(需提前安装GraphViz,且配置环境变量)
graph = graphviz.Source(dot_data)
graph.render("wine_color_decision_tree") # 保存树状图为PDF文件
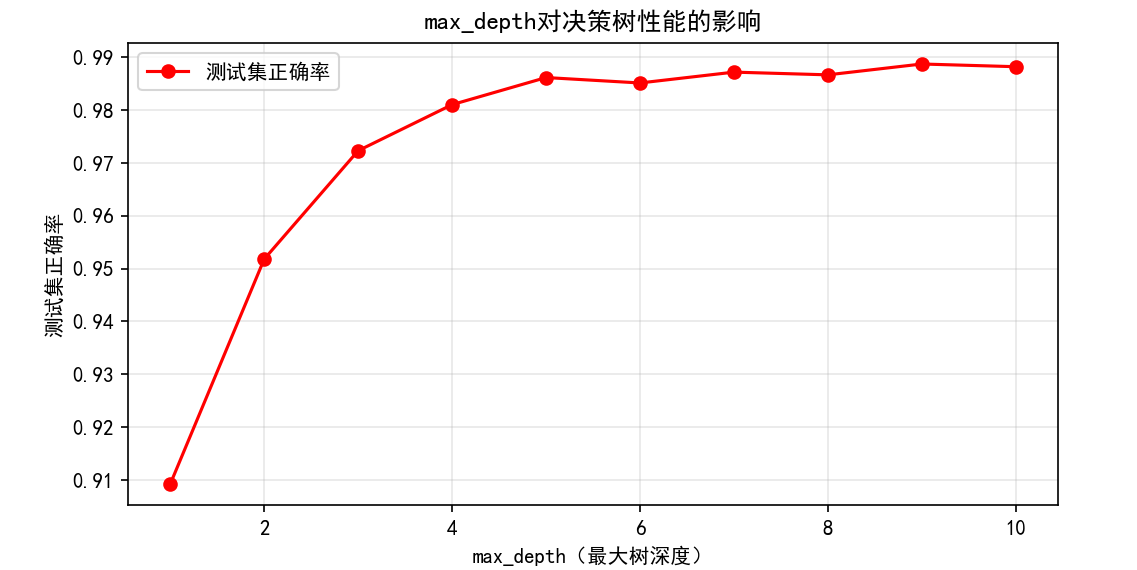
graph.view() # 打开树状图查看# 5.1 调试max_depth(最大树深度):寻找最优深度
test_scores = [] # 存储不同深度的测试集正确率
depth_range = range(1, 11) # 深度从1到10for depth in depth_range:# 构建带指定深度的决策树dt_tune = tree.DecisionTreeClassifier(max_depth=depth,criterion='entropy', # 用信息增益计算不纯度random_state=42,splitter='best' # 优先选择重要特征分枝)dt_tune.fit(Xtrain, ytrain)# 记录测试集正确率test_scores.append(dt_tune.score(Xtest, ytest))# 绘制max_depth与测试集正确率的关系图
plt.figure(figsize=(8, 4))
plt.plot(depth_range, test_scores, color='red', marker='o', label='测试集正确率')
plt.xlabel('max_depth(最大树深度)')
plt.ylabel('测试集正确率')
plt.title('max_depth对决策树性能的影响')
plt.legend()
plt.grid(True, alpha=0.3)
plt.show()# 输出最优深度及对应正确率
best_depth = depth_range[test_scores.index(max(test_scores))]
best_score = max(test_scores)
print(f"\n最优max_depth:{best_depth},对应测试集正确率:{best_score:.4f}")# 5.2 调试criterion(不纯度计算方式):对比gini与entropy
# 构建两种criterion的模型
dt_gini = tree.DecisionTreeClassifier(criterion='gini', random_state=42, max_depth=best_depth)
dt_entropy = tree.DecisionTreeClassifier(criterion='entropy', random_state=42, max_depth=best_depth)# 训练并评估
dt_gini.fit(Xtrain, ytrain)
dt_entropy.fit(Xtrain, ytrain)score_gini = dt_gini.score(Xtest, ytest)
score_entropy = dt_entropy.score(Xtest, ytest)print(f"\ncriterion='gini'的测试集正确率:{score_gini:.4f}")
print(f"criterion='entropy'的测试集正确率:{score_entropy:.4f}")
数据前5行:
fixed_acidity volatile_acidity citric_acid ... alcohol quality color
0 7.4 0.70 0.00 ... 9.4 5 red
1 7.8 0.88 0.00 ... 9.8 5 red
2 7.8 0.76 0.04 ... 9.8 5 red
3 11.2 0.28 0.56 ... 9.8 6 red
4 7.4 0.70 0.00 ... 9.4 5 red
[5 rows x 13 columns]
数据基本信息:
<class 'pandas.core.frame.DataFrame'>
RangeIndex: 6497 entries, 0 to 6496
Data columns (total 13 columns):
# Column Non-Null Count Dtype
--- ------ -------------- -----
0 fixed_acidity 6497 non-null float64
1 volatile_acidity 6497 non-null float64
2 citric_acid 6497 non-null float64
3 residual_sugar 6497 non-null float64
4 chlorides 6497 non-null float64
5 free_sulfur_dioxide 6497 non-null float64
6 total_sulfur_dioxide 6497 non-null float64
7 density 6497 non-null float64
8 pH 6497 non-null float64
9 sulphates 6497 non-null float64
10 alcohol 6497 non-null float64
11 quality 6497 non-null int64
12 color 6497 non-null object
dtypes: float64(11), int64(1), object(1)
memory usage: 660.0+ KB
None
数据描述性统计:
fixed_acidity volatile_acidity ... alcohol quality
count 6497.000000 6497.000000 ... 6497.000000 6497.000000
mean 7.215307 0.339666 ... 10.491801 5.818378
std 1.296434 0.164636 ... 1.192712 0.873255
min 3.800000 0.080000 ... 8.000000 3.000000
25% 6.400000 0.230000 ... 9.500000 5.000000
50% 7.000000 0.290000 ... 10.300000 6.000000
75% 7.700000 0.400000 ... 11.300000 6.000000
max 15.900000 1.580000 ... 14.900000 9.000000
[8 rows x 12 columns]
训练集标签分布(颜色:样本数):
color
0 0.758742
1 0.241258
Name: proportion, dtype: float64
测试集标签分布(颜色:样本数):
color
0 0.742564
1 0.257436
Name: proportion, dtype: float64
基础模型测试集正确率:0.9862
训练集与测试集性能指标对比:
train test
accuracy 0.999560 0.986154
precision 1.000000 0.975952
recall 0.998177 0.970120
f1 0.999088 0.973027