Docker(三) Docker基础前置
Docker基础前置
什么是虚拟化, 容器化?
- 物理机: 物理机就是实体计算机, 是相对于虚拟机的称呼, 物理机提供给虚拟机以硬件环境, 有时也称为“寄主”或“宿主”
- 虚拟机: 虚拟机是指通过虚拟化技术将一台计算机虚拟化为多台逻辑计算机, 使每个计算机可以有不同的OS, 并且应用程序都可以在相互独立的空间内运行而互不影响, 从而显著提高计算机的工作效率. 虚拟机是硬件层次的虚拟化
- 容器化: 容器化是虚拟化技术的一种, 是操作系统层次的虚拟化, 通过将OS内核虚拟化, 可以允许用户空间软件实例被分割成几个独立的单元在内核中运行, 每个独立的单元都是一个容器, 对每个实例的拥有者与用户来说, 他们使用的服务器程序, 看起来就像是自己专用的. docker 是现今容器技术的事实标准
把物理机比作一个庄园, 只允许一个用户居住, 花园等公共设施都是自己的;
虚拟机就像是开发商的一个楼盘, 一栋楼(物理机)中有多个住户(虚拟机), 都共享一块宅基地, 也共享电梯等基础设施.
容器相当于在 1 个房子里面, 又开辟出来一个又一个的胶囊公寓, 共享这套房子的卫生间、共享厨房、共享 WiFi, 只有衣服、电脑等私人物品是你自己的
为什么要虚拟化, 容器化?
从历史发展来看, 虚拟化和容器化的最主要目的就是资源隔离, 随着资源隔离的实现逐渐也带来了更大的收益:
- 资源利用率高
可以让一台物理机根据实际需求虚拟出不同资源比例的虚拟机, 增加了硬件资源的性价比, 可以让一台物理机充分发挥硬件性能, 避免性能过剩, 多余的资源用不出去, 降低了IT支出和管理成本.
使用这块土地的人多了, 但是成本还是原本庄园里那片土地.
-
环境标准化
由于开发环境, 测试环境, 生产环境不一致导致 有些bug 并未在开发过程中被发现. Docker 能环境标准化, 因为它把应用、依赖和配置全部封装在镜像里, 通过容器运行时提供统一的执行环境, 实现“开发环境 = 测试环境 = 生产环境”, 从而不会再出现 「这段代码在我机器上没问题啊」 这类问题. -
资源弹性伸缩
虚拟化是弹性伸缩的基础能力, 可以把物理硬件抽象成可独立管理的资源单元, 使得系统可以根据业务负载快速增减实例、动态分配资源, 用固定的物理机资源完成扩容缩; 容器化在此基础上进一步优化, 提升启动速度, 降低运维成本. -
差异化环境提供
我的服务一个依赖 Ubuntu , 一个服务依赖 CentOS , 但是没有预算购买两个物理机,这个时候容器化就能很好的提供多种不同的环境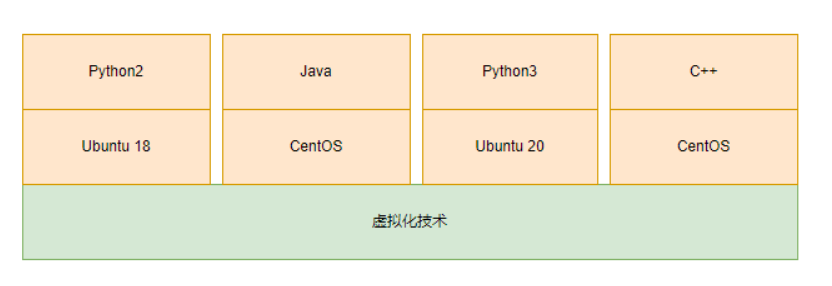
-
沙箱安全
比如我在容器里面执行 rm -rf /* 不会把整个服务器搞死, 也不影响其他人部署的程序使用 -
容器对比虚拟机更轻量,启动更快
传统的虚拟机技术启动应用服务往往需要数分钟, 而 Docker 容器应用, 由于直接运行于宿主内核, 无需启动完整的操作系统, 相当于省去了开机时间, 因此可以做到秒级、甚至毫秒级的启动时间, 大大的节约了开发、测试、部署的时间.
虚拟化实现方式
应用程序执行环境大致分为这几层:
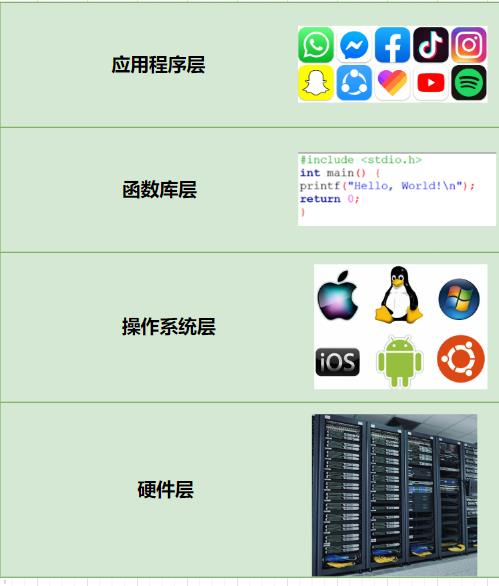
硬件层: 提供硬件抽象,包括指令集架构、硬件设备及硬件访问接口
操作系统层: 提供系统调用接口,管理硬件资源
函数库层: 提供数据结构定义及函数调用接口
虚拟化常见类别
- 虚拟机
虚拟机的虚拟化技术(Hypervisor)存在于硬件层和操作系统层之间, 虚拟机通过伪造一个硬件抽象接口, 将操作系统层及以上的层嫁接到硬件上, 实现和物理机几乎一样的功能.
根据虚拟化层是直接位于硬件之上还是在一个宿主操作系统之上, 将虚拟化划分为 Type1 和 Type2:
Type1 和 Type2 的 Hypervisor 是一种系统软件, 也称为虚拟机管理器, 它充当计算机硬件和虚拟机之间的中介, 向上, 给虚拟机OS模拟了一套硬件接口, OS只要符合这些标准接口就可以通过驱动与之交互; 向下, 则直接控制CPU、内存、磁盘、网络. 截获硬件指令并调度资源.
- Type1 的 Hypervisor 直接运行在硬件之上, 没有宿主机操作系统, Hypervisor 直接控制硬件资源和客户机, 典型框架为 Xen、 VmwareESX
- Type2 的 Hypervisor 运行在一个宿主机操作系统之上(Vmware Workstation) 或者系统里面, Hypervisor 作为宿主机操作系统中的一个应用程序, 客户机就是在宿主机操作系统上的一个进程.
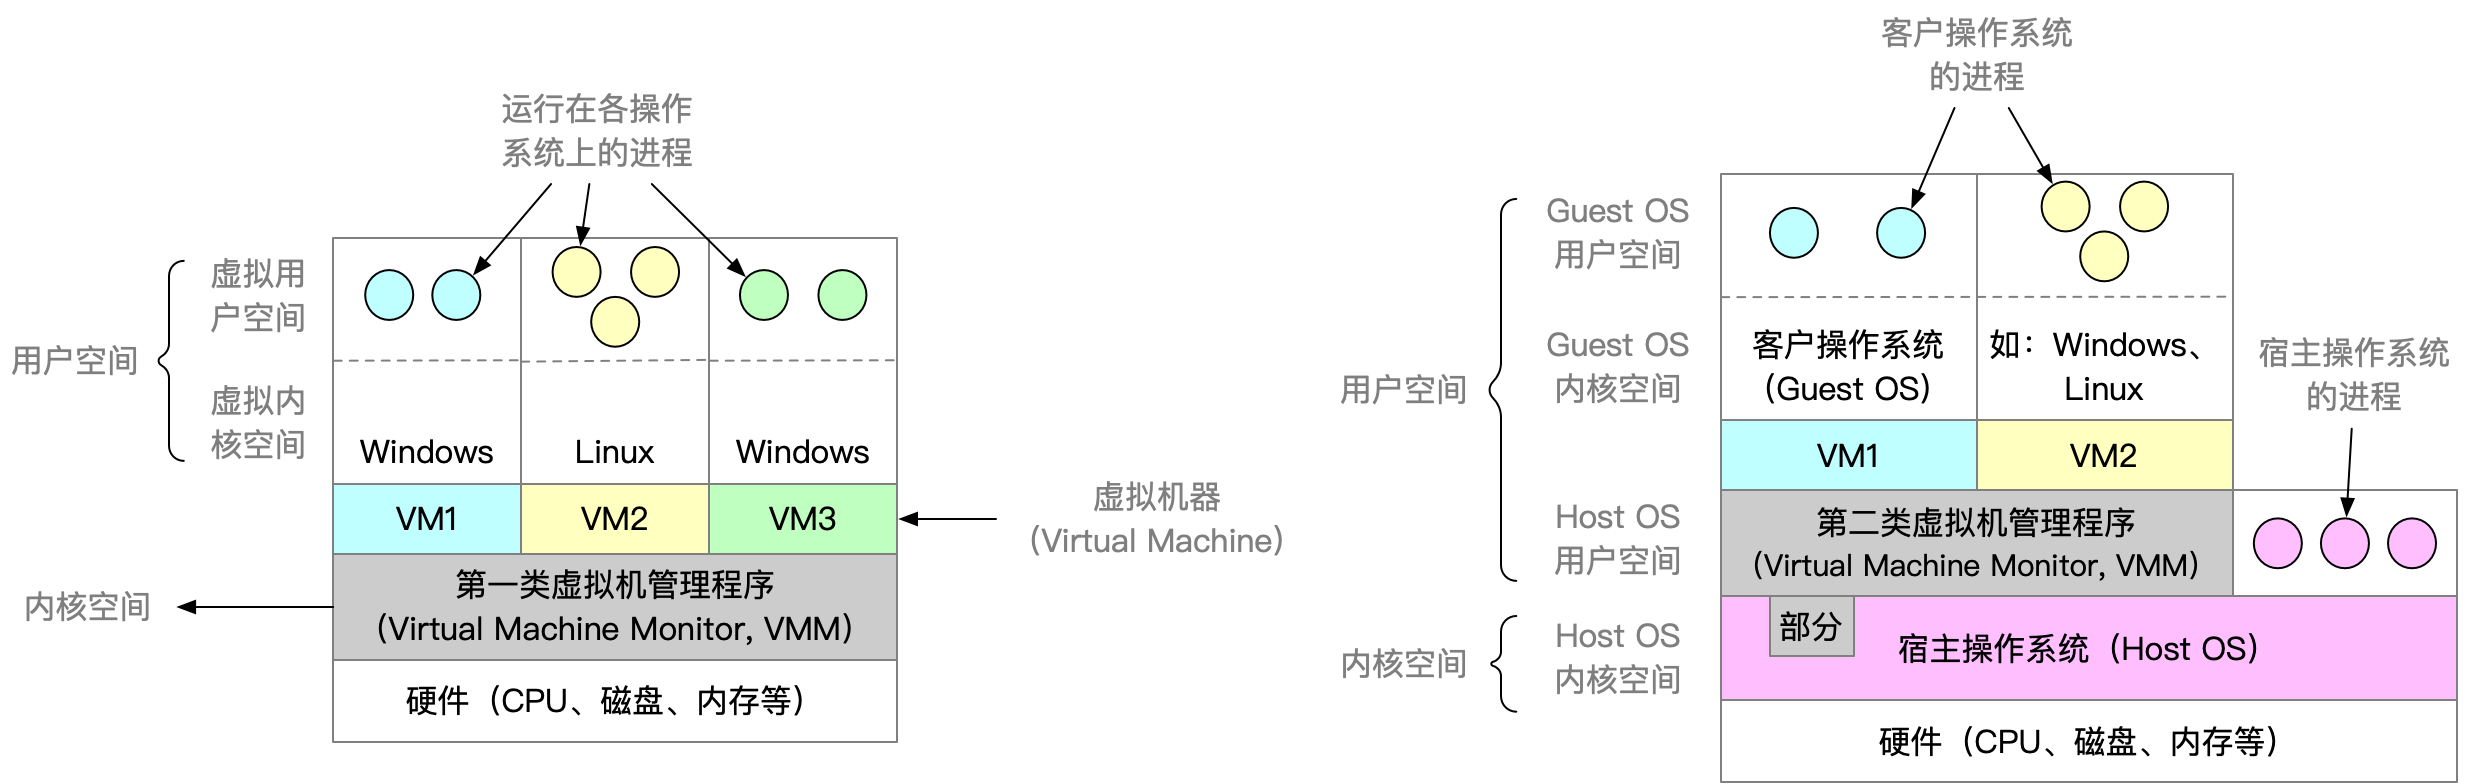
他们的主要差别在于, Type1 的 虚拟机OS 的磁盘是在物理硬盘上分配的存储空间, IO可以直接操作物理硬盘, 而且可以通过系统调用直接操作硬件; Type2 的虚拟机OS 的磁盘是, 实际上只是宿主OS的一个大文件, 对磁盘的IO实际是对宿主OS的这个大文件进行IO, 而且系统调用会被 Hypervisor 截获, 转化为 Hypervisor 对宿主OS的系统调用, 无法直接接触到硬件.
所以Type2的效率要低于Type1.
-
容器
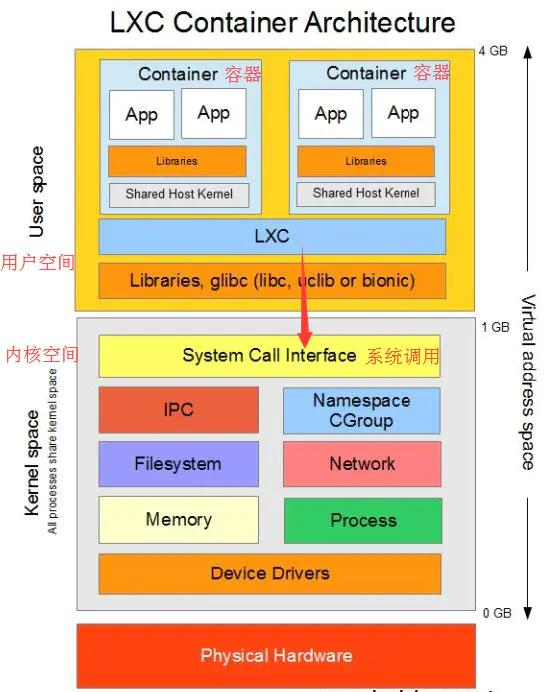
存在于操作系统层和函数库层之间的虚拟化技术, 容器通过**“伪造”操作系统的接口**, 将函数库层以上的功能置于操作系统上. 以 Docker 为例, 其就是一个基于 Linux 操作系统的 Namespace 和 Cgroup 功能实现的隔离容器, 可以模拟操作系统的功能.
简单来说, 如果虚拟机是把整个操作系统封装隔离, 从而实现跨平台应用的话, 那么容器则是把一个个应用单独封装隔离, 从而实现跨平台应用. 所以容器体积比虚拟机小很多. 容器化是应用程序级别的虚拟化技术, 容器提供了将应用程序的代码、运行时、系统工具、系统库和配置打包到一个实例中的标准方法. -
JVM 之类的虚拟机
JVM 一类的虚拟机是存在于函数库层和应用程序之间的虚拟化技术, 通过在上层为 Java 程序提供 统一的运行环境, 屏蔽了操作系统和硬件的差异, 使程序只面对字节码和标准 API; 在下层, JVM 会把程序的行为(如内存申请、线程调度、文件操作、网络请求等) 转换为对应操作系统的系统调用, 再交给底层系统去执行, 从而实现 “上层开发者无需关心底层 OS 差异,下层 OS 也无需知道程序细节”的跨平台执行环境.
容器虚拟化实现
下面是容器虚拟化的基础内容:
命名空间隔离
dd
dd 命令dd 可从标准输入或文件中读取数据, 根据指定的格式来转换数据, 再输出到文件、设备或标准输出.
dd OPTION
其中选项包括:
- if=文件名:输入文件名,默认为标准输入。即指定源文件 of=文件名:输出文件名,默认为标准输出。即指定目的文件
- ibs=bytes:一次读入 bytes 个字节,即指定一个块大小为 bytes 个字节
- obs=bytes:一次输出 bytes个字节,即指定一个块大小为 bytes 个字节。
- bs=bytes:同时设置读入/输出的块大小为 bytes 个字节
- cbs=bytes:一次转换 bytes 个字节,即指定转换缓冲区大小
- skip=blocks:从输入文件开头跳过 blocks个块后再开始复制
- seek=blocks:从输出文件开头跳过 blocks 个块后再开始复制
- count=blocks:仅拷贝blocks 个块,块大小等于 ibs 指定的字节数
- conv=<关键字>,关键字可以有以下 11 种
- conversion: 用指定的参数转换文件
- ascii:转换 ebcdic 为 ascii
- ebcdic:转换 ascii 为 ebcdic
- ibm:转换 ascii 为 alternate ebcdic
- block:把每一行转换为长度为 cbs,不足部分用空格填充
- unblock:使每一行的长度都为 cbs,不足部分用空格填充
- lcase:把大写字符转换为小写字符
- ucase:把小写字符转换为大写字符
- swap:交换输入的每对字节
- noerror:出错时不停止
- notrunc:不截短输出文件
- sync:将每个输入块填充到 ibs 个字节,不足部分用空(NUL)字符补齐
下面举两个案例:
- 生成一个8MB大小的空白文件:
# 输入文件指定为/dev/zero, 可以持续输出空白字符; 输出文件指定为out.img; 设定输入输出block大小为8*1024, 然后拷贝1024个block, 所以文件大小为8MB
dd if=/dev/zero of=out.img bs=8k count=1024
1024+0 records in
1024+0 records out
8388608 bytes (8.4 MB, 8.0 MiB) copied, 0.0468117 s, 179 MB/s# -h参数查看生成的out.img大小
ls -lh
total 8.0M
-rw-rw-r-- 1 zzy zzy 8.0M Oct 15 16:16 out.img
- 大小写转换:
# 把in.txt的内容转换大写, 存储到out.txt
dd if=in.txt of=out.txt conv=ucase
0+1 records in
0+1 records out
13 bytes copied, 0.000169736 s, 76.6 kB/s# 查看in.txt
cat in.txt
Hello World!# 查看转换后的out.txt
cat out.txt
HELLO WORLD!
mkfs
在设备上创建指定类型的 Linux 文件系统,俗称格式化, 比如我们使用 U 盘的时候可以格式化
mkfs [-V] [-t fstype] [fs-options] filesys [blocks]
- -t fstype:指定要建立文件系统的类型, 如 ext3, ext4
- fs-options:传递给具体的文件系统的参数
- filesys :指定要创建的文件系统对应的设备文件名
- blocks:指定文件系统的磁盘块数
- -V : 详细显示模式
# 当前目录有一个 out.img 镜像
ls -lh
total 4.2M
-rw-rw-r-- 1 zzy zzy   13 Oct 15 16:17 in.txt
-rw-rw-r-- 1 zzy zzy 8.0M Oct 16 15:26 out.img
-rw-rw-r-- 1 zzy zzy   13 Oct 15 16:18 out.txt# 现在把该镜像文件格式化为ext4文件系统
mkfs -t ext4 out.img
mke2fs 1.45.5 (07-Jan-2020)
Discarding device blocks: done
Creating filesystem with 2048 4k blocks and 2048 inodesAllocating group tables: done
Writing inode tables: done
Creating journal (1024 blocks): done
Writing superblocks and filesystem accounting information: done
df
df(disk free) 命令用于显示目前在 Linux 系统上的文件系统磁盘使用情况统计.
df [OPTION]... [FILE]...
常见参数:
- -a, --all 包含所有的具有 0 Blocks 的文件系统
- -h, --human-readable 使用人类可读的格式(预设值是不加这个选项的…)
- -H, --si 很像 -h, 但是用 1000 为单位而不是用 1024
- -t, --type=TYPE 限制列出文件系统的 TYPE
- -T, --print-type 显示文件系统的形式
# 由于添加-T, 所以多了Type列;
# 由于添加-h, 所以单位变成M,G等人类可读格式
df -hT
Filesystem     Type      Size  Used Avail Use% Mounted on
udev           devtmpfs  915M     0  915M   0% /dev
tmpfs          tmpfs     190M  712K  189M   1% /run
/dev/vda3      ext4       40G   18G   20G  48% /
tmpfs          tmpfs     946M     0  946M   0% /dev/shm
tmpfs          tmpfs     5.0M     0  5.0M   0% /run/lock
tmpfs          tmpfs     946M     0  946M   0% /sys/fs/cgroup
/dev/vda2      vfat      189M  6.1M  183M   4% /boot/efi
tmpfs          tmpfs     190M     0  190M   0% /run/user/1000
/dev/loop0     ext4      3.8M   28K  3.2M   1% /mnt/test_mymount
# 由于添加-a, 具有 0 Blocks 的文件系统也被列举出来
df -ha
Filesystem      Size  Used Avail Use% Mounted on
sysfs              0     0     0    - /sys
proc               0     0     0    - /proc
udev            915M     0  915M   0% /dev
devpts             0     0     0    - /dev/pts
tmpfs           190M  712K  189M   1% /run
/dev/vda3        40G   18G   20G  48% /
securityfs         0     0     0    - /sys/kernel/security
tmpfs           946M     0  946M   0% /dev/shm
tmpfs           5.0M     0  5.0M   0% /run/lock
tmpfs           946M     0  946M   0% /sys/fs/cgroup
cgroup2            0     0     0    - /sys/fs/cgroup/unified
cgroup             0     0     0    - /sys/fs/cgroup/systemd
pstore             0     0     0    - /sys/fs/pstore
none               0     0     0    - /sys/fs/bpf
cgroup             0     0     0    - /sys/fs/cgroup/memory
cgroup             0     0     0    - /sys/fs/cgroup/cpuset
cgroup             0     0     0    - /sys/fs/cgroup/net_cls,net_prio
cgroup             0     0     0    - /sys/fs/cgroup/blkio
cgroup             0     0     0    - /sys/fs/cgroup/freezer
cgroup             0     0     0    - /sys/fs/cgroup/hugetlb
cgroup             0     0     0    - /sys/fs/cgroup/devices
cgroup             0     0     0    - /sys/fs/cgroup/pids
cgroup             0     0     0    - /sys/fs/cgroup/rdma
cgroup             0     0     0    - /sys/fs/cgroup/perf_event
cgroup             0     0     0    - /sys/fs/cgroup/cpu,cpuacct
systemd-1          -     -     -    - /proc/sys/fs/binfmt_misc
hugetlbfs          0     0     0    - /dev/hugepages
mqueue             0     0     0    - /dev/mqueue
debugfs            0     0     0    - /sys/kernel/debug
tracefs            0     0     0    - /sys/kernel/tracing
configfs           0     0     0    - /sys/kernel/config
fusectl            0     0     0    - /sys/fs/fuse/connections
/dev/vda2       189M  6.1M  183M   4% /boot/efi
binfmt_misc        0     0     0    - /proc/sys/fs/binfmt_misc
tracefs            -     -     -    - /sys/kernel/debug/tracing
tmpfs           190M     0  190M   0% /run/user/1000
/dev/loop0      3.8M   28K  3.2M   1% /mnt/test_mymount
mount
mount 命令用于加载文件系统到指定的加载点, 此命令的也常用于挂载光盘, 使我们可以访问光盘中的数据.
什么是挂载?
比如我们在 Windows 电脑上插入一个U盘, 在"我的电脑"里会自动挂载一个新的磁盘(比如F盘), 然后就可以双击进行访问.
所以挂载其实是为磁盘添加了一个入口, 但是Linux系统下并不会自动挂载, 必须使用Linux mount 命令来手动完成挂载.
mount 常用语法:
mount [-l]
mount [-t vfstype] [-o options] device dir
- -l:显示已加载的文件系统列表
- -t: 加载文件系统类型支持常见系统类型的 ext3,ext4,iso9660, tmpfs,xfs 等,大部分情况可以不指定, mount 可以自己识别
- -o options 主要用来描述设备或档案的挂接方式。
- loop:用来把一个文件当成硬盘分区挂接上系统
- ro:采用只读方式挂接设备
- rw:采用读写方式挂接设备
- device: 要挂接(mount)的设备。
- dir: 挂载点的目录
下面实现一个案例, 挂载一个镜像文件到 /mnt/test_mymount/, 然后在其中创建一个 a.txt, 内容为hello:
# 生成一个8M空白镜像
dd if=/dev/zero of=out.img bs=8k count=1024# 初始化为ext4
mkfs -t ext4 out.img# 把镜像文件挂载到/mnt/test_mymount/目录下
sudo mkdir /mnt/test_mymount
sudo mount ./out.img /mnt/test_mymount/# 可以通过df查看到挂载成功, Size=3.8M是可用的大小, 其余 8M-3.8M 的内容是文件系统的初始化信息
df -h
Filesystem      Size  Used Avail Use% Mounted on
udev            915M     0  915M   0% /dev
tmpfs           190M  712K  189M   1% /run
/dev/vda3        40G   18G   20G  48% /
tmpfs           946M     0  946M   0% /dev/shm
tmpfs           5.0M     0  5.0M   0% /run/lock
tmpfs           946M     0  946M   0% /sys/fs/cgroup
/dev/vda2       189M  6.1M  183M   4% /boot/efi
tmpfs           190M     0  190M   0% /run/user/1000
/dev/loop0      3.8M   24K  3.2M   1% /mnt/test_mymount
此时 /mnt/test_mymount 就是 一个“入口”, 而 out.img 是一个 “U盘”, 我可以通过这个入口在镜像文件中进行读写:
# 向镜像文件写入一个文件
echo "hello" | sudo tee /mnt/test_mymount/a.txt# 查看内容
cat /mnt/test_mymount/a.txt
hello
如果 umount 后(拔出U盘), /mnt/test_mymount/ 这个入口就失效了, 数据回到镜像文件中, 目录会变空:sudo umount /mnt/test_mymountsudo cat /mnt/test_mymount/a.txt
cat: /mnt/test_mymount/a.txt: No such file or directory
unshare
unshare 主要能力是使用与父程序不共享的名称空间运行程序
unshare [options] program [arguments]
参数:
- -i, --ipc 不共享 IPC 空间
- -m, --mount 不共享 Mount 空间
- -n, --net 不共享 Net 空间
- -p, --pid 不共享 PID 空间
- -u, --uts 不共享 UTS 空间
- -U, --user 不共享用户
- -V, --version 版本查看
- –fork 执行 unshare 的进程 fork 一个新的子进程,在子进程里执行 unshare 传入的参数
- –mount-proc 执行子进程前, 将 proc 优先挂载过去
- hostname隔离
# 在unshare前查看hostname
hostname
zzy-aliyun# unshare 进行主机名隔离后, 再重新设置主机名
unshare -u /bin/bash
hostname test1# 查看设置后的主机名
hostname
test1此外, 我们还可以查看一下这个新进程 /bin/bash 的父进程, 其实是我们宿主机的bash
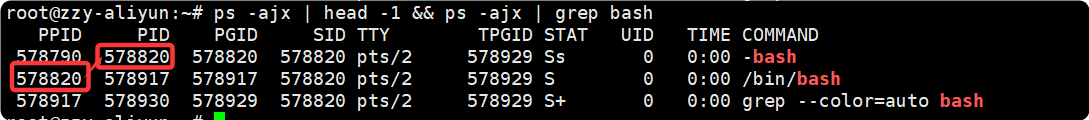
# 退出新创建的/bin/bash后, 由于所属 namespace 被销毁, 所以查看主机名仍为宿主机的主机名, 完成了主机名隔离
exit
hostname
zzy-aliyun
- PID 隔离
unshare -p /bin/bash
bash: fork: Cannot allocate memory
如果我们直接 unshare -p 的话, 会报错, 原因是因为: 如之前的图所示, /bin/bash 进程的父进程是宿主机的 bash, 但是由于我们隔离了namespace, 所以宿主机 bash 并不在新的 namespace 中, 所以会报错 Cannot allocate memory. 所以需要加一个 --fork, 表示 启动的 /bin/bash 是一个新的进程.
unshare -p --fork --mount-proc /bin/bash
除了–fork外, 还要加一个 mount-proc 选项, 是因为 Linux 下的每个进程都有一个对应的 /proc/PID 目录, 该目录包含了大量的有关当前进程的信息, 对一个 PID namespace 而言, /proc 目录只包含当前namespace 和它所有子孙后代 namespace 里的进程的信息. 创建新的 namespace 后, 虽然进入了新 PID namespace, 但 /proc 仍然是宿主机的 /proc ,内容显示的是 宿主机 PID 命名空间的进程信息, 所以必须在子进程启动前执行: mount -t proc proc /proc, 它的意思是 “请内核挂载一个新的/proc 文件系统实例, 并把它接入到/proc目录上”, --mount-proc 就是做了这个工作.
ps -ef
UID          PID    PPID  C STIME TTY          TIME CMD
root           1       0  0 16:56 pts/0    00:00:00 /bin/bash
root           8       1  0 16:56 pts/0    00:00:00 ps -ef
现在我们可以看到新的namespace里, 1号进程为 /bin./bash, 说明我们已经看不到主机上的进程空间了, 我们的进程空间发生了隔离.
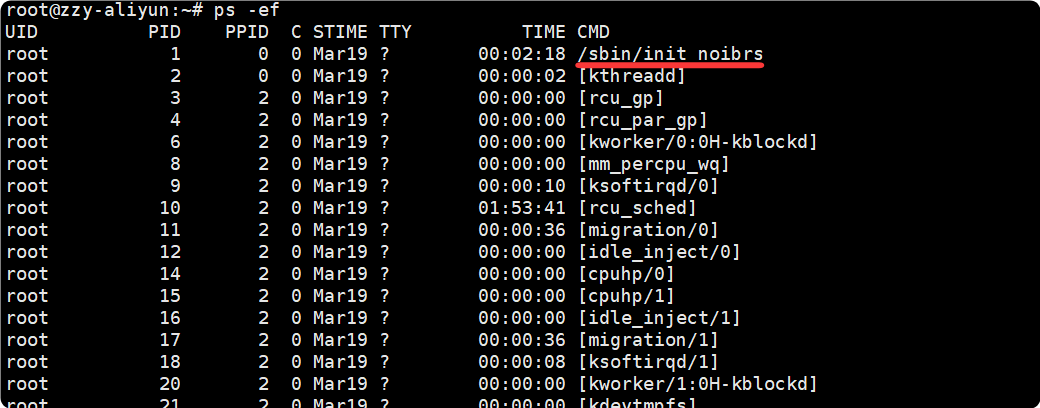
如果我们另起一个终端, ps -ef 会查看到非常多的进程, 而且1号进程为/sbin/init, 并不是 /bin/bash:
- Mount 隔离
a. 首先在窗口1中操作:
# 首先 unshare 进行 mount 隔离
unshare -m --fork /bin/bash# 添加新的磁盘挂载
dd if=/dev/zero of=test.img bs=8k count=10240
mkfs -t ext4 ./test.img
mount ./test.img /mnt/test_namespace/# 在挂载的磁盘中添加文件
echo "hello world" > /mnt/test_namespace/b.txt
然后通过 df 查看到了磁盘挂载信息, 也能查看到文件的内容:
df -h
Filesystem      Size  Used Avail Use% Mounted on
/dev/vda3        40G   18G   20G  48% /
udev            915M     0  915M   0% /dev
tmpfs           946M     0  946M   0% /dev/shm
tmpfs           190M  724K  189M   1% /run
tmpfs           5.0M     0  5.0M   0% /run/lock
tmpfs           190M     0  190M   0% /run/user/1000
tmpfs           190M     0  190M   0% /run/user/0
tmpfs           946M     0  946M   0% /sys/fs/cgroup
/dev/vda2       189M  6.1M  183M   4% /boot/efi
/dev/loop0      3.8M   28K  3.2M   1% /mnt/test_mymount
/dev/loop1       74M   28K   68M   1% /mnt/test_namespacecat /mnt/test_namespace/b.txt
hello world
b. 然后新建一个窗口2, 会发现并没有磁盘的挂载信息, /mnt/test_namespace 目录下也没有 b.txt, 说明我们实现了文件系统隔离:
df -h
Filesystem      Size  Used Avail Use% Mounted on
udev            915M     0  915M   0% /dev
tmpfs           190M  732K  189M   1% /run
/dev/vda3        40G   18G   20G  48% /
tmpfs           946M     0  946M   0% /dev/shm
tmpfs           5.0M     0  5.0M   0% /run/lock
tmpfs           946M     0  946M   0% /sys/fs/cgroup
/dev/vda2       189M  6.1M  183M   4% /boot/efi
tmpfs           190M     0  190M   0% /run/user/1000
/dev/loop0      3.8M   28K  3.2M   1% /mnt/test_mymount
tmpfs           190M     0  190M   0% /run/user/0cat /mnt/test_namespace/b.txt
cat: /mnt/test_namespace/b.txt: No such file or directory
CGroups 资源控制
容器化中, 操作系统是真正的资源控制层,
pidstat
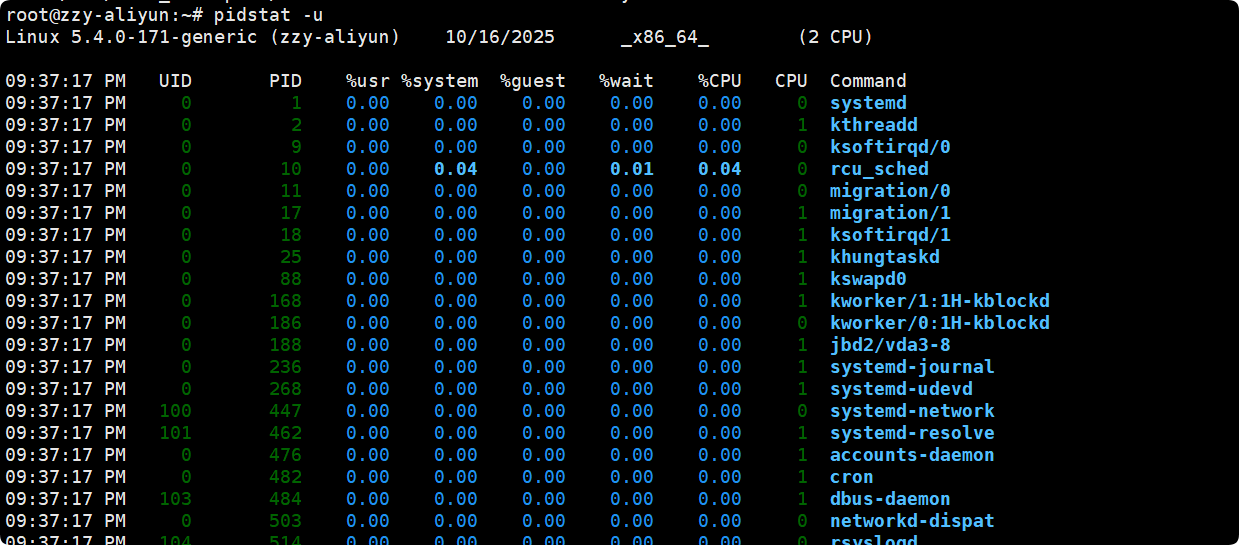
pidstat 是 sysstat 的一个命令, 用于监控全部或指定进程的 CPU、内存、线程、设备IO 等系统资源的占用情况, Pidstat 第一次采样显示自系统启动开始的各项统计信息, 后续采样将显示自上次运行命令后的统计信息.
用户可以通过指定统计的次数和时间来获得所需的统计信息
pidstat [ 选项 ] [ <时间间隔> ] [ <次数> ]
参数:
- -u: 默认参数, 显示各进程的CPU使用统计
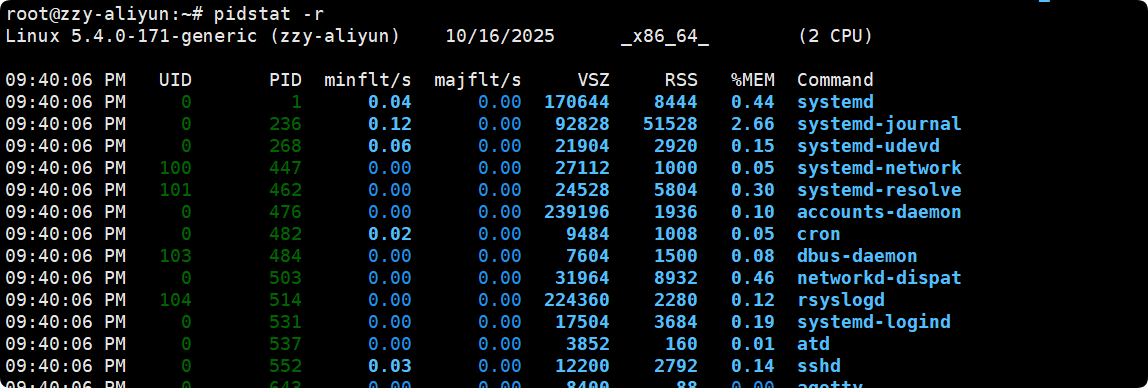
- -r: 显示各进程的内存使用统计
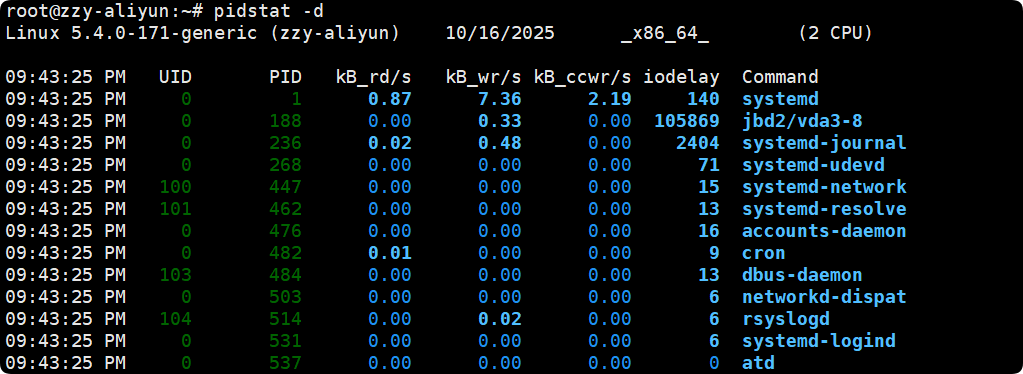
- -d: 显示各进程的IO使用统计
- -p: 指定进程号, ALL 表示所有进程
- -C: 指定命令, 比如如果指定mysql, 那么只会监测与 mysql 相关的进程所使用的资源情况.
- -I: 显示命令名和所有参数
关于CPU资源其中的部分解释:
| 字段 | CPU 执行场景 | 解释 |
|---|---|---|
| %usr | 用户态 | 执行普通应用代码, 不涉及系统调用, 不在内核中运行 |
| %system | 内核态 | 进程在执行 系统调用 / 内核服务 / IO 调度 / 上下文切换 等 |
| %guest | 虚拟 CPU 在 guest 模式下 | 当宿主机在运行 虚拟机中的进程 时,CPU 时间算在 guest 模式 |
| %wait(iowait) | 等待 IO,CPU 空闲 | 虽然 CPU 不干活, 但进程在等 IO, 算一种“等待的消耗” |
关于内存资源其中的部分解释:
- VSZ 是虚拟内存占用, 单位 KB
- RSS 是物理内存占用, 单位KB
- %MEM是占总内存百分比
关于IO资源其中的部分解释:
- kB_rd/s 每秒读取磁盘 KB
- kB_wr/s 每秒写磁盘 KB
案例:
- 查看与mysql相关所有进程的 CPU 占用情况
pidstat -u -p ALL -C mysql
Linux 5.4.0-171-generic (zzy-aliyun) 	10/16/2025 	_x86_64_	(2 CPU)09:48:54 PM   UID       PID    %usr %system  %guest   %wait    %CPU   CPU  Command
09:48:54 PM   108    188567    0.10    0.08    0.00    0.00    0.19     0  mysqld
09:48:54 PM     0    579083    0.00    0.00    0.00    0.00    0.00     1  mysql
- 现在已知mysqld的进程号是 188567, 则我要查看 mysqld 的 CPU 占用情况, 每秒统计一次, 共统计三次:
pidstat -u -p 188567 1 3
Linux 5.4.0-171-generic (zzy-aliyun) 	10/16/2025 	_x86_64_	(2 CPU)09:51:26 PM   UID       PID    %usr %system  %guest   %wait    %CPU   CPU  Command
09:51:27 PM   108    188567    0.00    0.00    0.00    0.00    0.00     0  mysqld
09:51:28 PM   108    188567    0.00    0.00    0.00    0.00    0.00     0  mysqld
09:51:29 PM   108    188567    1.00    0.00    0.00    0.00    1.00     0  mysqld
Average:      108    188567    0.33    0.00    0.00    0.00    0.33     -  mysqld
stress
stress 是 Linux 的一个压力测试工具, 可以对 CPU, Memory, IO, 磁盘 进行压力测试.
stress [OPTION [ARG]]
- -c, --cpu N:产生 N 个进程,每个进程都循环调用 sqrt 函数产生 CPU 压力
- -i, --io N:产生 N 个进程,每个进程循环调用 sync 将内存缓冲区内容写到磁盘上,产生 IO 压力。通过系统调用 sync 刷新内存缓冲区数据到磁盘中,以确保同步。如果缓冲区内数据较少,写到磁盘中的数据也较少,不会产生 IO 压力。在 SSD 磁盘环境中尤为明显,很可能 iowait 总是 0,却因为大量调用系统调用 sync,导致系统 CPU使用率 sys 升高.
- -m, --vm N:产生 N 个进程,每个进程循环调用 malloc/free 函数分配和释放内存
- –vm-bytes B:指定分配内存的大小
- –vm-keep:一直占用内存,区别于不断的释放和重新分配(默认是不断释放并重新
分配内存)
- -d, --hdd N:产生 N 个不断执行 write 和 unlink 函数的进程(创建文件,写入内容,删除文件)
- –hdd-bytes B:指定文件大小
- -t, --timeout N:在 N 秒后结束程序
- -q, --quiet:程序在运行的过程中不输出信息
案例:
- 另起一个终端输入 stress -c 1后, 我们可以看到出现了两个stress进程, 第一行是一个管理进程, 不消耗CPU, 重点是第二行, 发现它很快就把用户态CPU %usr 占满了:
# 每2秒监控一次stress的CPU占用
pidstat -C stress -u -p ALL 2 1000
09:58:04 PM   UID       PID    %usr %system  %guest   %wait    %CPU   CPU  Command09:58:06 PM   UID       PID    %usr %system  %guest   %wait    %CPU   CPU  Command
09:58:08 PM     0    579686    0.00    0.00    0.00    0.00    0.00     0  stress
09:58:08 PM     0    579687   52.50    0.00    0.00    0.00   52.50     1  stress09:58:08 PM   UID       PID    %usr %system  %guest   %wait    %CPU   CPU  Command
09:58:10 PM     0    579686    0.00    0.00    0.00    0.00    0.00     0  stress
09:58:10 PM     0    579687  100.00    0.00    0.00    0.00  100.00     1  stress09:58:10 PM   UID       PID    %usr %system  %guest   %wait    %CPU   CPU  Command
09:58:12 PM     0    579686    0.00    0.00    0.00    0.00    0.00     0  stress
09:58:12 PM     0    579687  100.00    0.00    0.00    0.00  100.00     1  stress
- 另起一个终端输入 stress -i 1后, 同样重点是第二行, 发现主要是内核态CPU %system 有一定的占用, 而且 %wait 还出现 IO 等待的时间:
pidstat -C stress -u -p ALL 2 1000
Linux 5.4.0-171-generic (zzy-aliyun) 	10/16/2025 	_x86_64_	(2 CPU)10:02:57 PM   UID       PID    %usr %system  %guest   %wait    %CPU   CPU  Command10:02:59 PM   UID       PID    %usr %system  %guest   %wait    %CPU   CPU  Command
10:03:01 PM     0    579710    0.00    0.00    0.00    0.00    0.00     0  stress
10:03:01 PM     0    579711    0.00   12.50    0.00    4.50   12.50     1  stress10:03:01 PM   UID       PID    %usr %system  %guest   %wait    %CPU   CPU  Command
10:03:03 PM     0    579710    0.00    0.00    0.00    0.00    0.00     0  stress
10:03:03 PM     0    579711    0.50   32.50    0.00   12.00   33.00     1  stress10:03:03 PM   UID       PID    %usr %system  %guest   %wait    %CPU   CPU  Command
10:03:05 PM     0    579710    0.00    0.00    0.00    0.00    0.00     0  stress
10:03:05 PM     0    579711    0.00   34.50    0.00   12.50   34.50     1  stress10:03:05 PM   UID       PID    %usr %system  %guest   %wait    %CPU   CPU  Command
10:03:07 PM     0    579710    0.00    0.00    0.00    0.00    0.00     0  stress
10:03:07 PM     0    579711    1.00   34.50    0.00   12.50   35.50     1  stress
- 另起一个终端输入 stress -m 1 --vm-bytes 50m , 表示一个进程分配50MB的空间, 并循环在这块空间上malloc/free, 然后同样重点是第二行stress, 发现虚拟内存的分配是固定的50MB, 物理内存在不断地变化, 一会增加一会减少, 说明这个stress进程在不断地malloc和free:
pidstat -C stress -r -p ALL 2 1000
Linux 5.4.0-171-generic (zzy-aliyun) 	10/16/2025 	_x86_64_	(2 CPU)10:08:20 PM   UID       PID  minflt/s  majflt/s     VSZ     RSS   %MEM  Command10:08:22 PM   UID       PID  minflt/s  majflt/s     VSZ     RSS   %MEM  Command
10:08:24 PM     0    579722     50.50      0.00    3704    1284   0.07  stress
10:08:24 PM     0    579723  27485.00      0.00   54908   15164   0.78  stress10:08:24 PM   UID       PID  minflt/s  majflt/s     VSZ     RSS   %MEM  Command
10:08:26 PM     0    579722      0.00      0.00    3704    1284   0.07  stress
10:08:26 PM     0    579723 348814.00      0.00   54908   41036   2.12  stress10:08:26 PM   UID       PID  minflt/s  majflt/s     VSZ     RSS   %MEM  Command
10:08:28 PM     0    579722      0.00      0.00    3704    1284   0.07  stress
10:08:28 PM     0    579723 350050.50      0.00   54908   25460   1.32  stress10:08:28 PM   UID       PID  minflt/s  majflt/s     VSZ     RSS   %MEM  Command
10:08:30 PM     0    579722      0.00      0.00    3704    1284   0.07  stress
10:08:30 PM     0    579723 351505.50      0.00   54908   21500   1.11  stress10:08:30 PM   UID       PID  minflt/s  majflt/s     VSZ     RSS   %MEM  Command
10:08:32 PM     0    579722      0.00      0.00    3704    1284   0.07  stress
10:08:32 PM     0    579723 350463.00      0.00   54908    9092   0.47  stress10:08:32 PM   UID       PID  minflt/s  majflt/s     VSZ     RSS   %MEM  Command
10:08:34 PM     0    579722      0.00      0.00    3704    1284   0.07  stress
10:08:34 PM     0    579723 357288.00      0.00   54908   12792   0.66  stress10:08:34 PM   UID       PID  minflt/s  majflt/s     VSZ     RSS   %MEM  Command
10:08:36 PM     0    579722      0.00      0.00    3704    1284   0.07  stress
10:08:36 PM     0    579723 354304.00      0.00   54908   18596   0.96  stress10:08:36 PM   UID       PID  minflt/s  majflt/s     VSZ     RSS   %MEM  Command
10:08:38 PM     0    579722      0.00      0.00    3704    1284   0.07  stress
10:08:38 PM     0    579723 355375.50      0.00   54908   45788   2.37  stress10:08:38 PM   UID       PID  minflt/s  majflt/s     VSZ     RSS   %MEM  Command
10:08:40 PM     0    579722      0.00      0.00    3704    1284   0.07  stress
10:08:40 PM     0    579723 352040.50      0.00   54908   46052   2.38  stress10:08:40 PM   UID       PID  minflt/s  majflt/s     VSZ     RSS   %MEM  Command
10:08:42 PM     0    579722      0.00      0.00    3704    1284   0.07  stress
10:08:42 PM     0    579723 349597.50      0.00   54908   26780   1.38  stress10:08:42 PM   UID       PID  minflt/s  majflt/s     VSZ     RSS   %MEM  Command
10:08:44 PM     0    579722      0.00      0.00    3704    1284   0.07  stress
10:08:44 PM     0    579723 343631.00      0.00   54908   10940   0.57  stress
- 另起一个终端输入 stress -d 1, 然后同样重点是第二行stress, 发现 stress 在不断地进行写入操作, 并没有读取:
pidstat -C stress -d -p ALL 2 1000
Linux 5.4.0-171-generic (zzy-aliyun) 	10/16/2025 	_x86_64_	(2 CPU)10:13:39 PM   UID       PID   kB_rd/s   kB_wr/s kB_ccwr/s iodelay  Command10:13:41 PM   UID       PID   kB_rd/s   kB_wr/s kB_ccwr/s iodelay  Command
10:13:43 PM     0    579734      0.00      0.00      0.00       0  stress
10:13:43 PM     0    579735      0.00 244158.00      0.00     109  stress10:13:43 PM   UID       PID   kB_rd/s   kB_wr/s kB_ccwr/s iodelay  Command
10:13:45 PM     0    579734      0.00      0.00      0.00       0  stress
10:13:45 PM     0    579735      0.00 108256.00      0.00     182  stress10:13:45 PM   UID       PID   kB_rd/s   kB_wr/s kB_ccwr/s iodelay  Command
10:13:47 PM     0    579734      0.00      0.00      0.00       0  stress
10:13:47 PM     0    579735      0.00 111838.00      0.00     162  stress10:13:47 PM   UID       PID   kB_rd/s   kB_wr/s kB_ccwr/s iodelay  Command
10:13:49 PM     0    579734      0.00      0.00      0.00       0  stress
10:13:49 PM     0    579735      0.00 213840.00 106496.00     156  stress10:13:49 PM   UID       PID   kB_rd/s   kB_wr/s kB_ccwr/s iodelay  Command
10:13:51 PM     0    579734      0.00      0.00      0.00       0  stress
10:13:51 PM     0    579735      0.00 107062.00      0.00     183  stress10:13:51 PM   UID       PID   kB_rd/s   kB_wr/s kB_ccwr/s iodelay  Command
10:13:53 PM     0    579734      0.00      0.00      0.00       0  stress
10:13:53 PM     0    579735      0.00  95650.00      0.00     146  stress
- -t 和 -q 参数比较简单, -t 就是stress在指定秒数后停止, -q则不打印任何提示信息.
stress -d 1 -t 2
stress: info: [579748] dispatching hogs: 0 cpu, 0 io, 0 vm, 1 hdd
stress: info: [579748] successful run completed in 2sstress -d 1 -t 2 -q
cgroups 信息查看
- cgroups 版本查看
# 首先查看这台机器的版本, 发现是Ubuntu 20.04
cat /etc/*release*
DISTRIB_ID=Ubuntu
DISTRIB_RELEASE=20.04
DISTRIB_CODENAME=focal
DISTRIB_DESCRIPTION="Ubuntu 20.04.6 LTS"
NAME="Ubuntu"
VERSION="20.04.6 LTS (Focal Fossa)"
ID=ubuntu
ID_LIKE=debian
PRETTY_NAME="Ubuntu 20.04.6 LTS"
VERSION_ID="20.04"
HOME_URL="https://www.ubuntu.com/"
SUPPORT_URL="https://help.ubuntu.com/"
BUG_REPORT_URL="https://bugs.launchpad.net/ubuntu/"
PRIVACY_POLICY_URL="https://www.ubuntu.com/legal/terms-and-policies/privacy-policy"
VERSION_CODENAME=focal
UBUNTU_CODENAME=focal# 可以发现 Ubuntu 20.04 默认有两个版本的cgroup, cgroup2 能查询的信息更多一点; centos 7.6 默认只有 cgroup 版本
cat /proc/filesystems | grep cgroup
nodev	cgroup
nodev	cgroup2
- cgroups 子系统查看(cgroups能控制哪些资源)
发现可以查看 cpu memory 等资源, cgroup2 还能查看 rdma, cgroup 则不行:
cat /proc/cgroups
#subsys_name	hierarchy	num_cgroups	enabled
cpuset	3	1	1
cpu	12	6	1
cpuacct	12	6	1
blkio	5	1	1
memory	2	106	1
devices	8	72	1
freezer	6	1	1
net_cls	4	1	1
perf_event	11	1	1
net_prio	4	1	1
hugetlb	7	1	1
pids	9	82	1
rdma	10	1	1
- cgroups 挂载信息查看
通过 mount | grep cgroup:
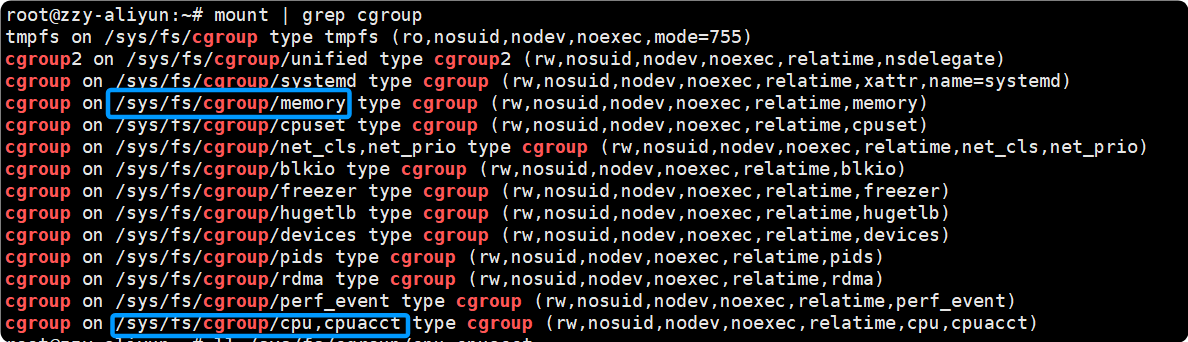
如图可以查看 cpu 控制组信息在 /sys/fs/cgroup/cpu,cpuacct.
ll 可以看到该目录下的信息:
ll /sys/fs/cgroup/cpu,cpuacct
total 0
dr-xr-xr-x  7 root root   0 Mar 19  2025 ./
drwxr-xr-x 15 root root 380 Mar 19  2025 ../
drwxr-xr-x  2 root root   0 Oct 17 03:02 aegis/
drwxr-xr-x  2 root root   0 Oct 17 03:02 aegisMonitor/
drwxr-xr-x  2 root root   0 Oct 17 15:09 aegisRtap0/
drwxr-xr-x  2 root root   0 Oct 17 15:47 aegisRtap1/
drwxr-xr-x  2 root root   0 Oct 17 15:47 assist/
-rw-r--r--  1 root root   0 Oct 17 15:47 cgroup.clone_children
-rw-r--r--  1 root root   0 Oct 16 22:17 cgroup.procs
-r--r--r--  1 root root   0 Oct 17 15:47 cgroup.sane_behavior
-r--r--r--  1 root root   0 Oct 17 15:47 cpuacct.stat
-rw-r--r--  1 root root   0 Oct 17 15:47 cpuacct.usage
-r--r--r--  1 root root   0 Oct 17 15:47 cpuacct.usage_all
-r--r--r--  1 root root   0 Oct 17 15:47 cpuacct.usage_percpu
-r--r--r--  1 root root   0 Oct 17 15:47 cpuacct.usage_percpu_sys
-r--r--r--  1 root root   0 Oct 17 15:47 cpuacct.usage_percpu_user
-r--r--r--  1 root root   0 Oct 17 15:47 cpuacct.usage_sys
-r--r--r--  1 root root   0 Oct 17 15:47 cpuacct.usage_user
-rw-r--r--  1 root root   0 Oct 17 15:47 cpu.cfs_period_us
-rw-r--r--  1 root root   0 Oct 17 15:47 cpu.cfs_quota_us
-rw-r--r--  1 root root   0 Oct 17 15:47 cpu.shares
-r--r--r--  1 root root   0 Oct 17 15:47 cpu.stat
-rw-r--r--  1 root root   0 Oct 17 15:47 notify_on_release
-rw-r--r--  1 root root   0 Oct 17 15:47 release_agent
-rw-r--r--  1 root root   0 Oct 17 15:47 tasks
- 查看一个进程上的 cgroup 限制
cat /proc/$$/cgroup
12:cpu,cpuacct:/
11:perf_event:/
10:rdma:/
9:pids:/user.slice/user-0.slice/session-36704.scope
8:devices:/user.slice
7:hugetlb:/
6:freezer:/
5:blkio:/
4:net_cls,net_prio:/
3:cpuset:/
2:memory:/user.slice/user-0.slice/session-36704.scope
1:name=systemd:/user.slice/user-0.slice/session-36704.scope
0::/user.slice/user-0.slice/session-36704.scope
以当前 shell 进程为例, 查看进程的 cgroup, 可以看到第一行 12:cpu,cpuacct:/, 冒号后面是/, 说明该进程的 cpu 控制组信息在上一步 mount | grep cgroup 中得到的 /sys/fs/cgroup/cpu,cpuacct 的 / 目录下, 其它也是同理, 比如 pids 子系统 的信息在 : /sys/fs/cgroup/pids 的 /user.slice/user-0.slice/session-36704.scope 下. 总之最终路径为: “挂载目录” 拼接 “冒号后面的部分”
查看一下当前 shell 的 cpu 时间片情况, /sys/fs/cgroup/cpu,cpuacct 路径下有 cpu.cfs_period_us 和 cpu.cfs_quota_us 文件, 前者记录cpu时间片有多少, 后者记录当前程序能占有多少时间片.
如下所示, cpu 一共有 10w 个时间片, 而程序能用 “-1” 个时间片表示它不受cgroup控制, 如果为 1w 的话就是能用 10% 的 cpu 时间片.
cat /sys/fs/cgroup/cpu,cpuacct/cpu.cfs_period_us
100000
cat /sys/fs/cgroup/cpu,cpuacct/cpu.cfs_quota_us
-1
使用 cgroups 对内存和cpu进行控制
a. 内存
这里要实现一个案例, 先调用 stress 分配 50mb的空间, 然后通过 cgroup 控制其最多只能申请 20mb空间, 然后把该进程加入到该组中, 会发现stress进程退出了.
- 首先进入到内存控制目录,
/sys/fs/cgroup/memory, 然后创建一个测试目录test_memory, 由于cgroups 文件系统会在创建文件目录的时候自动创建相应的配置文件, 所以 ll 会发现里面已经的文件配置好了.
# cd 到目录下
cd /sys/fs/cgroup/memory
# 创建目录并进入
mkdir test_memory
cd test_memory
# 查看目录内容
ll
total 0
drwxr-xr-x 2 root root 0 Oct 17 20:13 ./
dr-xr-xr-x 7 root root 0 Mar 19  2025 ../
-rw-r--r-- 1 root root 0 Oct 17 20:13 cgroup.clone_children
--w--w--w- 1 root root 0 Oct 17 20:13 cgroup.event_control
-rw-r--r-- 1 root root 0 Oct 17 20:13 cgroup.procs
-rw-r--r-- 1 root root 0 Oct 17 20:13 memory.failcnt
--w------- 1 root root 0 Oct 17 20:13 memory.force_empty
-rw-r--r-- 1 root root 0 Oct 17 20:13 memory.kmem.failcnt
-rw-r--r-- 1 root root 0 Oct 17 20:13 memory.kmem.limit_in_bytes
-rw-r--r-- 1 root root 0 Oct 17 20:13 memory.kmem.max_usage_in_bytes
-r--r--r-- 1 root root 0 Oct 17 20:13 memory.kmem.slabinfo
-rw-r--r-- 1 root root 0 Oct 17 20:13 memory.kmem.tcp.failcnt
-rw-r--r-- 1 root root 0 Oct 17 20:13 memory.kmem.tcp.limit_in_bytes
-rw-r--r-- 1 root root 0 Oct 17 20:13 memory.kmem.tcp.max_usage_in_bytes
-r--r--r-- 1 root root 0 Oct 17 20:13 memory.kmem.tcp.usage_in_bytes
-r--r--r-- 1 root root 0 Oct 17 20:13 memory.kmem.usage_in_bytes
-rw-r--r-- 1 root root 0 Oct 17 20:13 memory.limit_in_bytes
-rw-r--r-- 1 root root 0 Oct 17 20:13 memory.max_usage_in_bytes
-rw-r--r-- 1 root root 0 Oct 17 20:13 memory.move_charge_at_immigrate
-r--r--r-- 1 root root 0 Oct 17 20:13 memory.numa_stat
-rw-r--r-- 1 root root 0 Oct 17 20:13 memory.oom_control
---------- 1 root root 0 Oct 17 20:13 memory.pressure_level
-rw-r--r-- 1 root root 0 Oct 17 20:13 memory.soft_limit_in_bytes
-r--r--r-- 1 root root 0 Oct 17 20:13 memory.stat
-rw-r--r-- 1 root root 0 Oct 17 20:13 memory.swappiness
-r--r--r-- 1 root root 0 Oct 17 20:13 memory.usage_in_bytes
-rw-r--r-- 1 root root 0 Oct 17 20:13 memory.use_hierarchy
-rw-r--r-- 1 root root 0 Oct 17 20:13 notify_on_release
-rw-r--r-- 1 root root 0 Oct 17 20:13 tasks
- 配置 cgroup 的策略为最大使用 20M 内存
# 先查看控制组原本允许申请多大内存, 单位是字节
cat memory.soft_limit_in_bytes
9223372036854771712
# 修改为 20M 即 20*1024*1024 字节
echo "20971520" > ./memory.soft_limit_in_bytes
# 确认修改成功
cat memory.soft_limit_in_bytes
20971520
- 新启动一个窗口A, 运行stress, 再启动一个窗口B, 运行pidstat, 此时stress就是在正常的运行, pidstat也能检测到stress的内存使用:
# 窗口A
stress -m 1 --vm-bytes 50m
# 窗口B
pidstat -C stress -r -p ALL 2 10000
Linux 5.4.0-171-generic (zzy-aliyun) 	10/17/2025 	_x86_64_	(2 CPU)08:22:21 PM   UID       PID  minflt/s  majflt/s     VSZ     RSS   %MEM  Command
08:22:23 PM     0    581941     50.00      0.00    3704    1344   0.07  stress
08:22:23 PM     0    581942 332806.00      0.00   54908   12788   0.66  stress
然后将 581942 进程加入到 tasks 文件里, 即把这个进程加入到当前的内存控制组中, 就会发现 stress 进程退出了, pidstat也检测不到信息了
# 窗口C
echo  581942 >> tasks
# 窗口A stress进程终止了
stress -m 1 --vm-bytes 50m
stress: info: [581976] dispatching hogs: 0 cpu, 0 io, 1 vm, 0 hdd
stress: FAIL: [581976] (415) <-- worker 581977 got signal 9
stress: WARN: [581976] (417) now reaping child worker processes
stress: FAIL: [581976] (451) failed run completed in 13s# 窗口 B 中 pidstat 检测不到stress了
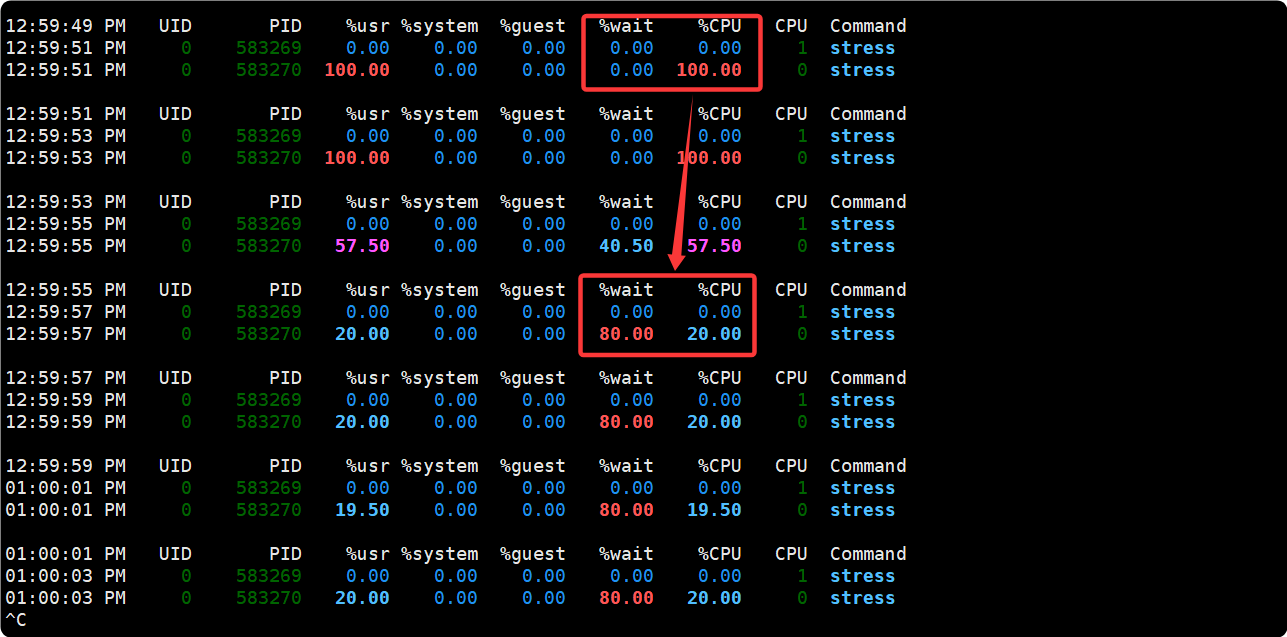
b. cpu
cpu 测试也很类似, 先用 stress 把 cpu 打满, 然后新建一个 cpu 控制组, 控制组内的cpu 占用为20% ,然后用 pidstat 监测变化:
# 在窗口A 运行stress
stress -c 1
stress: info: [583269] dispatching hogs: 1 cpu, 0 io, 0 vm, 0 hdd# 在窗口 B 运行pidstat, 可以看到cpu被打满了
pidstat -C stress -u -p ALL 2 10000
12:57:39 PM   UID       PID    %usr %system  %guest   %wait    %CPU   CPU  Command
12:57:41 PM     0    583269    0.00    0.00    0.00    0.00    0.00     1  stress
12:57:41 PM     0    583270  100.00    0.00    0.00    0.00  100.00     0  stress# 在窗口C修改cpu控制组配置文件
# 先进入cpu控制组目录
cd /sys/fs/cgroup/cpu,cpuacct
# 创建一个测试目录test_cpu, 并进入, 以看到系统会自动为我们创建 cgroup 的 cpu 策略
mkdir test_cpu
cd test_cpu
ll
total 0
drwxr-xr-x 2 root root 0 Oct 18 12:58 ./
dr-xr-xr-x 8 root root 0 Mar 19  2025 ../
-rw-r--r-- 1 root root 0 Oct 18 12:58 cgroup.clone_children
-rw-r--r-- 1 root root 0 Oct 18 12:58 cgroup.procs
-r--r--r-- 1 root root 0 Oct 18 12:58 cpuacct.stat
-rw-r--r-- 1 root root 0 Oct 18 12:58 cpuacct.usage
-r--r--r-- 1 root root 0 Oct 18 12:58 cpuacct.usage_all
-r--r--r-- 1 root root 0 Oct 18 12:58 cpuacct.usage_percpu
-r--r--r-- 1 root root 0 Oct 18 12:58 cpuacct.usage_percpu_sys
-r--r--r-- 1 root root 0 Oct 18 12:58 cpuacct.usage_percpu_user
-r--r--r-- 1 root root 0 Oct 18 12:58 cpuacct.usage_sys
-r--r--r-- 1 root root 0 Oct 18 12:58 cpuacct.usage_user
-rw-r--r-- 1 root root 0 Oct 18 12:58 cpu.cfs_period_us
-rw-r--r-- 1 root root 0 Oct 18 12:58 cpu.cfs_quota_us
-rw-r--r-- 1 root root 0 Oct 18 12:58 cpu.shares
-r--r--r-- 1 root root 0 Oct 18 12:58 cpu.stat
-rw-r--r-- 1 root root 0 Oct 18 12:58 cpu.uclamp.max
-rw-r--r-- 1 root root 0 Oct 18 12:58 cpu.uclamp.min
-rw-r--r-- 1 root root 0 Oct 18 12:58 notify_on_release
-rw-r--r-- 1 root root 0 Oct 18 12:58 tasks
我们设置 cproup 的 cpu 使用率为 30%, cpu 使用率的计算公式 : cfs_quota_us/cfs_period_us
- cfs_period_us: cfs_period_us 表示一个 cpu 带宽, 单位为微秒, 系统总 CPU 带
宽 , 默认值 100000 - cfs_quota_us: cfs_quota_us 表示 Cgroup 可以使用的 cpu 的带宽, 单位为微秒,
cfs_quota_us 为-1, 表示使用的 CPU 不受 cgroup 限制. cfs_quota_us 的最小值为
1ms(1000), 最大值为 1s
所以我们将 cfs_quota_us 的值设置为 20000 , 从理论上讲就可以限制 test_cpu 控制的进程的 cpu 利用率最多是 20%
# 查看一下 cpu 带宽
cat cpu.cfs_period_us
100000
cat cpu.cfs_quota_us
-1# 修改可使用的cpu带宽为2w
echo 20000 > cpu.cfs_quota_us # 将stress进程添加到控制组里
echo 583270 >> tasks
再打开窗口B, 查看pidstat监控的信息, 发现CPU占用率降到 20%:
至此我们成功的模拟了对内存和 cpu 的使用控制, 而 docker 本质也是调用这些的 API
来完成对资源的管理, 只不过 docker 的易用性和镜像的设计更加人性化, 所以 docker才能风靡全球.
LXC
在上层把应用软件, 应用软件依赖的动态链接库, 以及需要的操作系统的核心配置和库, 打包成一个软件容器; 在下层, 通过 namespace 和 cgroup 来分配可用的硬件资源.
LXC 是最早一批真正把完整的容器技术用一组简易使用的工具和模板来极大的简化了容器技术使用的一个方案, 但是它的迁移性不够好, 后来就出现了 docker, 所以从一定程度上来说, docker 就是 LXC 的增强版.
LXC命令
通过LXC命令创建容器, 销毁容器.
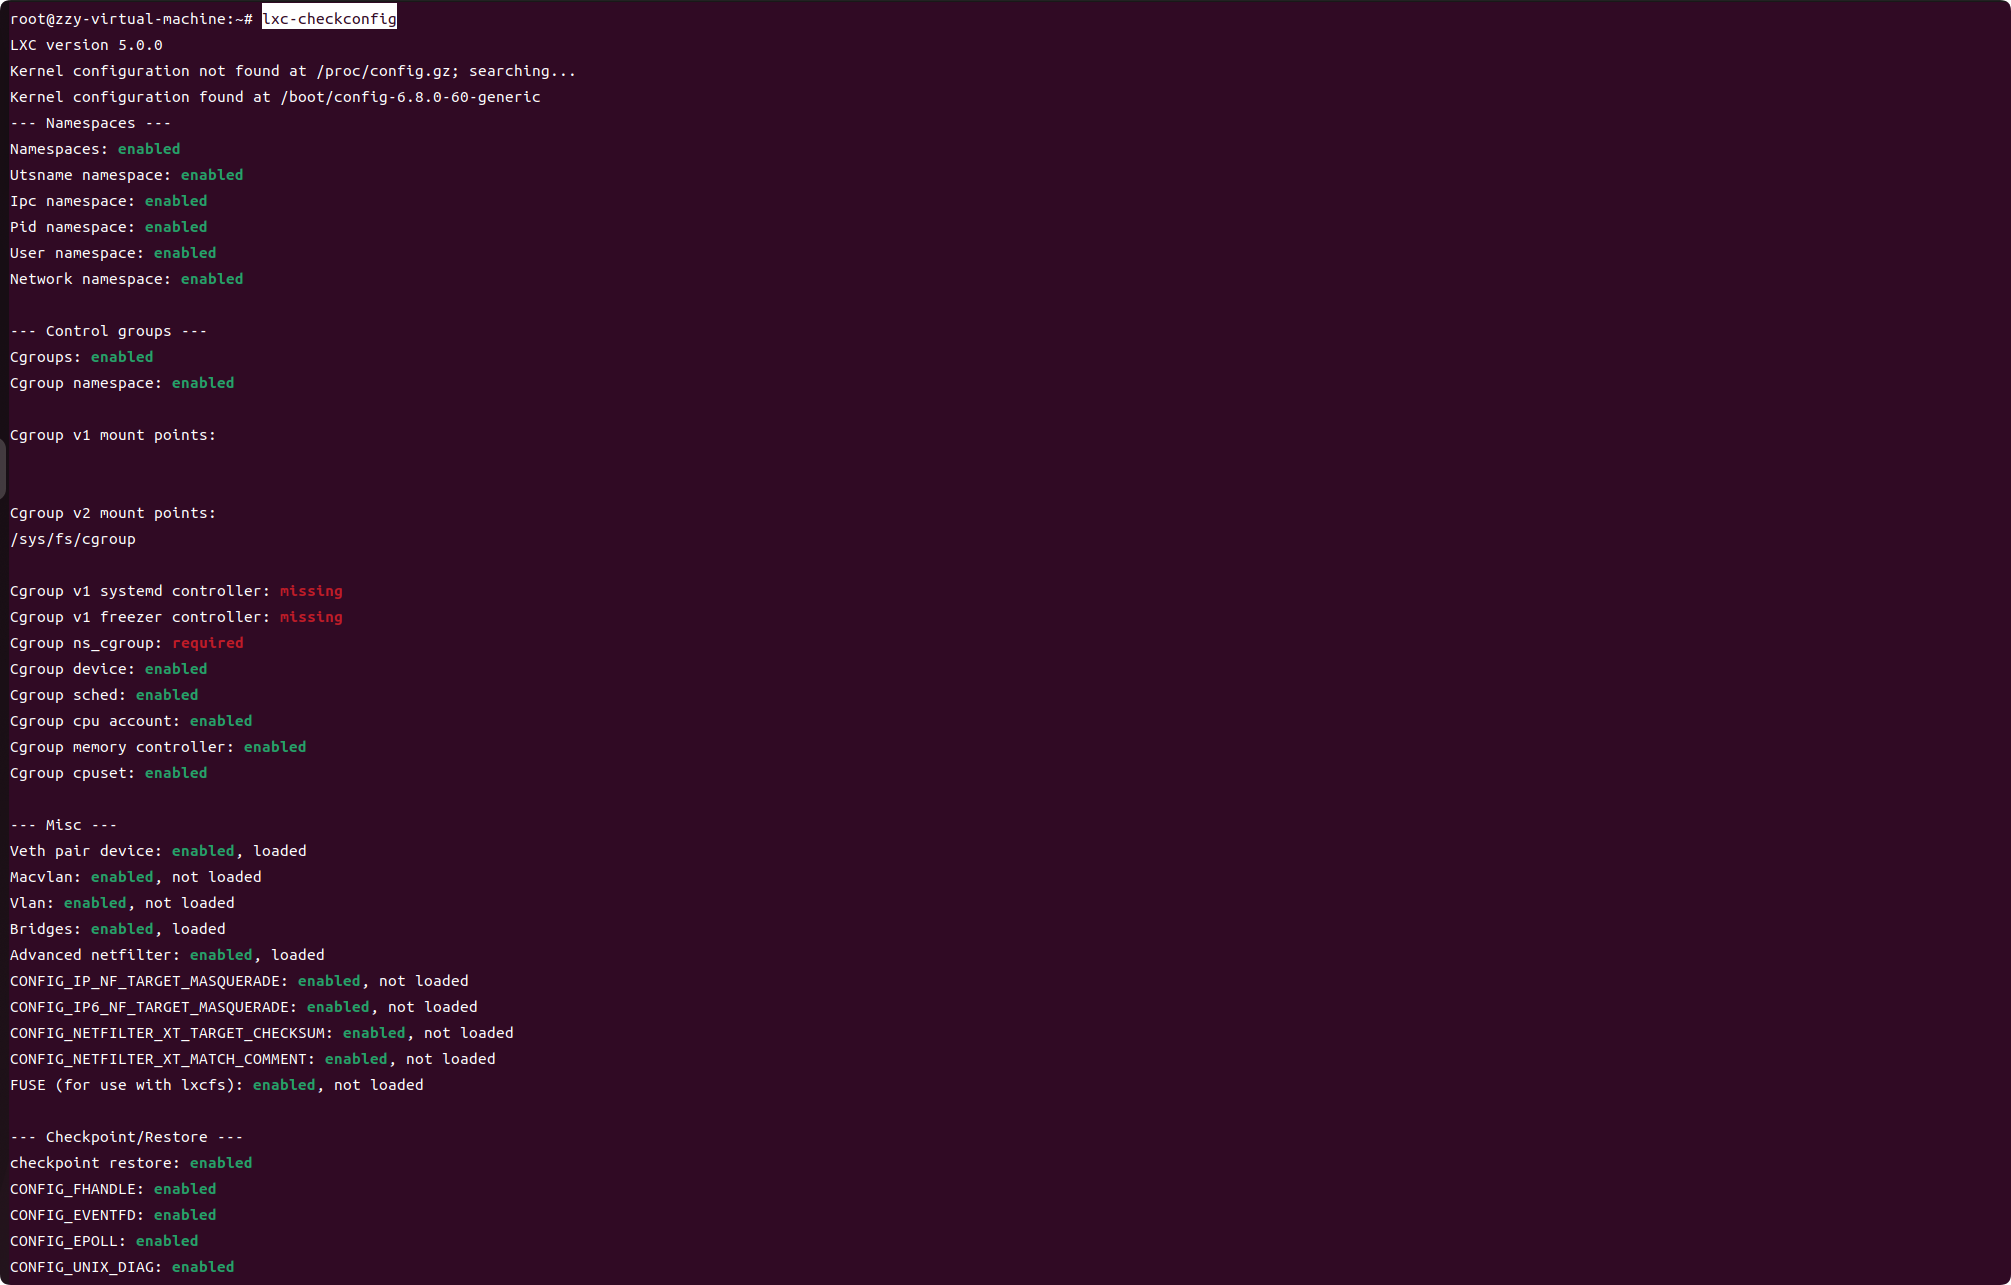
- lxc-checkconfig
功能: 检查系统环境是否满足容器使用要求, 也就是检查它是否支持 namespace, cgroup 等.
- lxc-create
功能: 创建 lxc 容器
格式: 其中 -n 指定容器名称, -t 指定模板名称(ubuntu, centos), – template-options是模板自己的额外参数.
lxc-create -n NAME -t TEMPLATE_NAME [-- template-options]
- lxc-start
功能: 启动容器
格式: -n 指定容器名称, -d表示后台运行
lxc-start -n NAME -d
- lxc-ls
功能: 列出所有容器概要信息
格式: -f 表示打印常用的信息
lxc-ls -f
- lxc-info
功能: 查看具体某个容器相关的信息
格式: -n指定容器名称
lxc-info -n NAME
- lxc-attach
功能: 进入容器执行命令
格式:
lxc-attach --name=NAME [-- COMMAND]
- lxc-stop
功能: 停止容器
格式: -n指定容器名称
lxc-stop -n NAME
- lxc-destory
功能: 删除处于停机状态的容器, 从硬盘里清除容器.
格式: -n指定容器名称
lxc-destory -n NAME
LXC案例
首先要说明: 在 aliyun ECS 实例内, 创建LXC容器受到限制, 所以测试环境为VMware ubuntu 虚拟机:
- 检查 lxc 是否运行
- 检查 lxc 的功能支持情况
- 查看 lxc 提供的容器模板
ls /usr/share/lxc/templates/
lxc-alpine    lxc-archlinux  lxc-centos  lxc-debian    lxc-fedora         lxc-gentoo  lxc-oci           lxc-opensuse  lxc-plamo  lxc-sabayon    lxc-sparclinux  lxc-ubuntu        lxc-voidlinux
lxc-altlinux  lxc-busybox    lxc-cirros  lxc-download  lxc-fedora-legacy  lxc-local   lxc-openmandriva  lxc-oracle    lxc-pld    lxc-slackware  lxc-sshd        lxc-ubuntu-cloud
- 创建一个 lxc 虚拟主机
使用lxc-create这个命令就会下载安装指定环境下的软件包, 创建新容器需要时间较长, 与容器的类型有关. 此外, 创建过程中下载的软件包保存在 /var/cache/lxc 目录下面, 当你重复下载同一个容器时, 之后的下载过程就会很快.
这里在 ubuntu虚拟机上创建一个centos9的容器:
sudo lxc-create -n centos9 -t download -- --dist centos --release 9-Stream --arch amd64
等待下载安装完所有软件包后, LXC 容器镜像就创建完成了, 容器都被放到 /var/lib/lxc/<容器名> 目录下, 容器的根文件系统放在/var/lib/lxc/<容器名>/rootfs目录下.
- 查看创建的容器信息
可以看到新创建的 centos9 容器处于停止状态:
lxc-ls -f
NAME    STATE   AUTOSTART GROUPS IPV4 IPV6 UNPRIVILEGED
centos9 STOPPED 0         -      -    -    false
- 启动容器,我们可以看到容器状态为运行中
lxc-start -n centos9 -dlxc-ls -f
NAME    STATE   AUTOSTART GROUPS IPV4      IPV6 UNPRIVILEGED
centos9 RUNNING 0         -      10.0.3.99 -    false
- 查看容器的详细信息
lxc-info -n centos9
Name:           centos9
State:          RUNNING
PID:            7966
IP:             10.0.3.99
Link:           veth0COvXOTX bytes:      1.79 KiBRX bytes:      5.95 KiBTotal bytes:   7.74 KiB
- 连接容器, 这里有两种方式, 最简单是通过 lxc-attach 命令:
# 通过lxc-attach命令进入容器
root@zzy-virtual-machine:~ lxc-attach -n centos9
# 然后在容器内安装ssh服务, 这样就可以通过ssh连接容器了
[root@centos9 ~] yum install -y openssh-server
[root@centos9 ~] systemctl enable sshd
[root@centos9 ~] systemctl start sshd
[root@centos9 ~] sudo passwd root
更改用户 root 的密码 。
新的密码:
重新输入新的密码:
passwd:所有的身份验证令牌已经成功更新。
# 然后编辑 /etc/ssh/sshd_config:
# 设置 PermitRootLogin yes
配置好 ssh 服务后, 之前通过lxc-ls -f 发现容器 ip 为 10.0.3.248 现在就可以通过 ssh 去连接容器了:
root@zzy-virtual-machine:~ ssh root@10.0.3.99
root@10.0.3.99's password:
Last failed login: Sat Oct 18 08:01:46 UTC 2025 from 10.0.3.1 on ssh:notty
There were 8 failed login attempts since the last successful login.
然后可以查看 磁盘挂载信息, 目录信息 和 宿主机都不一样
[root@centos9 /]# cat /etc/*release*
CentOS Stream release 9
NAME="CentOS Stream"
VERSION="9"
ID="centos"
ID_LIKE="rhel fedora"
VERSION_ID="9"
PLATFORM_ID="platform:el9"
PRETTY_NAME="CentOS Stream 9"
ANSI_COLOR="0;31"
LOGO="fedora-logo-icon"
CPE_NAME="cpe:/o:centos:centos:9"
HOME_URL="https://centos.org/"
BUG_REPORT_URL="https://issues.redhat.com/"
REDHAT_SUPPORT_PRODUCT="Red Hat Enterprise Linux 9"
REDHAT_SUPPORT_PRODUCT_VERSION="CentOS Stream"
CentOS Stream release 9
CentOS Stream release 9
cpe:/o:centos:centos:9[root@centos9 /]# ip addr
1: lo: <LOOPBACK,UP,LOWER_UP> mtu 65536 qdisc noqueue state UNKNOWN group default qlen 1000link/loopback 00:00:00:00:00:00 brd 00:00:00:00:00:00inet 127.0.0.1/8 scope host lovalid_lft forever preferred_lft foreverinet6 ::1/128 scope host proto kernel_lo valid_lft forever preferred_lft forever
2: eth0@if6: <BROADCAST,MULTICAST,UP,LOWER_UP> mtu 1500 qdisc noqueue state UP group default qlen 1000link/ether 00:16:3e:aa:e3:d3 brd ff:ff:ff:ff:ff:ff link-netnsid 0inet 10.0.3.99/24 brd 10.0.3.255 scope global dynamic noprefixroute eth0valid_lft 2238sec preferred_lft 2238secinet6 fe80::2813:aa7a:23b9:8f2/64 scope link noprefixroute valid_lft forever preferred_lft forever[root@centos9 /]# df -h
文件系统        容量  已用  可用 已用% 挂载点
/dev/sda3        39G   30G  7.5G   80% /
none            492K  4.0K  488K    1% /dev
tmpfs           1.9G     0  1.9G    0% /dev/shm
tmpfs           774M  8.2M  766M    2% /run[root@centos9 /]# ps -ef
UID          PID    PPID  C STIME TTY          TIME CMD
root           1       0  0 07:47 ?        00:00:00 /sbin/init
root         107       1  0 07:47 ?        00:00:00 /usr/lib/systemd/systemd-journald
dbus         118       1  0 07:47 ?        00:00:00 /usr/bin/dbus-broker-launch --scope system --audit
dbus         119     118  0 07:47 ?        00:00:00 dbus-broker --log 4 --controller 9 --machine-id eac7597e29e840579b3e4a4b6f45f82b --max-bytes 536870912 --max-fds 4096 --max-matches 131072 --audit
root         121       1  0 07:47 ?        00:00:00 /usr/lib/systemd/systemd-logind
root         124       1  0 07:47 ?        00:00:00 /usr/sbin/NetworkManager --no-daemon
root         130     124  0 07:47 ?        00:00:00 /usr/sbin/dhclient -d -q -sf /usr/libexec/nm-dhcp-helper -pf /run/NetworkManager/dhclient-eth0.pid -lf /var/lib/NetworkManager/dhclient-e1b0edb5-5f60-3706-8c6a-3b5f1440a72c-eth0.lease -cf /var/lib/NetworkManager/dhclient-e
root         144       1  0 07:47 pts/0    00:00:00 /sbin/agetty -o -p -- \u --noclear --keep-baud - 115200,38400,9600 vt220
root         146       1  0 07:47 pts/1    00:00:00 /sbin/agetty -o -p -- \u --noclear - vt220
root         148       1  0 07:47 pts/2    00:00:00 /sbin/agetty -o -p -- \u --noclear - vt220
root         149       1  0 07:47 pts/3    00:00:00 /sbin/agetty -o -p -- \u --noclear - vt220
root         150       1  0 07:47 pts/4    00:00:00 /sbin/agetty -o -p -- \u --noclear - vt220
root         152       1  0 07:47 ?        00:00:00 /usr/sbin/crond -n
root         159       1  0 07:47 ?        00:00:00 /usr/sbin/rsyslogd -n
root         530       1  0 08:01 ?        00:00:00 /usr/sbin/anacron -s
root         553       1  0 08:04 ?        00:00:00 sshd: /usr/sbin/sshd -D [listener] 0 of 10-100 startups
root         590       0  0 08:06 pts/5    00:00:00 /bin/bash
root         614     590  0 08:08 pts/5    00:00:00 ps -ef
- 停止容器
root@zzy-virtual-machine:~# lxc-stop centos9
root@zzy-virtual-machine:~# lxc-ls -f
NAME    STATE   AUTOSTART GROUPS IPV4 IPV6 UNPRIVILEGED
centos9 STOPPED 0         -      -    -    false
- 删除容器
root@zzy-virtual-machine:~# lxc-destroy -n centos9
root@zzy-virtual-machine:~# lxc-ls -f
root@zzy-virtual-machine:~#
总结: 通过 lxc 完成容器的创建, 认识到 docker 并不是唯一的容器实现, 自 docker 0.9 版本起, docker 除了继续支持 LXC 外, 还开始引入自家的 libcontainer, 试图打造更通用的底层容器虚拟化库。如今的 docker 基本上都已经是使用 libcontainer 而非 LXC 了