xlsx-js-style 操作 Excel 文件样式
xlsx-js-style操作 Excel 文件样式
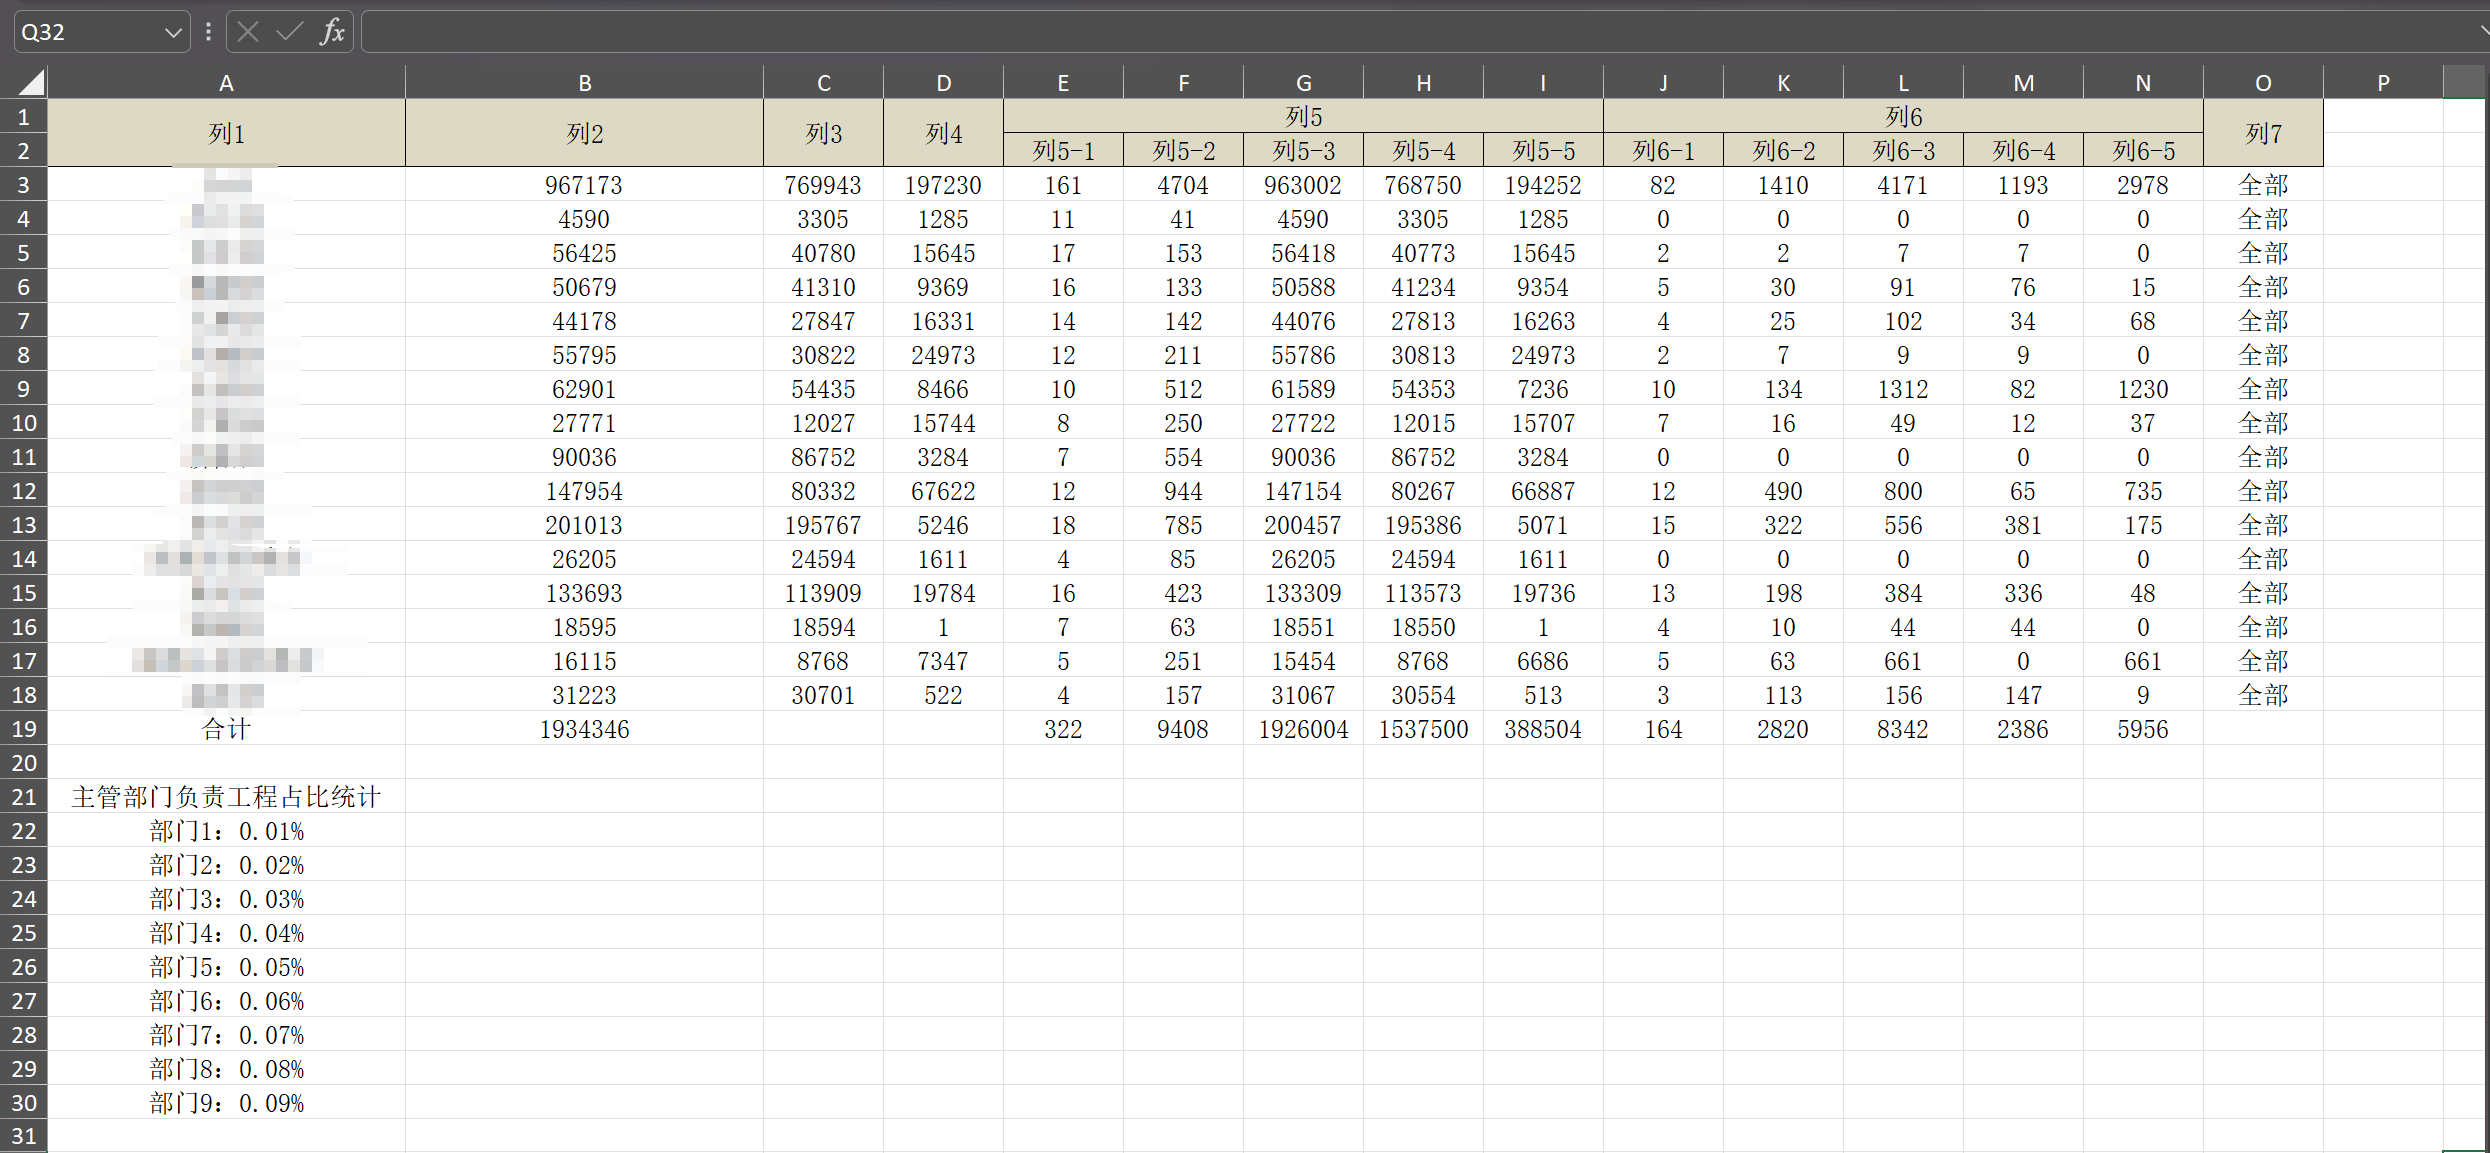
- excel文件内容效果图
- xlsx-js-style 插件
- 插件描述
- 主要功能(样式支持)
- vue中使用xlsx-js-style
- 安装
- 基于xlsx-js-style插件封装的工具函数
- 组件中使用工具函数实现导出excel功能
- 注意
- 替代方案
excel文件内容效果图
xlsx-js-style 插件
插件描述
xlsx-js-style 是一个用于增强 SheetJS (也称 xlsx) 库功能的开源 JavaScript 库,它允许开发者在使用 SheetJS 生成或操作 Excel 文件(.xlsx)时,添加单元格
样式,而原生的 SheetJS 库对样式的支持非常有限。
主要功能(样式支持)
通过 xlsx-js-style,你可以为 Excel 单元格设置以下样式:
- 字体样式:字体名称、大小、颜色、加粗、斜体、下划线等
- 对齐方式:水平对齐(左、中、右)、垂直对齐(上、中、下)、自动换行
- 边框:上下左右边框的样式和颜色
- 填充(背景色):纯色填充、渐变填充
- 数字格式:日期、货币、百分比等格式化
- 合并单元格:支持带样式的合并
vue中使用xlsx-js-style
安装
npm install xlsx-js-style
基于xlsx-js-style插件封装的工具函数
// @/utils/exportExcel.js
import XLSX from "xlsx-js-style";/*** 使用方式:*      Excel.export(columns, dataSource, "文件名")  // 前两个入参为 el-table 组件的同名属性值*      支持通过 columns 中的 show 属性控制是否导出该字段*      当 show: false 时,该字段将不会被导出到 Excel 中** 使用示例:*      const columns = [*        { title: '姓名', dataIndex: 'name' },*        { title: '年龄', dataIndex: 'age', show: false },  // 该字段不会被导出*        { title: '性别', dataIndex: 'sex' }*      ]** 注意:*      有的版本库可能支持颜色名(如 red),但为了确保兼容性和稳定性,建议使用十六进制颜色代码(如 #FF0000)*/
const Excel = {/*** @param columns       使用  el-table 组件时的 columns 数据 格式:[{ title: '地区', dataIndex: 'districtName' },{ title: '名称' ,children[{ title: '年龄', dataIndex: 'age' }, { title: '性别', dataIndex: 'sex' }]* @param dataSource    使用  el-table 组件时的 data-source 数据* @param fileName      excel导出时的文件名*/export(columns, dataSource, fileName) {console.log("Excel.export 调用参数:", { columns, dataSource, fileName });const columnHeight = this.columnHeight(columns);const columnWidth = this.columnWidth(columns);console.log("列高度和宽度:", { columnHeight, columnWidth });const header = [];for (let rowNum = 0; rowNum < columnHeight; rowNum++) {header[rowNum] = [];for (let colNum = 0; colNum < columnWidth; colNum++) {header[rowNum][colNum] = "";}}let offset = 0;const mergeRecord = [];for (const item of columns) {this.generateExcelColumn(header, 0, offset, item, mergeRecord);offset += this.treeWidth(item);}console.log("生成的表头:", header);const dataArray = this.jsonDataToArray(columns, dataSource);console.log("转换后的数据数组:", dataArray);header.push(...dataArray);console.log("最终的数据结构:", header);const ws = this.aoa_to_sheet(header, columnHeight);ws["!merges"] = mergeRecord;// 头部冻结ws["!freeze"] = {xSplit: "1",ySplit: "" + columnHeight,topLeftCell: "B" + (columnHeight + 1),activePane: "bottomRight",state: "frozen",};// 列宽ws["!cols"] = [{ wpx: 165 }, { wpx: 165 }]; //设定前两列列宽const wb = XLSX.utils.book_new();XLSX.utils.book_append_sheet(wb, ws, "sheet1");XLSX.writeFile(wb, fileName + ".xlsx");},aoa_to_sheet(data, headerRows) {const ws = {};const range = { s: { c: 10000000, r: 10000000 }, e: { c: 0, r: 0 } };// 遍历步骤1里面的二维数组数据for (let R = 0; R !== data.length; ++R) {for (let C = 0; C !== data[R].length; ++C) {if (range.s.r > R) {range.s.r = R;}if (range.s.c > C) {range.s.c = C;}if (range.e.r < R) {range.e.r = R;}if (range.e.c < C) {range.e.c = C;}// / 构造cell对象,对所有excel单元格使用如下样式let cell;if (typeof data[R][C] === "object" &&data[R][C] !== null &&data[R][C].v !== undefined) {// 此处预留了自定义设置样式的功能,通过重写recursiveChildrenData方法,可为每一个单元格传入样式属性cell = data[R][C];} else {// 处理 null、undefined 等值,转换为空字符串,但保持数据传递const cellValue =data[R][C] === null || data[R][C] === undefined ? "" : data[R][C];cell = {v: cellValue,s: {font: { name: "宋体", sz: 11, color: { auto: 1 } },// 单元格对齐方式alignment: {// / 自动换行wrapText: 1,// 水平居中horizontal: "center",// 垂直居中vertical: "center",},},};}// 头部列表加边框if (R < headerRows) {cell.s.border = {top: { style: "thin", color: { rgb: "000000" } },left: { style: "thin", color: { rgb: "000000" } },bottom: { style: "thin", color: { rgb: "000000" } },right: { style: "thin", color: { rgb: "000000" } },};// 背景色cell.s.fill = {patternType: "solid",fgColor: { rgb: "DDD9C4" },bgColor: { rgb: "8064A2" },};}// 合计行加边框和背景色if (R === data.length - 1 && data[R][0] === "合计") {cell.s.border = {top: { style: "thin", color: { rgb: "000000" } },left: { style: "thin", color: { rgb: "000000" } },bottom: { style: "thin", color: { rgb: "000000" } },right: { style: "thin", color: { rgb: "000000" } },};// 给合计行一个不同的背景色cell.s.fill = {patternType: "solid",fgColor: { theme: 2, tint: 0.3999755851924192, rgb: "C6EFCE" },bgColor: { theme: 2, tint: 0.3999755851924192, rgb: "C6EFCE" },};// 合计行字体加粗cell.s.font = {name: "宋体",sz: 11,color: { auto: 1 },bold: true,};}const cell_ref = XLSX.utils.encode_cell({ c: C, r: R });// 该单元格的数据类型,只判断了数值类型、布尔类型,字符串类型,省略了其他类型// 自己可以翻文档加其他类型if (typeof cell.v === "number") {cell.t = "n";} else if (typeof cell.v === "boolean") {cell.t = "b";} else {cell.t = "s";}ws[cell_ref] = cell;}}if (range.s.c < 10000000) {ws["!ref"] = XLSX.utils.encode_range(range);}return ws;},generateExcelColumn(columnTable,rowOffset,colOffset,columnDefine,mergeRecord) {// 如果设置了 show: false,则不生成该列if (columnDefine.show === false) {return;}const columnWidth = this.treeWidth(columnDefine);columnTable[rowOffset][colOffset] = columnDefine.title;if (columnDefine.children) {mergeRecord.push({s: { r: rowOffset, c: colOffset },e: { r: rowOffset, c: colOffset + columnWidth - 1 },});let tempOffSet = colOffset;for (const child of columnDefine.children) {this.generateExcelColumn(columnTable,rowOffset + 1,tempOffSet,child,mergeRecord);tempOffSet += this.treeWidth(child);}} else {if (rowOffset !== columnTable.length - 1) {mergeRecord.push({s: { r: rowOffset, c: colOffset },e: { r: columnTable.length - 1, c: colOffset },});}}},columnHeight(column) {let height = 0;for (const item of column) {height = Math.max(this.treeHeight(item), height);}return height;},columnWidth(column) {let width = 0;for (const item of column) {width += this.treeWidth(item);}return width;},treeHeight(root) {if (root) {if (root.children && root.children.length !== 0) {let maxChildrenLen = 0;for (const child of root.children) {maxChildrenLen = Math.max(maxChildrenLen, this.treeHeight(child));}return 1 + maxChildrenLen;} else {return 1;}} else {return 0;}},treeWidth(root) {if (!root) return 0;// 如果设置了 show: false,则不计算该列宽度if (root.show === false) return 0;if (!root.children || root.children.length === 0) return 1;let width = 0;for (const child of root.children) {width += this.treeWidth(child);}return width;},jsonDataToArray(column, data) {const dataIndexes = [];for (const item of column) {dataIndexes.push(...this.getLeafDataIndexes(item));}return this.recursiveChildrenData(dataIndexes, data);},recursiveChildrenData(columnIndex, data) {const result = [];for (const rowData of data) {const row = [];for (const index of columnIndex) {// 确保 null 和 undefined 值被转换为空字符串const value =rowData[index] === null || rowData[index] === undefined? "": rowData[index];row.push(value);}result.push(row);if (rowData.children) {result.push(...this.recursiveChildrenData(columnIndex, rowData.children));}}return result;},getLeafDataIndexes(root) {const result = [];if (root.children) {for (const child of root.children) {result.push(...this.getLeafDataIndexes(child));}} else {// 如果设置了 show: false,则不导出该字段if (root.show !== false) {result.push(root.dataIndex);}}return result;},
};
export default Excel;
组件中使用工具函数实现导出excel功能
// 关键代码
<template><el-buttontype="warning"plainicon="el-icon-download"size="mini"@click="handleExport">导出</el-button><!-- 列表 --><el-tablev-loading="loading":data="tableList"show-summary:summary-method="getSummaries"><el-table-column label="序号" align="center" prop="seq" /><el-table-column label="列1" align="center" prop="administrativeArea" /><el-table-column label="列2" align="center" prop="totalHouseholds" /><el-table-column label="列3" align="center" prop="gasReplacementCoal" /><el-table-columnlabel="列4"align="center"prop="electricityReplacementCoal"/><el-table-column label="列5" align="center"><el-table-columnlabel="列5-1"align="center"prop="decentralizedTownshipCount"/><el-table-columnlabel="列5-2"align="center"prop="decentralizedVillageCount"/><el-table-columnlabel="列5-3"align="center"prop="decentralizedTotal"/><el-table-columnlabel="列5-4"align="center"prop="decentralizedNaturalGas"/><el-table-columnlabel="列5-5"align="center"prop="decentralizedElectricity"/></el-table-column><el-table-column label="列6" align="center"><el-table-columnlabel="列6-1"align="center"prop="committeeTownshipCount"/><el-table-columnlabel="列6-2"align="center"prop="committeeVillageCount"/><el-table-column label="列6-3" align="center" prop="committeeTotal" /><el-table-columnlabel="列6-4"align="center"prop="committeeNaturalGas"/><el-table-columnlabel="列6-5"align="center"prop="committeeElectricity"/></el-table-column><el-table-column label="列7" align="center" prop="type"><template slot-scope="scope"><dict-tag:options="dict.type.ledger_type":value="scope.row.type"/></template></el-table-column></el-table>
</template><script>
import Excel from "@/utils/exportExcel.js"; // 引入工具函数
export default {name: "ExportExcel",dicts: ["ledger_type"],data() {return {tableList: [], //列表数据 }},computed: {currentDate() {const now = new Date();const year = now.getFullYear();const month = now.getMonth() + 1;return `${year}年${month}月`;},},methods: {/** 导出按钮操作 */handleExport() {// 定义导出的列结构const columns = [{title: "列1",dataIndex: "administrativeArea",},{title: "列2",dataIndex: "totalHouseholds",},{title: "列3",dataIndex: "gasReplacementCoal",},{title: "列4",dataIndex: "electricityReplacementCoal",},{title: "列5",children: [{title: "列5-1",dataIndex: "decentralizedTownshipCount",},{title: "列5-2",dataIndex: "decentralizedVillageCount",},{title: "列5-3",dataIndex: "decentralizedTotal",},{title: "列5-4",dataIndex: "decentralizedNaturalGas",},{title: "列5-5",dataIndex: "decentralizedElectricity",},],},{title: "列6",children: [{title: "列6-1",dataIndex: "committeeTownshipCount",},{title: "列6-2",dataIndex: "committeeVillageCount",},{title: "列6-3",dataIndex: "committeeTotal",},{title: "列6-4",dataIndex: "committeeNaturalGas",},{title: "列6-5",dataIndex: "committeeElectricity",},],},{title: "列7",dataIndex: "type",},];// 生成合计行数据const summaryData = this.generateSummaryData();// 生成占比统计数据const percentageData = this.generatePercentageData();// 深拷贝table数据const tableData = structuredClone(this.tableList);// 将字典项转换为对象,以 value 为键,label 为值const typeMap = {};this.dict.type.ledger_type.forEach((type) => {typeMap[type.value] = type.label;});// 使用 map 方法对 tableData中匹配字典项数据进行处理const result = tableData.map((item) => {return {...item,type: typeMap[item.type] || "", // 如果没有匹配到,type 赋值为空字符串};});// 将合计行和占比统计添加到数据末尾const exportData = [...result, summaryData, ...percentageData];// 调用导出方法Excel.export(columns, exportData, `测试_${this.currentDate}`);},// table合计行getSummaries(param) {const { columns, data } = param;const sums = [];// 指定需要合计的列的属性const propertiesToSum = ["totalHouseholds","decentralizedTownshipCount","decentralizedVillageCount","decentralizedTotal","decentralizedNaturalGas","decentralizedElectricity","committeeTownshipCount","committeeVillageCount","committeeTotal","committeeNaturalGas","committeeElectricity",];columns.forEach((column, index) => {if (index === 1) {sums[index] = "合计";return;}if (propertiesToSum.includes(column.property)) {const values = data.map((item) => {const value = item[column.property];return typeof value === "number" ? Number(value) : undefined;});if (values.every((value) => typeof value === "number")) {sums[index] = values.reduce((prev, curr) => prev + curr, 0);} else {sums[index] = "";}} else {sums[index] = "";}});return sums;},// 生成合计行数据generateSummaryData() {const summaryData = {};// 第一列显示"合计"summaryData.administrativeArea = "合计";// 计算各列的合计值const columns = ["totalHouseholds","decentralizedTownshipCount","decentralizedVillageCount","decentralizedTotal","decentralizedNaturalGas","decentralizedElectricity","committeeTownshipCount","committeeVillageCount","committeeTotal","committeeNaturalGas","committeeElectricity",];columns.forEach((column) => {const sum = this.tableList.reduce((acc, item) => {return acc + (Number(item[column]) || 0);}, 0);summaryData[column] = sum;});return summaryData;},// 生成占比统计数据generatePercentageData() {const percentageData = [];// 添加空行percentageData.push({administrativeArea: "",});// 添加标题行percentageData.push({administrativeArea: "主管部门负责工程占比统计",});// 添加各部门占比数据percentageData.push({administrativeArea: `部门1:0.01%`,});percentageData.push({administrativeArea: `部门2:0.02%`,});percentageData.push({administrativeArea: `部门3:0.03%`,});percentageData.push({administrativeArea: `部门4:0.04%`,});percentageData.push({administrativeArea: `部门5:0.05%`,});percentageData.push({administrativeArea: `部门6:0.06%`,});percentageData.push({administrativeArea: `部门7:0.07%`,});percentageData.push({administrativeArea: `部门8:0.08%`,});percentageData.push({administrativeArea: `部门9:0.09%`,});return percentageData;}},
}
</script>
注意
xlsx-js-style 并非官方维护,是社区项目,可能在新版本 SheetJS 中出现兼容性问题。
替代方案
exceljs:功能更强大、维护更活跃的 Excel 操作库,原生支持样式、图表、公式等,推荐用于新项目。