Qt QLegend详解
1、概述
QLegend 是 Qt 图表模块(Qt Charts)中用于显示图表图例的类,它通常与 QChart 配合使用,用于解释图表中不同系列(series)的标识、颜色和样式等信息。图例能够帮助用户快速理解图表中各个数据系列的含义,是数据可视化中不可或缺的组成部分。
QLegend 可以通过 QChart 的 legend () 方法获取,它支持自定义外观、位置、布局方向等属性,并且可以根据需要显示或隐藏特定系列的图例项。
2、重要方法
void setVisible(bool visible):设置图例是否可见bool isVisible() const:判断图例是否可见void setAlignment(Qt::Alignment alignment):设置图例在图表中的对齐方式(如 Qt::AlignTop、Qt::AlignRight 等)Qt::Alignment alignment() const:获取当前对齐方式void setDirection(QLegend::Direction direction):设置图例项的排列方向(水平或垂直)QLegend::Direction direction() const:获取当前排列方向void setColor(QColor color):设置图例背景颜色QColor color() const:获取图例背景颜色void setBorderColor(QColor color):设置图例边框颜色QColor borderColor() const:获取图例边框颜色void setFont(const QFont &font):设置图例文本字体QFont font() const:获取当前字体void setLabelColor(QColor color):设置图例文本颜色QColor labelColor() const:获取文本颜色void markers(QAbstractSeries *series):获取指定系列对应的标记集合void setMaximumHeight(int height):设置最大高度void setMaximumWidth(int width):设置最大宽度void setMinimumHeight(int height):设置最小高度void setMinimumWidth(int width):设置最小宽度
3、常用枚举
QLegend::Direction:定义图例项的排列方向QLegend::TopToBottom:垂直排列(从上到下)QLegend::LeftToRight:水平排列(从左到右)
QLegendMarker::Type:定义图例标记的类型,与对应的图表系列类型一致QLegendMarker::LegendMarkerTypeArea:面积图系列标记QLegendMarker::LegendMarkerTypeBar:柱状图系列标记QLegendMarker::LegendMarkerTypeLine:线图系列标记QLegendMarker::LegendMarkerTypePie:饼图系列标记QLegendMarker::LegendMarkerTypeScatter:散点图系列标记
4、C++ 实例
#include <QApplication>
#include <QtCharts/QChartView>
#include <QtCharts/QLineSeries>
#include <QtCharts/QValueAxis>
#include <QtCharts/QAreaSeries>
#include <QLegend>
#include <QHCandlestickModelMapper>QT_CHARTS_USE_NAMESPACEint main(int argc, char *argv[])
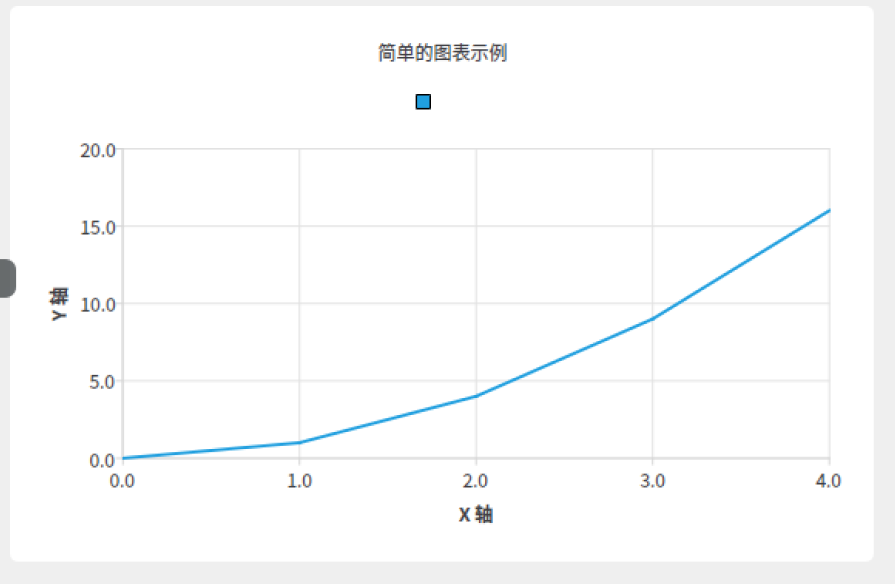
{QApplication a(argc, argv);// 创建一个线性数据系列QLineSeries *series = new QLineSeries();*series << QPointF(0, 0) << QPointF(1, 1) << QPointF(2, 4) << QPointF(3, 9) << QPointF(4, 16);// 创建图表对象QChart *chart = new QChart();chart->addSeries(series);// 设置图表的标题chart->setTitle("简单的图表示例");// 创建坐标轴并设置QValueAxis *axisX = new QValueAxis();axisX->setRange(0, 4);axisX->setTitleText("X 轴");QValueAxis *axisY = new QValueAxis();axisY->setRange(0, 20);axisY->setTitleText("Y 轴");chart->setAxisX(axisX, series);chart->setAxisY(axisY, series);// 启用图例QLegend *legend = chart->legend();legend->setVisible(true); // 设置图例可见// 创建图表视图,并将图表添加到视图中QChartView *chartView = new QChartView(chart);chartView->setRenderHint(QPainter::Antialiasing);// 创建窗口并设置窗口内容QWidget window;QVBoxLayout *layout = new QVBoxLayout();layout->addWidget(chartView);window.setLayout(layout);window.setWindowTitle("Qt 图表实例");window.resize(600, 400);window.show();return a.exec();
}

觉得有帮助的话,打赏一下呗。。


需要商务合作(定制程序)的欢迎私信!!