qt QCandlestickSet详解
1. 概述
QCandlestickSet 类表示烛台图中的单个烛台条目。创建烛台项目的图形表示需要五个值:open(开盘价)、high(最高价)、low(最低价)、close(收盘价)和timestamp(时间戳)。这些值可以传递给 QCandlestickSet 的构造函数,也可以使用 setOpen()、setHigh()、setLow()、setClose() 和 setTimestamp() 进行设置。
2. 重要方法
QCandlestickSet(qreal open, qreal high, qreal low, qreal close, qreal timestamp = 0.0, QObject *parent = nullptr):构造具有给定值的烛台项目。QCandlestickSet(qreal timestamp = 0.0, QObject *parent = nullptr):构造一个带有可选的烛台项目。
setOpen(qreal open):设置条目的开盘价。open():获取条目的开盘价。setClose(qreal close):设置条目的收盘价。close():获取条目的收盘价。setHigh(qreal high):设置条目的最高价。high():获取条目的最高价。setLow(qreal low):设置条目的最低价。low():获取条目的最低价。setTimestamp(qreal timestamp):设置条目的时间戳。timestamp():获取条目的时间戳。setPen(const QPen &pen):设置条目的画笔。pen():获取条目的画笔。setBrush(const QBrush &brush):设置条目的画刷。brush():获取条目的画刷。
3. 信号
brushChanged():当烛台项目画笔发生变化时发出此信号。clicked():当点击烛台项目时发出此信号。closeChanged():当烛台项目收盘价发生变化时发出此信号。doubleClicked():当用户双击烛台项目时发出此信号。hovered(bool status):当鼠标悬停在烛台项目上时会发出此信号。highChanged():当烛台项目高值发生变化时发出此信号。lowChanged():当烛台项目低值发生变化时发出此信号。openChanged():当烛台项目开盘价变化时发出此信号。timestampChanged():当条目时间戳更改时,将发出此信号。
4. cpp实例
#include <QApplication>
#include <QtCharts/QChartView>
#include <QtCharts/QLineSeries>
#include <QtCharts/QValueAxis>
#include <QtCharts/QAreaSeries>
#include <QLegend>
#include <QLegendMarker>
#include <QFont>
#include <QBarSet>
QT_CHARTS_USE_NAMESPACEint main(int argc, char *argv[])
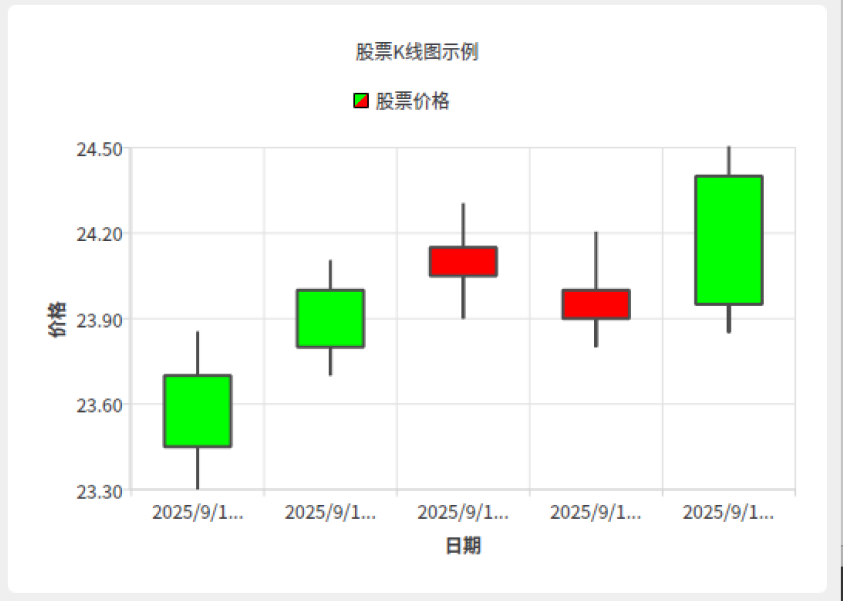
{QApplication a(argc, argv);// 创建K线系列QCandlestickSeries *series = new QCandlestickSeries();series->setName("股票价格");series->setIncreasingColor(QColor(Qt::green)); // 上涨K线颜色series->setDecreasingColor(QColor(Qt::red)); // 下跌K线颜色// 创建K线数据// 参数依次为:开盘价、最高价、最低价、收盘价、时间戳QCandlestickSet *set0 = new QCandlestickSet(23.45, 23.85, 23.30, 23.70, QDateTime::currentDateTime().addDays(-4).toMSecsSinceEpoch());QCandlestickSet *set1 = new QCandlestickSet(23.80, 24.10, 23.70, 24.00, QDateTime::currentDateTime().addDays(-3).toMSecsSinceEpoch());QCandlestickSet *set2 = new QCandlestickSet(24.15, 24.30, 23.90, 24.05, QDateTime::currentDateTime().addDays(-2).toMSecsSinceEpoch());QCandlestickSet *set3 = new QCandlestickSet(24.00, 24.20, 23.80, 23.90, QDateTime::currentDateTime().addDays(-1).toMSecsSinceEpoch());QCandlestickSet *set4 = new QCandlestickSet(23.95, 24.50, 23.85, 24.40, QDateTime::currentDateTime().toMSecsSinceEpoch());// 将K线添加到系列中series->append(set0);series->append(set1);series->append(set2);series->append(set3);series->append(set4);// 连接信号槽,处理K线点击事件QObject::connect(series, &QCandlestickSeries::clicked, [](QCandlestickSet *set) {qDebug() << "K线被点击:";qDebug() << "开盘价:" << set->open();qDebug() << "最高价:" << set->high();qDebug() << "最低价:" << set->low();qDebug() << "收盘价:" << set->close();});// 创建图表并添加系列QChart *chart = new QChart();chart->addSeries(series);chart->setTitle("股票K线图示例");chart->setAnimationOptions(QChart::SeriesAnimations);// 设置坐标轴chart->createDefaultAxes();chart->axisX()->setTitleText("日期");chart->axisY()->setTitleText("价格");// 创建图表视图并显示QChartView *chartView = new QChartView(chart);chartView->setRenderHint(QPainter::Antialiasing);chartView->resize(800, 600);chartView->show();return a.exec();
}

觉得有帮助的话,打赏一下呗。。


需要商务合作(定制程序)的欢迎私信!!