基于QCharView类封装绘制各种图表的示例(支持自画图形)
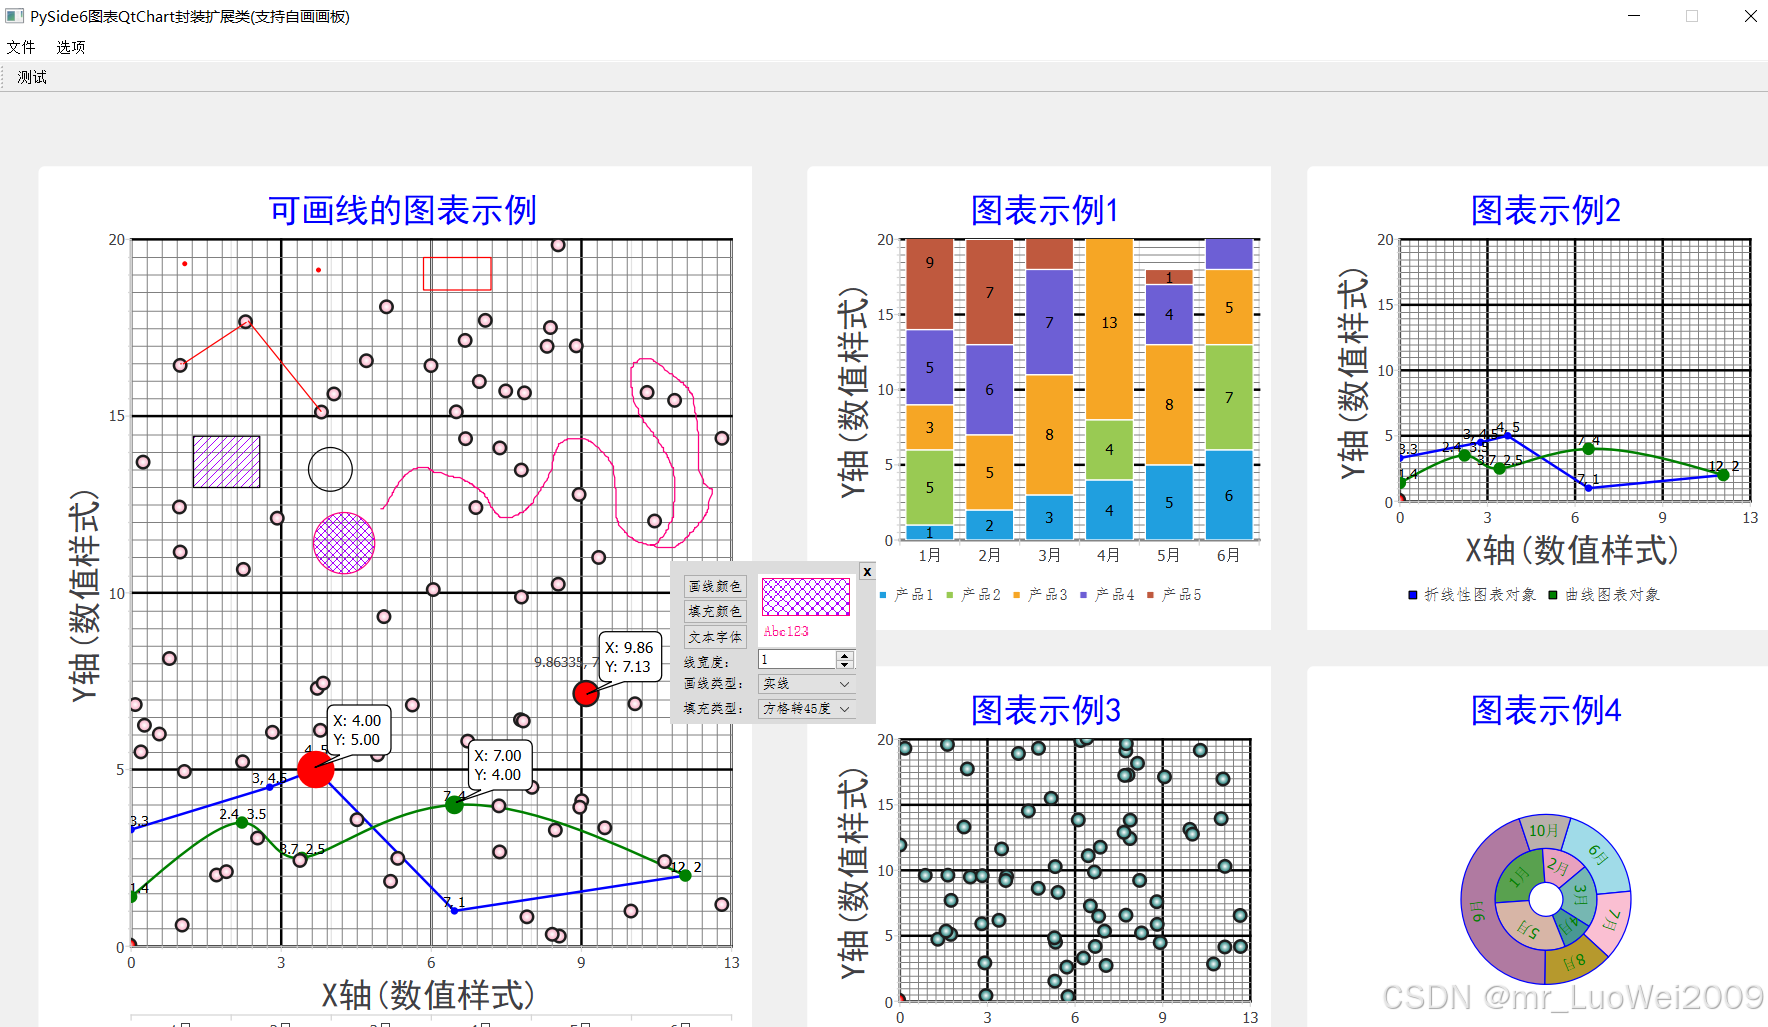
学习练习PySide6.QtCharts来绘制各种2D图表时,将可绘制的各种图表:散点图、折线图、曲线图、直方图、饼图进行了一定的封装以方便使用,支持在同一视图中混和绘制上面的各种图表。同时增加了对散点、折线、曲线图可以实时捕捉点以显示类似于tooltip的指示牌,并可将此标记牌标记在图表视图上,还为图表视图增加了类似画板的功能,可以在图表视图上画出直线、矩形、圆形、文字(实时绘制)等,并可对增加绘制的各类图形实现了无限步数的撤消和重做功能。
示例pyside主窗口如下(同时创建了5个图表窗口,左侧大窗口同时显示了散点、折线、曲线三种图表,并手动画了一些直线等图形,画图形时请使用右键菜单):
主模块main.py代码如下:
# -*- coding: utf-8 -*-
import sys,os,time,random,copy,math
from math import *
from PySide6 import *
from PySide6.QtWidgets import *
from PySide6.QtCore import *
import PySide6.QtCharts
from PySide6.QtCore import (Signal, QEvent,Property, QSize,Qt, QTimer,Slot,QPoint,QPointF,QRectF,QDateTime)
from PySide6.QtGui import  (QCloseEvent, QCursor, QFocusEvent,QIcon,QImage)
from PySide6.QtGui import (QPen,QBrush,QColor,QFont, QPainter,QPixmap,QGradient,QSurface, QWindow,QSurfaceFormat,QMovie,QAction)
from PySide6.QtWidgets import (QDialog,QWidget, QFileDialog, QMainWindow, QMessageBox)
from PySide6.QtWidgets import (QApplication, QLabel,QCheckBox, QComboBox, QDialog, QLineEdit,QMenu, QPushButton,QGridLayout,QHBoxLayout,QVBoxLayout,QGroupBox)#from paintCanvas import *   #导入画布模块(基于QLabel类)
from charView2D import *    #导入图表视模块(基于QGraphicsView类)#========================================================================================
#定义主窗口类(继承自QMainWindow)
class paintWin(QMainWindow):  def __init__(self):super().__init__()#self.setGeometry(300, 300, 300, 200)self.resize(1600, 905)self.setMaximumSize(1428,905)self.setWindowTitle('PySide6图表QtChart封装扩展类(支持自画画板)')self.initUi()def initUi(self):# 创建状态栏self.statusbar = self.statusBar()self.statusbar.showMessage('准备')#...其他属性按默认值,本示例不修改chart_attrib=Achart(0,0,800,800)chart_attrib.titleName='图表示例'chart_attrib.view_x=self.x()chart_attrib.view_y=self.y()chart_attrib.view_width=self.width()chart_attrib.view_height=self.height()chart_attrib.chart_x=20        #相对self.char_Draw视的左上角位置chart_attrib.chart_y=20chart_attrib.chart_width=780    #此属性要同self._chart对象的最小和最大尺寸相关联显示不同效果,如要减小self._chart在视图中显示的范围,需要将最大的值设置为本值chart_attrib.chart_height=780   #同上#为达到图表视图中有多系列图形(图表项数据最大最小值不同)为防止视图中的坐标点同XY轴的坐标点无法对应,需提前设置XY轴,轴上的刻度应可以包含所有图表项的数据范围av_x1,av_x2,av_x3=AxyAxis(),AxyAxis(),AxyAxis() #初始化得到X轴全部默认值av_y1=AxyAxis()                                 #初始化得到y轴全部默认值#对X轴的轴网属性进行更改,未更改的采用原默认值av_x1.text='X轴(数值样式)'         av_x1.axis_type=chartType.axis_NUMBER   #axis_CATEGOR   axis_NUMBER  用0轴线应该用axis_NUMBER 类型av_x1.min=0                #更改设置X主轴最小值 此值变化时会造成线类图表不偏移,坐标标注不正确??????av_x1.max=13               #更改设置X主轴最大值av_x1.subNum=9             #更改设置X次轴每格数量(即两个放轴间再分9+1等份)av_x2.text='X轴(分组样式)'        av_x2.axis_type=chartType.axis_CATEGOR   #axis_CATEGOR   axis_NUMBERav_x2.min=0                #更改设置X主轴最小值 此值变化时会造成线类图表不偏移,坐标标注不正确??????av_x2.max=13               #更改设置X主轴最大值av_x2.subNum=9            #更改设置X次轴每格数量(即两个放轴间再分9+1等份)av_x2.lstGroupText=['1月','2月','3月','4月','5月','6月']  #用于axis_CATEGOR分组非数字类型图表 av_x3.text='X轴(分组样式)'  av_x3.lstGroupText=["1月", "2月", "3月"]av_x3.lstSubGroupText=['产品1','产品2']       av_x3.axis_type=chartType.axis_CATEGOR   #axis_CATEGOR   axis_NUMBER   newlstGroupText=[str(x) for x in range(len(av_x3.lstGroupText)*len(av_x3.lstSubGroupText))]  av_x3.lstGroupText=newlstGroupText#对Y轴的轴网属性进行更改,未更改的采用原默认值av_y1.text='Y轴(数值样式)'        av_y1.axis_type=chartType.axis_NUMBER #更改为y轴的数字类型轴线,用0轴线应该用axis_NUMBER 类型av_y1.min=0                           #更改设置y主轴最小值 此值变化时会造成线类图表不偏移,坐标标注不正确????????av_y1.max=20                          #更改设置y主轴最大值av_y1.subNum=9                        #更改设置y次轴每格数量(即两个放轴间再分9+1等份)av_y1.align=Qt.AlignLeft              #更改设置y轴在左侧#在窗体左侧:显示一个大点的图表chart_attrib.titleName='可画线的图表示例'self.charView0 = chartView2D_painter(self,chart_attrib)self.charView0.setGeometry(5, 76,600, 800)          #要本类视图在主窗口的位置(对view,不是对self.char_Draw)self.charView0.init_Axis_x(av_x1,av_x2)             #按程序类型初始化全部X轴网,XY轴均可初始化一个及以上的轴网 self.charView0.init_Axis_y(av_y1)                   #按程序类型初始化全部Y轴网,XY轴均可初始化一个及以上的轴网 self.charView0._set_ToolTips()                      #让图表支持显示类似tooltip样式的坐标指示(也可固定到图表上)self.charView0.demo(True,[0,1,3,4,])               #要用True参数,应保证初始化轴线的方法中,第1项参数必须是数字类型,init_Axis_x(av_x1,av_x2.......),否则有些代码处理可能存在不理解#self.charView0._set_legendLabelCol(None,None)      #1参数为None时,表示全部图例文本颜色同图例颜色  2参数为None时表示图例文本不要背景#self.charView0.create_order_series([1,3,4,2])       #按指定顺序重新排序图表项序列(在列越前越后画,即画在面上),对固定采用0序列为固定坐标轴的,程序后自动将0调到最前载入self_chart中(最先画在但在最底层)#self.charView0.setSeries_show(4,False)              #当前ID=4时是散点系列对象,此代码将使其不显示,ID=4#在窗体右侧:分成田字格,测试显示4个图表chart_attrib.titleName='图表示例1'self.charView1 = chartView2D(self,chart_attrib)self.charView1.setGeometry(620, 76, 400, 400)                  #要本类视图在主窗口的位置(对view,不是对self.char_Draw)       self.charView1.init_Axis_x(av_x2)   self.charView1.init_Axis_y(av_y1)                    self.charView1.demo(False,[2])                                 #调用示例画出各种类型图表:必须在上行设置轴线网格后调用chart_attrib.titleName='图表示例2'self.charView2 = chartView2D(self,chart_attrib)self.charView2.setGeometry(620+400, 76, 400, 400)                   self.charView2.init_Axis_x(av_x1)   self.charView2.init_Axis_y(av_y1)  self.charView2.demo(True,[1,3])                   chart_attrib.titleName='图表示例3'self.charView3 = chartView2D(self,chart_attrib)self.charView3.setGeometry(620, 76+400, 400, 400)                   self.charView3.init_Axis_x(av_x1)   self.charView3.init_Axis_y(av_y1)  self.charView3.demo(True,[0,4])      chart_attrib.titleName='图表示例4'self.charView4 = chartView2D(self,chart_attrib)self.charView4.setGeometry(620+400, 76+400, 400, 400)                   #self.charView4.init_Axis_x(av_x2)   #对饼图可不设置轴线#self.charView4.init_Axis_y(av_y1)   self.charView4.demo(False,[5])                 #创建工具栏各按纽控件(并绑定信号到槽函数上)toolBar1_test = QAction(QIcon('t02.png'), '测试', self)toolBar1_test.setShortcut('Ctrl+T')toolBar1_test.triggered.connect(self.toolBar1_Test)self.toolbar = self.addToolBar('测试工具栏')self.toolbar.setToolButtonStyle(Qt.ToolButtonTextUnderIcon)self.toolbar.addAction(toolBar1_test)#同时定义一菜单对象menubar = self.menuBar()fileMenu = menubar.addMenu('文件')menu_New = QAction('保存画板', self)menu_New.setStatusTip('在状态栏上显示内容:将当前画板中的图像保存到文件')fileMenu.addAction(menu_New)menu_Load = QMenu('导入', self)subMenu_LoadImg= QAction('导入图像', self)subMenu_LoadImg.setStatusTip('在状态栏上显示内容:导入一外部图形文件到画板')menu_Load.addAction(subMenu_LoadImg)fileMenu.addMenu(menu_Load)mnu_Exit = QAction(QIcon("t08.png"),'退出程序',self)mnu_Exit.setShortcut("ctrl+Q")  mnu_Exit.setStatusTip('在状态栏上显示内容:退出程序')mnu_Exit.triggered.connect(app.quit)fileMenu.addAction(mnu_Exit)sta = self.statusBar()       # 本例创建了一个行为菜单。这个行为/动作能切换状态栏显示或者隐藏。menu_View = menubar.addMenu('选项')viewStatAct = QAction('显示/隐藏状态栏', self, checkable=True)viewStatAct.setStatusTip('在状态栏上显示内容:视图菜单->显示/隐藏状态栏')        # 用checkable选项创建一个能选中的菜单。viewStatAct.setChecked(True)        # 默认设置为选中状态menu_View.addAction(viewStatAct)def toolBar1_Test(self):print('你单击了工具栏上的一个按纽')#在菜单事件中:定义一右键菜单def contextMenuEvent(self, event):cmenu = QMenu(self)act_New = cmenu.addAction("新建")   #仅示例,新建时不对已画图形作保存等处理,直接清空画板,余同print(act_New)act_Open = cmenu.addAction("打开")print(act_Open)act_Quit = cmenu.addAction("退出")print(act_Quit)#关联菜单信号对象action = cmenu.exec_(self.mapToGlobal(event.pos()))#处理对应菜单的响应函数if action == act_Quit:app.quit()            #仅示例,退出时不对是否保存图像作细化处理elif action == act_Open:print('打开')           #仅示例,没有具体功能代码,自行完善elif action == act_New:print('新建')#对应主菜单:视图-->显示/隐藏状态栏的信号槽函数def toggleMenu(self, state):if state:self.statusbar.show()else:self.statusbar.hide()def closeEvent(self, event: QCloseEvent):if(self.charView0.setDlg is not None):self.charView0.setDlg.close()   #关闭可能打开的其他上浮窗口:画板设置属性窗口return super().closeEvent(event)#########################################################################################
if __name__ == '__main__':app = QApplication(sys.argv)form = paintWin()form.show()sys.exit(app.exec())
图表封装类模块chartView2D.py代码如下:
# -*- coding: utf-8 -*-
"""
chartView2D.py: 关联图表管理模块paintManager,根据用户要生成的2D图表要求类型,将图表数据转找来要绘制图形的数据,返回给paintManager管理模块以生成绘图脚本
"""
from __future__ import annotationsimport sys,os,time,random,copy,math
from random import randrange
from math import *
import sys
from PySide6.QtWidgets import (QApplication, QGraphicsScene, QGraphicsView,QGraphicsSimpleTextItem, QGraphicsItem,QGraphicsItemGroup)
from PySide6.QtWidgets import (QLabel,QCheckBox, QComboBox, QDialog, QLineEdit,QMenu, QPushButton,QGridLayout,QHBoxLayout,QVBoxLayout,QGroupBox)
from PySide6.QtCore import Qt, QPointF, QRectF, QRect,Slot,QPoint
from PySide6.QtCharts import (QChart, QLineSeries, QSplineSeries, QChartView, QXYSeries,QValueAxis,QAbstractSeries,QStackedBarSeries,QAbstractBarSeries,QBarCategoryAxis,QPieSeries, QBarSet,QBarSeries,QScatterSeries,QPieSlice,)
from PySide6.QtGui import QFocusEvent, QPaintEvent, QPainter, QFont, QFontMetrics, QPainterPath, QColor,QPen,QBrush,QPalette,QAction,QLinearGradient,QGradient,QRadialGradient
from PySide6.QtCore import QThread,QObject,Signal,QTimerfrom chartAttrib import *   #getPen,chartType,Achart,Apoint,Aline,AxyAxis,Abar,Apie   PointConfig = QXYSeries.PointConfiguration
from functools import partial
from painterSet import painterSet                        #导入UI子窗体设置画板属性模块(QWidgetg类型:可拖动)
#=================================================================================================================================================================
"""
所有图表类的基类charView2D:继承出以下子类
1、"""
class chartView2D(QChartView):      #原class chartView2D(QGraphicsView): QChartView继承自QGraphicsView"""基于PySide6.QtCharts的再次封装各种图表视图:本视图当前只定义了一个图表对象self._chart = QChart(),即一视一图表,可以主窗口中分几个视来定义不同的图表显示"""sign_sendDataToMain=Signal(list)          #自定义信号,向图表视类的父窗口(主模块窗体),发送相关数据(列表类型)def __init__(self,parent,chart_a):super().__init__(parent)self.chart_a=chart_a     #除参数外其他按默认值初始化全部图表视的属性值self.draw_Type=drawType.DRAW_LINEself.lstSeries=[]        #定义显示的图表构件组列表(每一组图表构件均为列表的一元素,方便管理)格式:[series,type,属性]self.lstPointLabels=[]   #所的点的标签[id,['x1,y1'],...]self.usePieIni=True      #对饼图使用计时动画self.sel_xyOffSet=0.1    #选择视图上的点的容许偏差值self.showInfoType=chartType.VIEW_SHOWXY  #在视图底部显视当前鼠标在视上移动时相对当前主XY轴的坐标值self.allAxis_x=[]        #所有x轴网self.allAxis_y=[]        #所有y轴网self.axisX_mainID=0      #默认x主轴网ID号为0self.axisY_mainID=0      #默认y主轴网ID号为0  self.legenCount=0       #当前加入到图表中的图例总数量(散点、折线、曲线每系列加1,直方图+每组数,饼图+各环环数)     self.point_tx=None     #如果鼠标在点系列或折线系列或曲线系列对象上移动时,会触发相关事件,如鼠标位置在线节点范围时,将忽略误差值,直接得到线节点的精确值self.point_ty=Noneself.sel_series=None   #当前选中的序列对象self.onSeries=False    #当前鼠标是否以图表中的某一序列对象上self.donuts = []       #用于控制饼图动画self.toolTips = []     #已通过单击视在视上加入了的提示框对象列表self._tooltip = None#创建渲染选项self.setRenderHint(QPainter.Antialiasing)           #抗锯齿self.setRenderHint(QPainter.RenderHint.Antialiasing)self.setRenderHint(QPainter.TextAntialiasing)       #self.setRenderHint(QPainter.SmoothPixmapTransform)  #平滑图象self.setVerticalScrollBarPolicy(self.chart_a.show_HScrollBar)     #关闭滚动条self.setHorizontalScrollBarPolicy(self.chart_a.show_VScrollBar)self.setOptimizationFlag(QGraphicsView.DontAdjustForAntialiasing,True)  #设置视图属性if(self.chart_a.view_drag): self.setDragMode(QGraphicsView.Drag)else:self.setDragMode(QGraphicsView.NoDrag)    #不支持拖放  self.setInteractive(True)self.setScene(QGraphicsScene(self))  self._initSign()  #初始化全部信号槽定义 self.itemGroup=self.scene().createItemGroup([])  #将其他QGraphicsItem对象装入此组中,以方便可以显示/不显示,暂没有使用,扩展功能用self.itemGroup.setVisible(True)                  #self.itemGroup组中的全部对象设置为显示#定义图表下的显示内容对象self.createChart()self._set_ButtomInfo()                 #设置底部显示信息部件(XY坐标)self.ani_timer = QTimer(self)self.ani_timer.timeout.connect(self.ani_chart)  self.ani_timer.start(2000)          #每2000毫秒运行一次, 创造饼图等动画效果self.setMouseTracking(True)         #设置鼠标追踪有效   def createChart(self):     """初始化创建图表"""self._chart = QChart()     #图表对象(一个图表对象可以对应多个图表项,如轴线,折线图、直方图等等),QChart父类为QGraphicsItem,同坐标标识类相同  self._set_title(self.chart_a.titleName,self.chart_a.titleFont,self.chart_a.titleCol) #设置标头self._chart.setAnimationOptions(QChart.SeriesAnimations)  #支持动画,禁用动画=QChar.NoAnimationself._chart.setAnimationOptions(QChart.AllAnimations)      #支持所有动画图表#处理self._chart在视图中的显示尺寸if(self.chart_a.chart_maxWidth>self.chart_a.chart_width):self.chart_a.chart_maxWidth=self.chart_a.chart_widthif(self.chart_a.chart_maxHeight>self.chart_a.chart_height):self.chart_a.chart_maxHeight=self.chart_a.chart_height self._chart.setMinimumSize(self.chart_a.chart_minWidth, self.chart_a.chart_minHeight) self._chart.setMaximumSize(self.chart_a.chart_maxWidth, self.chart_a.chart_maxHeight) self._chart.setGeometry(self.chart_a.chart_x,self.chart_a.chart_y,self.chart_a.chart_width,self.chart_a.chart_height)  self._set_legend(True)                 #是否显示图例self._chart.legend().setAlignment(Qt.AlignBottom)          #图例位置在底部self._chart.setAcceptHoverEvents(True)  #接受Hover事件 self._set_ToolTips()                   #设置一提示框样式的部件:移动主窗口中主动调用self.scene().addItem(self._chart)      #图表加入场景def _initSign(self):"""初始化绑定信号槽"""passdef _set_title(self,title='',titleFont=QFont("黑体",50,QFont.Bold),titleCol=QColor('blue')):"""设置图表的标题"""self._chart.setTitle(self.chart_a.titleName)         #图表顶部的标题内容self._chart.setTitleFont(titleFont)self.chart_a.titleFont=titleFontself._chart.setTitleBrush(titleCol)self.chart_a.titleCol=titleColdef init_Axis_x(self,*args):   """"                                                                                                        初始化图表视图背景Y轴及网格线,参数为轴网属性类对象,数量不限定,有一个参数增加一个轴网"""print(f'x轴网参数数量={len(args)},参数值={args}')for i in range(len(args)):av_x=args[i]axis_x=QValueAxis()if(av_x is None):  #采用默认X轴及网格线av_x=AxyAxis() #用默认属性值av_x.text='X轴'av_x.align=Qt.AlignBottomelse:#处理X轴样式           if(av_x.axis_type==chartType.axis_NUMBER):          #x轴为数字型轴网axis_x=QValueAxis()                              #定义x轴图表项axis_x.setTitleText(av_x.text)axis_x.setTitleFont(av_x.textFont)axis_x.setRange(av_x.min,av_x.max)axis_x.setLabelFormat(av_x.vformat)           #整数标签(如小数用"%.3f")#设置x轴网格线间距axis_x.setTickInterval(av_x.mainStep)            #设置主刻度间距axis_x.setMinorTickCount(av_x.subNum)            #每个主刻度上再分为几个子刻度axis_x.setGridLineVisible(av_x.mainVisable)      #主网格可见axis_x.setMinorGridLineVisible(av_x.subVisable)  #子网格可见#自定义网格线样式axis_x.setGridLinePen(av_x.mainPen)              #设置主网格线画笔类型,xMainpen=QPen类型如QPen(QColor('red'),1,Qt.SolidLine)axis_x.setMinorGridLinePen(av_x.subPen)          #设置子网格画笔类型  elif(av_x.axis_type==chartType.axis_CATEGOR):        #x轴为分类文字标签axis_x=QBarCategoryAxis()                    #用默认分组类X轴线属性值axis_x.append(av_x.lstGroupText)              #分组标签self._chart.addAxis(axis_x,av_x.align)   #将x轴系列加入图表,xAttachAlign=Qt.AlignBottom等self.allAxis_x.append(axis_x)            #用列表保存x轴网引用  def init_Axis_y(self,*args):   """"                                                                                                        初始化图表视图背景X轴及网格线,参数为轴网属性类对象,数量不限定,有一个参数增加一个轴网"""print(f'Y轴网参数数量={len(args)},参数值={args}')for i in range(len(args)):av_y=args[i]axis_y=QValueAxis()if(av_y is None):  #采用默认X轴及网格线av_y=AxyAxis() #用默认属性值av_y.text='X轴'av_y.align=Qt.AlignLeftelse:#处理X轴样式           if(av_y.axis_type==chartType.axis_NUMBER):          #x轴为数字型轴网axis_y=QValueAxis()                        #定义x轴图表项axis_y.setTitleText(av_y.text)axis_y.setTitleFont(av_y.textFont)axis_y.setRange(av_y.min,av_y.max)axis_y.setLabelFormat(av_y.vformat)           #整数标签(如小数用"%.3f")#设置x轴网格线间距axis_y.setTickInterval(av_y.mainStep)            #设置主刻度间距axis_y.setMinorTickCount(av_y.subNum)            #每个主刻度上再分为几个子刻度axis_y.setGridLineVisible(av_y.mainVisable)      #主网格可见axis_y.setMinorGridLineVisible(av_y.subVisable)  #子网格可见#自定义网格线样式axis_y.setGridLinePen(av_y.mainPen)              #设置主网格线画笔类型,xMainpen=QPen类型如QPen(QColor('red'),1,Qt.SolidLine)axis_y.setMinorGridLinePen(av_y.subPen)          #设置子网格画笔类型  elif(av_y.axis_type==chartType.axis_CATEGOR):        #x轴为分类文字标签axis_y=QBarCategoryAxis()                    #用默认分组类X轴线属性值axis_y.append(av_y.lstGroupText)              #分组标签self._chart.addAxis(axis_y,av_y.align)   #将y轴系列加入图表,xAttachAlign=Qt.AlignBottom等self.allAxis_y.append(axis_y)            #用列表保存y轴网引用     def _set_legend(self,bVisible=True,legendFont=QFont("仿宋",9),align=Qt.AlignBottom):"""设置图例属性类型""" legend=self._chart.legend()if(bVisible):   legend.show()   #显示图例else:                              legend.hide()   #隐藏图例self.chart_a.show_legend=bVisiblelegend.setAlignment(align)self.chart_a.legend_align=alignlegend.setFont(legendFont)    self.chart_a.legendTxt_font=legendFontdef _set_legendLabelCol(self,legendCol=None,bkCol=None):"""设置图例的颜色,当legendCol=None时表时设置图例文本同图例颜色一致,bkCol为非None时,将图例文本加上底色"""legend=self._chart.legend()markers=legend.markers()if(legendCol is not None) :legend.setLabelColor(legendCol)self.chart_a.legendTxt_col=legendColelse:   #默认图例文本颜色同分配的图例颜色一致for marker in markers:series=marker.series()if(isinstance(series,(QLineSeries,QSplineSeries,QScatterSeries))):  #不加此判断,对直方图图表会报错color=series.color()marker.setLabelBrush(QColor(color))if(bkCol is not None):    #如果要设置图例文本的背景色legend.setBackgroundVisible(True)legend.setBrush(QColor(bkCol))self.chart_a.legendTxt_bkcol=bkColdef _set_ButtomInfo(self,buttomInfoType=chartType.VIEW_SHOWXY):""""为图表视底部区域设置要画出的信息"""self.showInfoType=buttomInfoTypeif(buttomInfoType==chartType.VIEW_SHOWXY):if(self.chart_a.show_buttonXY):                                #在图表底部显示鼠标移动时的转换成当前主坐标系的XY坐标self._coordX = QGraphicsSimpleTextItem(self._chart)        #标识文本对象:X坐标 self._coordX.setPos(self._chart.size().width() / 2 - 50, self._chart.size().height())self._coordX.setText("X= ")                                #图表底部x坐标文本  self._coordY = QGraphicsSimpleTextItem(self._chart)        #标识文本对象:Y坐标 self._coordY.setPos(self._chart.size().width() / 2 + 50, self._chart.size().height())self._coordY.setText("Y= ")                                #图表底部y坐标文本#elif(buttomInfoType==chartType.)   #扩展中。。。。。。def _set_ToolTips(self,type=0):"""为图表设置一个类似于提示框的部件,此部件可以固定到视上显示"""self.toolTips = []                          #已通过单击视在视上加入了的提示框对象列表if(len(self.allAxis_x)>0 and len(self.allAxis_y)>0):self._tooltip = charTooltip(self._chart,self.allAxis_x[0],self.allAxis_y[0])    #定义一个提示框对象  self._chart = QChart()def _getSeriesType(self,seriesObj):"""得到图表项对象的类型"""stype=Nonetype1=type(seriesObj)if type(seriesObj) is QBarSeries:stype=chartType.BARelif type(seriesObj) is QLineSeries:stype=chartType.LINEelif type(seriesObj) is QSplineSeries:stype=chartType.SPLINEelif type(seriesObj) is QPieSeries:stype=chartType.PIEelif type(seriesObj) is QScatterSeries:stype=chartType.SCATTER    return stype#右键菜单事件重载:定义一右键菜单def contextMenuEvent(self, event):cmenu = QMenu(self)act_test1 = cmenu.addAction("测试图表视内代码1")   #仅示例,新建时不对已画图形作保存等处理,直接清空画板,余同act_test2 = cmenu.addAction("测试图表视内代码2")#关联菜单信号对象action = cmenu.exec_(self.mapToGlobal(event.pos()))#处理对应菜单的响应函数if action == act_test1:print('\n=====测试代码1======')self.lstSeries[0].setMarkerSize(10)  #self.lstSeries[0].setOpacity(1.0)elif action == act_test2:print('\n=====测试代码2======')def _set_PointItem(self,ID=-1,bVisible=True,size=3,col=QColor('red'),bShowPointTxt=True):"""设置选择的点的属性:ID=-1时,所有点一同设置"""     IDcount=len(self.lstSeries)if(ID<=-1):for ID in range(IDcount):self.setOnePointItem(ID,bVisible,size,col,bShowPointTxt)elif(ID>=0 and ID<IDcount):self.setOnePointItem(ID,bVisible,size,col,bShowPointTxt)def setSeries_show(self,ID,showSeries=True):"""设置指定的序列series对象是否显示"""for lstseries in self.lstSeries:   #lstSeries格式:[series,type,属性]if(lstseries[2].ID==ID):lstseries[2].show=showSerieslstseries[0].setVisible(showSeries)def setItemGroup_show(self,showItems=True):"""设置加入到self.itemGroup中的QGraphicsItem对象是否显示/不显示"""self.itemGroup.setVisible(showItems)def setTooltip_show(self,showtooltip=True):"""设置鼠标移动到序列对象上时上否显示一类似于tooltip样式的提示框(单击时,此提示框会固定到图表视图上)"""self.chart_a.show_tooltip=showtooltipdef setOnePointItem(self,ID,bVisible=True,size=3,col=QColor('red'),bShowPointTxt=True):"""设置系列对象中的指定序号的点的显示属性"""self.lstSeries[ID].setPointsVisible(bVisible)pen=self.gf_getPen(col,size)self.lstSeries[ID].setPointLabelsColor(col)        def attach_series(self,series,axis_xID=-1,axis_yID=-1):"""将定的图表项序列关联指定的轴网"""if (axis_xID<len(self.allAxis_x) and axis_xID>=0):series.attachAxis(self.allAxis_x[axis_xID])     #关联到指定X轴else:print(f'指定的x轴网索引号不正确(一般是初始化轴线的数量不足,如只有一个轴线,但指定关联是其他轴线),没有将图表序列关联到轴网,可能不影响运行,请检查代码')if (axis_yID<len(self.allAxis_y) and axis_yID>=0):series.attachAxis(self.allAxis_y[axis_yID])     #关联到指定y轴else:print(f'指定的y轴网索引号不正确(一般是初始化轴线的数量不足,如只有一个轴线,但指定关联是其他轴线),没有将图表序列关联到轴网,可能不影响运行,请检查代码')#                                                     0               1                   2        def appendSeries_line(self,seriesDatas): #数据类型:['图表项名称',[QPointF(x,y),....],Aline属性类对象]"""增加一项折线图表项到图表视中"""series=QLineSeries()a_Line= seriesDatas[2]series.setName(seriesDatas[0])series.append(seriesDatas[1])                 #加入点数据集QPointF类型series.setPen(gf_getPen(a_Line.lineCol,a_Line.lineWidth,a_Line.lineType))              #设置画线颜色和线型线宽   series.setPointsVisible(a_Line.show_point)                  #是否显示点series.setMarkerSize(a_Line.pointSize)                       #点直径 series.setOpacity(a_Line.transparent)                        #点透明度   series.setPointLabelsVisible(a_Line.show_pointTxt)           #是否显示点文本          series.setPointLabelsColor(QColor(a_Line.pointTxtCol))       #点文本颜色 self._chart.addSeries(series)                                #新建的图表项加入图表中 a_Line.legendID=[self.legenCount]   #序列的属性记住本序列的图例在图表中的索引号self.legenCount+=1                  #加入的线序列,图例数加1 lst=[series,chartType.LINE,a_Line]self.lstSeries.append(lst)                                      #同时将此图表项加入形表中统一管理 if(a_Line.legendID[0]<self.legenCount and a_Line.legendID[0]>=0):marker=self._chart.legend().markers()[a_Line.legendID[0]]       #确定是否显示本序列的series的图例marker.setVisible(a_Line.show_legend) self.attach_series(series,a_Line.attchAxis_xID,a_Line.attchAxis_yID)    #使图表适合图表坐标轴项进行缩放以同坐标轴的数据刻度相符,不用此代码将会填满整个视而不管数据的关系series.clicked.connect(self.select_point)  #绑定点选点时的槽函数(选中点后,可以对点进行改变颜色,标志文字,点尺寸操作)series.clicked.connect(self.addOneTooltip) #单击直线图时:增加一个提示框对象到列表中#series.hovered.connect(self.show_tooltip)  #当靠近图表折线或曲线时触发信号槽series.hovered.connect(lambda point,state,series=series: self.show_tooltip(point,state,series))  #当靠近图表折线或曲线时触发信号槽def appendSeries_spline(self,seriesDatas): #数据类型:['图表项名称',[QPointF(x,y),....],Aspline属性类对象]"""增加一项曲线图表项到图表视中"""    series=QSplineSeries()a_spline= seriesDatas[2]series.setName(seriesDatas[0])series.append(seriesDatas[1])                 #加入点数据集QPointF类型series.setPen(gf_getPen(a_spline.lineCol,a_spline.lineWidth,a_spline.lineType))              #设置画线颜色和线型线宽   series.setPointsVisible(a_spline.show_point)                  #是否显示点series.setMarkerSize(a_spline.pointSize)                       #点直径 series.setOpacity(a_spline.transparent)                        #点透明度   series.setPointLabelsVisible(a_spline.show_pointTxt)           #是否显示点文本          series.setPointLabelsColor(QColor(a_spline.pointTxtCol))       #点文本颜色 self._chart.addSeries(series)              #新建的图表项加入图表中 a_spline.legendID=[self.legenCount]        #序列的属性记住本序列的图例在图表中的索引号self.legenCount+=1                         #加入的线序列,图例数加1 lst=[series,chartType.SPLINE,a_spline]self.lstSeries.append(lst)                 #同时将此图表项加入形表中统一管理if(a_spline.legendID[0]<self.legenCount and a_spline.legendID[0]>=0):marker=self._chart.legend().markers()[a_spline.legendID[0]]           #确定是否显示本序列的series的图例marker.setVisible(a_spline.show_legend) self.attach_series(series,a_spline.attchAxis_xID,a_spline.attchAxis_yID)     #使图表适合图表坐标轴项进行缩放以同坐标轴的数据刻度相符,不用此代码将会填满整个视而不管数据的关系series.clicked.connect(self.select_point)  #绑定点选点时的槽函数(选中点后,可以对点进行改变颜色,标志文字,点尺寸操作)series.clicked.connect(self.addOneTooltip) #单击直线图时:增加一个提示框对象到列表中#series.hovered.connect(self.show_tooltip)       #当靠近图表折线或曲线时触发信号槽series.hovered.connect(lambda point,state,series=series: self.show_tooltip(point,state,series))  #当靠近图表折线或曲线时触发信号槽def appendSeries_scatter(self,seriesDatas): #数据类型:#数据类型:['图表项名称',[QPointF(x,y),....],Apoint属性类对象]"""增加一项散点图表项到图表视中"""  series=QScatterSeries()a_point=seriesDatas[2]series.setName(seriesDatas[0])series.setMarkerSize(a_point.pointSize)  series.setColor(QColor(a_point.pointCol))series.append(seriesDatas[1])if(a_point.pointType==chartType.SCATTER_RECT):series.setMarkerShape(QScatterSeries.MarkerShapeRectangle)elif(a_point.pointType==chartType.SCATTER_REVRECT):series.setMarkerShape(QScatterSeries.MarkerShapeRotatedRectangle)    else:    #a_point.pointType==chartType.SCATTER_CIRCLEseries.setMarkerShape(QScatterSeries.MarkerShapeCircle)  #默认旋转45度#不支持设置旋转角度self._chart.addSeries(series)a_point.legendID=[self.legenCount]         #序列的属性记住本序列的图例在图表中的索引号self.legenCount+=1                         #加入的线序列,图例数加1lst=[series,chartType.SCATTER,a_point]self.lstSeries.append(lst)                  #同时将此图表项加入形表中统一管理if(a_point.legendID[0]<self.legenCount and a_point.legendID[0]>=0):marker=self._chart.legend().markers()[a_point.legendID[0]]    #确定是否显示本序列的series的图例marker.setVisible(a_point.show_legend)self.attach_series(series,a_point.attchAxis_xID,a_point.attchAxis_yID)      #使散点数据适合当前主XY坐标轴刻度比例if(a_point.usegradient):                    #使用渐变填充 self.set_gradient(series)               series.clicked.connect(self.select_point)  #绑定点选点时的槽函数(选中点后,可以对点进行改变颜色,标志文字,点尺寸操作)series.clicked.connect(self.addOneTooltip) #单击直线图时:增加一个提示框对象到列表中series.hovered.connect(lambda point,state,series=series: self.show_tooltip(point,state,series))  #当靠近图表折线或曲线时触发信号槽#                                                                                0               1                 2                       3                                                                4                                                           def appendSeries_Bar(self,seriesDatas,barType=chartType.BAR_H): #数据类型:['图表项名称',[1,'1月','2月'....],[0,range(0-15)],[['产品1','red',[1,2,3,4,5,6]],['产品2','green''[1,2,3,4,5,6]],[......]]],Abar属性类对象]"""增加一项直方图图表项到图表视中:直方图中每组中的每项数据采用横向或纵向拼叠"""xLabelType=seriesDatas[1][0]xLabel = seriesDatas[1][1:]yLabelType=seriesDatas[2][0]yLabel = seriesDatas[2][1:]if(barType==chartType.BAR_V):series = QStackedBarSeries()                #竖直堆叠样式直方图else:series = QBarSeries()                       #水平堆叠样式直方图a_bar=seriesDatas[4]series.setName(seriesDatas[0])series.setLabelsVisible(a_bar.labelVisible)  #数据标签是否显示series.setLabelsPosition(a_bar.labelPos)     #数据标签位置#a_bar.labelFormat="值:@value"   #标签格式为仅数据数字series.setLabelsFormat(a_bar.labelFormat)"""="数值:@value"                     #为数值增加其他说明文字="(@percent%)"                     #数据换算成百分比显示   QT6支持="{@barset}:@value"                #对有分组的图表,如直方图和饼图,同时显示分组名和数据名 QT6支持="{@barset}\n@value\n(@percent%)"  #组合显示 QT6支持"""for itemX in seriesDatas[3]:setN=QBarSet(itemX[0])   #X轴每项中的一个子项名称setN.append(itemX[2])    #对应此子项的在每项中的数据(如每月中本子类的值)series.append(setN)#setN.setLabel(f'图例标签...')     #设置每组中的单项图例标签文本值,这里不对初始值进行修改setN.hovered.connect(lambda _,state,series=series: self.show_tooltip(None,state,setN))  #当靠近图表折线或曲线时触发信号槽:无效果??????self._chart.addSeries(series)                              #所有图表项加入图表视a_bar.legendID=[x for x in range(self.legenCount,self.legenCount+a_bar.groupNumber)]         #序列的属性记住本序列的图例在图表中的索引号self.legenCount+=a_bar.groupNumber                         #加入的直方图序列,图例数加直方图的组数量self._chart.setAnimationOptions(QChart.SeriesAnimations)   #直方图以动画显示lst=[series,chartType.BAR,a_bar]self.lstSeries.append(lst)                                 #同时将此图表项加入形表中统一管理#设置重叠效果series.setBarWidth(0.8)for bar_set in series.barSets():bar_set.setLabelColor(Qt.black)for ID in a_bar.legendID:                            #对直方图,可能一图对应多个图例if(ID<len(self._chart.legend().markers()) and ID>=0):marker=self._chart.legend().markers()[ID]    #确定是否显示本序列的series的图例marker.setVisible(a_bar.show_legend)if(xLabelType==chartType.axis_CATEGOR):           #X轴: 分类标签:相对本直方图的标签(不是数量了)axis_x = QBarCategoryAxis()  av_x = AxyAxis()  av_x.axis_type= chartType.axis_CATEGOR av_x.align=Qt.AlignBottom            axis_x.append(xLabel) av_x.lstGroupText=xLabel               #相对原已有的X轴再增加一项X轴标签self.attach_series(series,a_bar.attchAxis_xID,a_bar.attchAxis_yID)             #关联ID=1号的X的轴线刻度:如没有默认数字轴网,将出错,要修改???????????????????#注意:如不调用下一行,因直方图为6个月即6项刻度填满X轴,原X轴为最大值为13,两者X刻度不对等,如直方图先建,图表默认X按直方图比例计算,会造成tooltip显示时将出现平移#如使用下一行,将会使直方图沿X轴压缩比列6/13,tooltip显示将会正常,建议先建刻度有关的图表项,再建直方图,防止上述问题              if(yLabelType==chartType.axis_NUMBER):                  #数值类标签axis_y = QValueAxis()                               #定义y轴:数值类标签av_y = AxyAxis()av_y.axis_type=chartType.axis_NUMBERav_y.align=Qt.AlignLeftaxis_y.setRange(float(yLabel[1]), float(yLabel[2]))                      #可以调整此范围,在series.attachAxis(axis_y)时,防止整个图形填满边界self.attach_series(series,a_bar.attchAxis_xID,a_bar.attchAxis_yID)       #关联ID=0号的主Y轴线刻度,本直方图沿Y向为数字,要同原已有的Y轴刻度数据保持一致比例,不能用def appendSeries_pie(self,seriesDatas): #数据类型:['饼图图表项',[[data5_1],[data5_2]...],Apie属性类对象] """增加一项饼图图表项到图表视中"""#数据格式=seriesDatas=['饼图图表项',[data5],Apie属性类对象] self.selSlice=None  #当前选中的切片self.orgPercentages={}#series=QPieSeries()   #series.setHoleSize(a_pie.pieHoleSize)  #设置饼图中间空心部分大小#series.setPieSize(a_pie.pieSize)       #设置饼图大小donut_Count=len(seriesDatas[1])         #得到饼图环形的层数for i,seriesItem in zip(range(donut_Count),seriesDatas[1]):      #依次得到每环的数据:每环的切片对应一组序列项a_pie=copy.copy(seriesDatas[2])      #饼图属性, 防环的属性值会被共享series=QPieSeries() #series.setHoleSize(a_pie.pieHoleSize)  #series.setPieSize(a_pie.pieSize)       for item in seriesItem:            #依次得到每环中每个切片的数据slice=QPieSlice(item["name"],item["value"])        #设置饼图切片图例名称及值slice.setColor(item["color"])                      #设置饼图切片颜色slice.setLabelVisible(a_pie.labelVisible)          #设置饼图标签可见slice.setLabelFont(a_pie.labelFont)                #设置饼图标签字体slice.setLabelColor(a_pie.labelCol)                #设置饼图标签颜色slice.setLabelPosition(a_pie.labelPos)             #设置饼图标签位置slice.setBorderColor(a_pie.pieLine.color())slice.setBorderWidth(a_pie.pieLine.width())slice.clicked.connect(self.slice_hovered) slice.clicked.connect(self.slice_clicked)series.append(slice)  #为信号槽使用一扩展的参数(用于定时动画)slice.hovered[bool].connect(partial(self.explode_slice, slc=slice))series.append(slice)size = (a_pie.maxSize - a_pie.minSize) / donut_Countseries.setHoleSize(a_pie.minSize + i * size)            #设置饼图中间空心部分大小series.setPieSize(a_pie.minSize + (i + 1) * size)        #设置饼图大小self.sel_slice=Noneself.org_percentages={}for slice in series.slices():  #存储原始百分比到字典中self.org_percentages[slice]=slice.percentage()slice.hovered.connect(lambda state,series=series: self.show_tooltip(None,state,series))  #当靠近饼图时触发信号槽:但没有动画了,取消不用self.donuts.append(series)    #将每环的对象加入列表,用于动画self._chart.addSeries(series) #修下原定义的环切片属性值同数据组数一致(即饼图的每一环的切片数不一定一致,即.groupNumber属性不一定一样)a_pie.groupNumber=len(seriesItem)a_pie.legendID=[x for x in range(self.legenCount,self.legenCount+a_pie.groupNumber)]         #序列的属性记住本序列的图例在图表中的索引号self.legenCount+=a_pie.groupNumber                                                           #加入的饼图序列,图例数为饼图的环切片数量lst=[series,chartType.BAR,a_pie]self.lstSeries.append(lst)                                 #同时将此图表项加入形表中统一管理 for ID in a_pie.legendID:                            #对饼图,每环对应a_pie.groupNumber,如有n环,一个饼图就有n*a_pie.groupNumber个图例if(ID<len(self._chart.legend().markers()) and ID>=0):marker=self._chart.legend().markers()[ID]    #确定是否显示本序列的series的图例marker.setVisible(a_pie.show_legend)def appendSeries_bar_graph(self,seriesDatas): #数据类型:"""增加一项柱图图表项到图表视中"""passdef slice_hovered(self):passdef slice_clicked(self):passdef resizeEvent(self, event):"""视图缩放事件,图表对应缩放"""if self.scene():self.scene().setSceneRect(QRectF(QPointF(0, 0), event.size()))self._chart.resize(event.size())#设置底部显示信息的位置 if(self.chart_a.show_buttonXY):self._coordX.setPos(self._chart.size().width() / 2 - 50,self._chart.size().height() - 20)self._coordY.setPos(self._chart.size().width() / 2 + 50,self._chart.size().height() - 20)if(self.chart_a.show_tooltip):for tooltip in self.toolTips:    #循环因单击固定到视上的提示框对象,并在视上刷新来出提示框对象tooltip.updateGeometry()self._chart.zoomReset()    #重置缩放QGraphicsView.resizeEvent(self, event)def mouseMoveEvent(self, event):"""在视底部显示坐标值"""pos = self._chart.mapToValue(event.position().toPoint())  #toPoint将转换为整数去除小数部分x = pos.x()y = pos.y()if(self.chart_a.show_buttonXY):self._coordX.setText(f"X= {x:.2f}")   self._coordY.setText(f"Y= {y:.2f}")QGraphicsView.mouseMoveEvent(self, event)def addOneTooltip(self): """单击视后,增加一个提示框图象到视上"""self.toolTips.append(self._tooltip)                                            #列表中增加一项提示框对象self._tooltip = charTooltip(self._chart)  self._chart = QChart()self._tooltip = charTooltip(self._chart,self.allAxis_x[0],self.allAxis_y[0])    #再重新定义一个提示框对象(不是原来的对象了,为下一次增加备用)def show_tooltip(self, point, state,series):"""槽函数:连接鼠标在线或点上滑动时,弹出一提示框显示内容,显示后如单击线或点上,提示框将会固定到view上存在问题,当前槽函数捕捉的点是在线条序列上的任一点,靠近线上节点时捕捉的坐标可能同节点有少许偏差,单击鼠标后会将此少许误差的坐标标注在视图上,需作容错处理????????????"""if(not self.chart_a.show_tooltip):  #如关闭了显示tooltip功能returnself.series=series#if self._tooltip == 0:   #原代码修改成下面二行if (self._tooltip is None and len(self.allAxis_x)>0  and len(self.allAxis_y)>0):self._tooltip = charTooltip(self._chart,self.allAxis_x[0],self.allAxis_y[0])      #按默认关联0号轴网,如有偏差,修改此处代码if(self._tooltip is None):returnself.onSerie=stateif state:if(point is None):  #表示当前鼠标位置在饼图或直方图上#print(f'鼠标在非点类序列对象上:{series}')returnx = point.x()y = point.y()#以下处理,如果鼠标在散点的点附近,或在折线或曲线节点附件时,修正XY坐标同散点或节点坐标一致,消除少许误差index=self.getNearPointIndex(point,series.points(),self.sel_xyOffSet)if(index>=0):              #图表点数据中发现最近的节点xy=series.at(index)    #得到节点的无偏差坐标x=xy.x()y=xy.y()self._tooltip.set_text(f"X: {x:.2f} \nY: {y:.2f} ")self._tooltip.set_anchor(point)      self._tooltip.setZValue(11)self._tooltip.update_geometry()self._tooltip.show()else:self._tooltip.hide()def delSeriesDatas(self,ID=-1):"""清除现有数据,ID=-1时,表示清除全部数据"""IDcount=len(self.lstSeries)  if(ID<=-1):self._chart.removeAllSeries()self.lstSeries=[]  #此处不能清空,因外面要用一下???elif(ID>=0 and ID<IDcount):self._chart.removeSeries(self.lstSeries[ID])self.lstSeries.pop(ID)def rePlaceDatas(self,ID=-1,newDatas=None):"""数据更新,重画图表,ID=-1时,只重画不更新 newDatas=[series图表项对象,chartType类型枚举,对应的属性对象]"""    IDcount=len(self.lstSeries)if(ID<=-1 or newDatas is None):passelif(ID>=0 and ID<IDcount and len(newDatas)==3):self.lstSeries[ID].replace(newDatas)self._chart.createDefaultAxis()   #刷新坐标轴self.paintEvent()@Slot(QPointF)def select_point(self, point: QPointF):              #原select_point(self, point: QPointF | int)"""单击图表上的对象时,如有点被选中,对选中的点进行处理(仅支持散点、折线图、曲线图序列对象)"""#因本视对象中可以包含多个series对象,需要对每个series对象的节点进行遍历for lstID,lst_series in zip(range(len(self.lstSeries)),self.lstSeries):#type=self._getSeriesType(_series)   #本例没有使用此方法得到的,采用lstSeries存在1号位的枚举来判断_series=lst_series[0]     #图表项对象type=lst_series[1]        #图表类型枚举a_=lst_series[2]          #本图表项的当前绘制属性self.point_tx=None        #如单击位置在点上,才会给变量XY赋值self.point_ty=Noneif(type==chartType.LINE or type==chartType.SPLINE or type==chartType.SCATTER):  #选择点方法只对折线图或曲线图或散点图有效index=self.getNearPointIndex(point,_series.points(),self.sel_xyOffSet)if(index<=-1):  #本组图表对象没发现,进入下一组continueprint(f'选中组={lstID},点序号={index}')  self.sel_series=_series                #赋给类变量,以方便其他方法可调用此变量self.sel_series.deselectAllPoints()self.sel_series.selectPoint(index)    #此行代码会自动将选择点的直径加大一倍,无需后面的尺寸设置代码(对折线和曲线有效,对散点无效)self._selectedPointIndex = indexself._selectedPointConfig = self.sel_series.pointConfiguration(index)selected_point = self.sel_series.at(index)                  #当前选择的点坐标self.point_tx=selected_point.x()  #记录选中点的真实坐标self.point_ty=selected_point.y()config = self.sel_series.pointConfiguration(index)          #对曲线,此代码将得不到当前点的属性字典color = config.get(PointConfig.Color) or self.sel_series.color()   size = config.get(PointConfig.Size) or self.sel_series.markerSize()labelVisibility = (config.get(PointConfig.LabelVisibility)or self.sel_series.pointLabelsVisible())customLabel = config.get(PointConfig.LabelFormat) or ""self.set_selPointCol(a_.pointCol_sel)      #按属性值中的颜色给选中点,对曲线图表项的选中点设置颜色和尺寸无效,如需对曲线点有效,可以对曲线附加一散点图表项,选中曲线点即视来选中对应散点来显示选中效果self.set_selPointSize(a_.pointSize_sel)    #此行不要,也会发生(折线或曲线)被选择点直径会大一倍,颜色不变化,对散点无效。要此行后,只对折线和散点有效,对曲线无效self.set_selPointTxtVisible(True)break  #发现有点后不再循环查找def getNearPointIndex(self,point,seriesPoints,xyOffset=0.1):"""判断点是否在点集seriesPoints中,容许偏差xyOffset"""if(xyOffset<0): xyOffset = self.sel_xyOffSetfor ID,serpoint in zip(range(len(seriesPoints)),seriesPoints): serX, serY=serpoint.x(),serpoint.y()x,y=point.x(),point.y()if(x<=(serX+xyOffset) and x>=(serX-xyOffset) and y<=(serY+xyOffset) and y>=(serY-xyOffset)):return IDreturn -1def set_selPointCol(self, colStr: str):    """设置指定点的颜色:参数可以是整数(默认颜色序号,如1为红色),也可以是字符串如'red'"""if(self.sel_series is not None):spc = self._selectedPointConfigspc[PointConfig.Color] = colStrself.sel_series.setPointConfiguration(self._selectedPointIndex, spc)  def set_selPointSize(self, size: int):"""设置指定点的尺寸"""if(self.sel_series is not None):spc = self._selectedPointConfigspc[PointConfig.Size] = sizeself.sel_series.setPointConfiguration(self._selectedPointIndex, spc)def set_selPointTxtVisible(self, checked: bool):""""设置指定点的标识是否可见"""if(self.sel_series is not None):spc = self._selectedPointConfigspc[PointConfig.LabelVisibility] = checkedself.sel_series.setPointConfiguration(self._selectedPointIndex, spc)def getMinMaxPoint(self,qPoints):"""根据传入的点集得到最小最大值,参数类型为QPoint或QPointF"""lstPoints=[[p.x(),p.y()] for p in qPoints]if(lstPoints):x_min=min(point[0] for point in lstPoints)x_max=max(point[0] for point in lstPoints)y_min=min(point[1] for point in lstPoints)y_max=max(point[1] for point in lstPoints)return x_min,x_max,y_min,y_maxdef clearPointLabel(self,ID=-1):"""清除所有图表上的坐标点标签"""  if(len(self.lstPointLabels)>0):for labelItem in self.lstPointLabels:curID=labelItem[0]   #属于哪个系列IDlabel=labelItem[1]   #标签对象if(curID==ID or ID<=-1):label.scene().removeItem(label)self.lstPointLabels.pop(ID)if(ID<=-1):self.lstPointLabels=[]def showPointLabel(self,ID,qpoints,a_point,offset_x=0,offset_y=0):"""此方法存在不能正确显示点坐标到位的情况??????????暂放弃不用,用类中自有的方法"""self.clearPointLabel(ID)   #先清除标签#创建新标签for point in qpoints:newPoint=QPointF(0,0)newPoint.setX(point.x()-offset_x)  #处理偏移newPoint.setY(point.y()-offset_y)scene_point=self._chart.mapToPosition(newPoint)#创建文本项label=QGraphicsSimpleTextItem(self._chart)label.setText(f"({point.x():.2f},{point.y():.2f})")     label.setFont(QFont('Arial',9))label.setBrush(QColor(Qt.darkBlue))#计算标签位置text_width=label.boundingRect().width()label.setPos(scene_point.x(),scene_point.y())  #原label.setPos(scene_point.x()-text_width/2,scene_point.y()-20),偏移太多,lstItem=[ID,label]self.lstPointLabels.append(lstItem)def set_gradient(self,series):"""对散点图表项对象采用渐变填充"""#线性渐变linear=QLinearGradient(0,0,1,1)linear.setColorAt(0.0,QColor(255,255,255,255))linear.setColorAt(0.5,series.color())linear.setColorAt(1.0,series.color().darker(200))linear.setCoordinateMode(QGradient.ObjectMode)#径向渐变radial=QRadialGradient(0.5,0.5,0.5)radial.setColorAt(0.0,QColor(255,255,255,255))radial.setColorAt(0.7,series.color())radial.setColorAt(1.0,series.color().darker(150))radial.setCoordinateMode(QGradient.ObjectMode)#应用渐变series.setBrush(radial)series.setBorderColor(QColor(30,30,30))#计时器槽(当前定义的2秒一次):使饼状图动起来@Slot()def ani_chart(self):if(self.usePieIni):for donut in self.donuts:phase_shift = randrange(-50, 100)donut.setPieStartAngle(donut.pieStartAngle() + phase_shift)donut.setPieEndAngle(donut.pieEndAngle() + phase_shift)#def explode_slice(self, exploded, slc):if(True):    #是否鼠标放在切片上时切片弹出显示if exploded:self.ani_timer.stop()  slice_startangle = slc.startAngle()slice_endangle = slc.startAngle() + slc.angleSpan()donut = slc.series()idx = self.donuts.index(donut)for i in range(idx + 1, len(self.donuts)):self.donuts[i].setPieStartAngle(slice_endangle)self.donuts[i].setPieEndAngle(360 + slice_startangle)else:for donut in self.donuts:donut.setPieStartAngle(0)donut.setPieEndAngle(360)self.ani_timer.start()slc.setExploded(exploded)#重新编写此方法,直接不用删除系列和轴线就能调整序号1-n图表项的绘图顺序  def create_order_series(self,lstID):"""重新生成图表的全部图表项,按指定绘图顺序全部重绘lstID=[],列表中越靠前的越绘在最上面(即后绘,最先加入到self._chart对象中),列表数量可以不同实际图表项数量一致,没有的会自动放在后面"""self.setUpdatesEnabled(False)    #暂停图表更新#self.setMouseTracking(False)     #设置鼠标追踪无效  seriesCount=len(self.lstSeries)tempSeries=[]                    #数据格式[series,类型,属性]           for sortID in lstID:            #最前面显示的放在列表最后(列表最后的最后加入chart,但最后的会在最上面显示)if(sortID>=0 and sortID < seriesCount):   if(self.use_0_axis) :  #支持 0轴为一固定散点数字轴if(sortID>0):    tempSeries.insert(0,self.lstSeries[sortID])        #图表项为优先级画的顺序 #0不加入,在最后加入(最后的先加入场景后画,但第0序位影响全部序列的坐标对齐关联)else:tempSeries.insert(0,self.lstSeries[sortID])            #不区分0,一律加入for ID in reversed(range(seriesCount)):                          #将剩余系列序号反向加入顺序列表if(not(ID in lstID)):if(self.use_0_axis):if(ID>0):tempSeries.insert(0,self.lstSeries[ID])               #对原有序号的除0外和上一个循环指定的ID外的系列加入列表else:tempSeries.insert(0,self.lstSeries[ID])     if(self.use_0_axis and len(self.lstSeries)>0):  #如果是支持0序列必须为双数字轴,最后加入tempSeries.append(self.lstSeries[0]) all_series= [series for series,_,_ in self.lstSeries]  #得到原列表中的全部数据引用值       for series in all_series:self._chart.removeSeries(series)           #临时移除,不是真正移除self.lstSeries=[]                              #清除列表中的引用值#self._chart.legend().markers()                #清除图例:移除图表项时应会自动清除 self.legenCount=0 #下面的循环中对图例要进行重新排序,先归0for series in tempSeries:                 #将列表中已排好序的序列对象重新加入到 self._chart对象中(列表越靠后的越后画,但会在其他的显示前面)self._chart.addSeries(series[0])      #self._chart.addSeries方法调用后,必须对图例,轴网关联等进行处理#对重新加入到的self._chart图表中的序列的图例属性进行设置stype=series[1]   #系列类型attrib=series[2]  #系列属性if(stype==chartType.LINE or stype==chartType.SPLINE or stype==chartType.SCATTER):  #图例为单图例的系列对象attrib.legendID=[self.legenCount]          #序列的属性记住本序列的图例在图表中的索引号self.legenCount+=1                         #加入的序列,图例数加1if(attrib.legendID[0]<self.legenCount and attrib.legendID[0]>=0):marker=self._chart.legend().markers()[attrib.legendID[0]]    #确定是否显示本序列的series的图例marker.setVisible(attrib.show_legend)elif(stype==chartType.BAR or stype==chartType.PIE):  #图例为多图例的系列对象attrib.legendID=[x for x in range(self.legenCount,self.legenCount+attrib.groupNumber)]         #序列的属性记住本序列的图例在图表中的索引号self.legenCount+=attrib.groupNumber                         #加入的直方图序列,图例数加直方图的组数量for ID in attrib.legendID:                            #对直方图或饼图,可能一图对应多个图例if(ID<len(self._chart.legend().markers()) and ID>=0):marker=self._chart.legend().markers()[ID]    #确定是否显示本序列的series的图例marker.setVisible(attrib.show_legend)self.lstSeries.append(series)     #回原,列表前面的先加入后画#处理第0个系列不显示图例if(self.use_0_axis and len(self.lstSeries)>0):marker=self._chart.legend().markers()[0]  #不显示第0序号的series的图例marker.setVisible(False)#需重新附加图表项到原有坐标轴all_series= [series  for series,_,attrib in self.lstSeries]  #得到原列表中的全部数据引用值all_attrib= [attrib  for _,_,attrib in self.lstSeries]       #得到原列表中的全部数据的属性值 #需对主轴线进行处理,否则如果因对图表项系列进行了更改载入self_chart顺序,可能存在主轴网的对应关系变化了#造成self._chart.mapToPosition(self._anchor)方法返回值不同于原不变量,第一个载入self._chart的系列为默认轴网坐标关联for series,attrib in zip(all_series,all_attrib):seriesType=self._getSeriesType(series)if(seriesType==chartType.LINE or seriesType==chartType.SPLINE or seriesType==chartType.BAR or seriesType==chartType.SCATTER):      #折线图和曲线图应同时依附当前XY轴刻度,直方图Y轴为数字也应依附,X轴为多标签可能不需要依附,饼图不XY均不需要依附self.attach_series(series,attrib.attchAxis_xID,attrib.attchAxis_yID)   #重新关联或不关联指定轴网self._set_ToolTips()self.setUpdatesEnabled(True)     #恢复图表更新#self.setMouseTracking(True)     #设置鼠标追踪有效self.update()                    #更新视图def addFirstAxis(self):"""为保证使用XY均为数值轴网时,所有图表系列均严格同最先创建的XY刻度值相匹配,默认第0位的轴网为一散点(仅一个)对应的双数值轴网"""if(len(self.allAxis_x)>0 and len(self.allAxis_y)>0):if(isinstance(self.allAxis_x[0],QValueAxis) and isinstance(self.allAxis_y[0],QValueAxis)):  #0序号的xy轴均为数字型org_x=self.allAxis_x[0].min()org_y=self.allAxis_y[0].min()series=QScatterSeries()orgPoint=[QPointF(org_x,org_y)]a_point=Apoint()a_point.pointCol='red'a_point.pointSize=10a_point.show_pointTxt=Falsea_point.show_legend=False                       #不显示图例a_point.attchAxis_xID,a_point.attchAxis_yID=0,0 #本一个散点的关联坐标轴号lstDatas=["",orgPoint,a_point]   self.appendSeries_scatter(lstDatas)           #增加散点序列,同时会增加基于XY为数字的轴网marker=self._chart.legend().markers()[0]      #不显示第0序号的series的图例marker.setVisible(False)else:print(f'为防止第0序号被非数字类序列占用,创建一基于数字轴线的散点序列对象没有成功,请检查代码。这可会造成坐标对应错误')    #测试示例数据def demo(self,draw_0_axis=True,lstSample=[0,1,2,3,4,5,6]):#为避面先建直方图,因直方图的X轴刻度(如6个月只有最大6)同数值型的最大值如13不一致,将会导致tooltip显示出现偏移,应先建X轴数字有关的折线图或曲线图(两者的采用XY相同的最大最小刻度值)#0、增加一个仅1个散点的系列,用于保住主轴网不因其他系列加入图表后可能对视图坐标系的影响self.use_0_axis=draw_0_axislstCol=gf_getCommonCol(24,0,24,True)if(self.use_0_axis):   #要使用XY为固定刻度的主轴网,即默认最先添加到chart中的是只有一个点的散点系列占位self.addFirstAxis()   if(1 in lstSample):   #示例1,序号仅为示例,并不代表在序列集中的索引号为1,如上行为false时,此折线是第一个加入的,则此折线序列索引号为0#1、折线型图表示例  points1=[QPointF(0,3.3),QPointF(4,5),QPointF(3,4.5),QPointF(7,1),QPointF(12,2)]a_line1=Aline(1)  #a_line1.ID=1     #为本序列指定唯一的ID号,如有重号系统会自已指定,但可控性和可读性差,对ID的使用应在可控范围内if(a_line1.sort):                    #如为True,对线上的关键点进行排序,用于使线条总是沿一个方向绘制points1=gf_sort_QPointF(points1)  a_line1.lineCol='blue'a_line1.show_legend=True            #是否显示本系列图例lstDatas1=["折线性图表对象",points1,a_line1]                    #x_min,x_max,y_min,y_max=self.getMinMaxPoint(points1)         #得到点集中的最小最大值self.appendSeries_line(lstDatas1)                            #传入的数据结构应为['图表项名称',[QPointF(x,y),....],Aline()属性对象]if(2 in lstSample):#2、直方图示例(不同折线和曲线图表共用X轴线,单独新创建X轴为月份类,Y轴共用折线和曲线图轴线刻度)#如果将此直方图图表项放在第一个来创建,点toollip标记将不正确a_bar=Abar(2)a_bar.ID=2 a_bar.x_min=0a_bar.x_max=1a_bar.show_legend=True       #不显示本系列图例a_bar.attchAxis_xID=1        #如果建立了第二个X轴,关联此X轴(如为一分组),@@@@@@@此值需根据情况调整@@@@@@@a_bar.attchAxis_yID=0        #Y轴关联主Y轴,为一数字  lstDatas3=['直方图示例',                                                              #直方图表名称: 会覆盖原先折线图的图表名[chartType.axis_CATEGOR,"1月", "2月", "3月", "4月", "5月", "6月"],        #X轴标签类型:0=类型  1~n=数据:因只有6项,若上绑定原X刻度0-13,则按6/13压缩,若不绑定,新X轴按6刻度满铺[chartType.axis_NUMBER,0,20,1],                                          #y轴标签类型:0=类型  1~n=数据:0,20,1数据是否有用根据建立直方图时,原XY轴是否已建立,直方图的数据要依附已建好的XY轴刻度比例,不能打乱原有轴线刻度比例[['产品1',lstCol[2],[1, 2, 3, 4, 5, 6]],['产品2',lstCol[3],[5, 0, 0, 4, 0, 7]],['产品3',lstCol[4],[3, 5, 8, 13, 8, 5]],['产品4',lstCol[5],[5, 6, 7, 3, 4, 5]],['产品5',lstCol[6],[9, 7, 5, 3, 1, 2]]],a_bar]lstDatas31=['直方图示例',                                                              #[chartType.axis_CATEGOR,"1月", "2月", "3月"],        [chartType.axis_NUMBER,0,10,1],                                          [['产品1',lstCol[7],[1, 2, 3]],['产品2',lstCol[8],[6,5,4]]],                     a_bar]a_bar.groupNumber=len(lstDatas3[3])    #直方图每组图数量self.appendSeries_Bar(lstDatas3,barType=chartType.BAR_V)     #同折线图和曲线图不共用坐标刻度:['图表项名称',[1,'1月','2月'....],[0,range(0-15)],[['产品1','red',[1,2,3,4,5,6]],['产品2','green''[1,2,3,4,5,6]],[......]]],Abar属性类对象]if(3 in lstSample):#3、曲线型图表示例(同折线图表共用XY轴数据刻度)points2=([QPointF(0, 1.4), QPointF(2.4, 3.5),    #曲线上的节点 QPointF(3.7, 2.5), QPointF(7, 4),QPointF(12, 2),])a_line2=Aline(3)        #画曲线的属性值a_line2.ID=3 if(a_line2.sort):                    #如为True,对线上的关键点进行排序,用于使线条总是沿一个方向绘制points2=gf_sort_QPointF(points2)  a_line2.lineCol='green'a_line2.pointSize=5a_line2.show_legend=True  #不显示本系列图例lstDatas2=["曲线图表对象",points2,a_line2]self.appendSeries_spline(lstDatas2) if(4 in lstSample):#4、散点图表示例series=QScatterSeries()point4=[]for _ in range(0,100):x=random.uniform(0,13)y=random.uniform(0,30)point4.append([x,y])qpointf4=[QPointF(x,y) for x,y in point4]a_point=Apoint(4)a_point.ID=4 a_point.pointCol=lstCol[10]a_point.show_legend=True     #显示本系列图例lstDatas4=["散点图表对象",qpointf4,a_point]   #['图表项名称',[QPointF(x,y),....],Apoint属性类对象]self.appendSeries_scatter(lstDatas4)if(5 in lstSample or 6 in lstSample): #5+6、饼图示例(两个环,占用两个系列序号)series=QPieSeries()data5_1=[{"name":'1月',"value":25,"color":QColor(lstCol[11])},   #从内向外:第一环{"name":'2月',"value":15,"color":QColor(lstCol[12])},{"name":'3月',"value":20,"color":QColor(lstCol[13])},{"name":'4月',"value":10,"color":QColor(lstCol[14])},{"name":'5月',"value":30,"color":QColor(lstCol[15])},]data5_2=[{"name":'6月',"value":21,"color":QColor(lstCol[5])},   #从内向外:第2环{"name":'7月',"value":15,"color":QColor(lstCol[16])},{"name":'8月',"value":15,"color":QColor(lstCol[17])},{"name":'9月',"value":50,"color":QColor(lstCol[18])},{"name":'10月',"value":11,"color":QColor(lstCol[19])},]data5=[data5_1,data5_2]a_pie=Apie(5)a_pie.ID=5a_pie.groupNumber=len(data5_1)     #饼图每一环图例数量self.usePieIni=a_pie.useAnia_pie.donutCount=len(data5)         #有两环a_pie.slcCount=len(data5_1)         #每环的切片数量a_pie.pieHoleSize=0.35              #饼图空心占图表范围的比例(0-1)a_pie.pieSize=0.65                  #饼图空心占图表范围的比例(>a_pie.pieHoleSize,<=1)a_pie.show_legend=True              #不显示本系列图例lstData5=['饼图图表项',data5,a_pie]  #数据格式=seriesDatas=['饼图图表项',[data5],Apie] self.appendSeries_pie(lstData5)     #创建饼图后,在视上移动鼠标时,显示坐标功能没有了,也不会显示tooltip提示框了self.update()     #++++++++++++++++++++++++++++++++++++++++++++++++++++++++++++++++++++++++++++++++++++++++++++++++++++++++++++++++++++++++++++++++++++++++++++++++++++++++++++++++++++++++++++++++++++++++++++++++++++++++
class chartView2D_painter(chartView2D):"""基于chartView的可显示图表,同时可以在图表上再进行画直线类似于画板的功能"""def __init__(self,parent,chart_attrib):super().__init__(parent,chart_attrib)self.draw_Type=drawType.DRAW_NOself.setDlg=None      #自绘画对话框窗体对象self.defFont= QFont('宋体',9)self.defPen=gf_getPen('red',1)   #默认画笔self.defBrush=QBrush(QColor('green'))self.defBrush.setStyle(Qt.SolidPattern) #定义当前绘画类型       0                 1              2          3      4             5self.paintSet=[QColor('black'),QColor('white'),QFont('宋体',9),1,Qt.SolidLine,Qt.SolidPattern]self.ownDrawShow=True              #对在图表图表上是否将自绘的图显示出来self.ownDrawShowText='关闭自绘图'self.ownDrawGroup=self.scene().createItemGroup([])  #将自画的全部图形装入此组中,以方便可以显示/不显示自画的图形self.ownDrawGroup.setVisible(True) self.ownDrawCount=0self.lstUndo=[]self.lstRedo=[]def paintEvent(self, event: QPaintEvent):"""绘图事件重载"""return super().paintEvent(event)#鼠标按下事件重载   def mousePressEvent(self, event):if(self.draw_Type==drawType.DRAW_NO):       #非绘画模式不对后面的代码作处理return super().mousePressEvent(event)if(self.draw_Type!=drawType.DRAW_FREE  or self.draw_Type!=drawType.DRAW_TEXT):self.bDrawOK=False   #关闭重绘事件#print(f'当前坐标:x={event.pos().x()},y={event.pos().y()}')# 鼠标左键按下if event.button() == Qt.LeftButton:self.bLeftMouseKey=Trueself.lastPoint = event.pos()self.endPoint = self.lastPointself.edtCtlPosX = event.pos().x()self.edtCtlPosY = event.pos().y()+30     #没对超出屏幕时作坐标处理。。。if(self.draw_Type==drawType.DRAW_TEXT):  #对画文本类型,临时创建一输入框控件在点击位置上w=self.points_to_pixels(self.paintSet[2].pointSize()*len('输入文本...(Alt+拖动移动)'),dpi=96) #比例有问题if(w>self.width()/2):w=int(self.width()/2)h=self.points_to_pixels(self.paintSet[2].pointSize()+5,dpi=96)self.create_editor(event.pos(),w,h,self.paintSet[2],self.paintSet[0],self.paintSet[1])else:self.bLeftMouseKey=Falseif(self.draw_Type==drawType.DRAW_FREE): #是随手画时self.curPath=QPainterPath()self.curPath.moveTo(self.lastPoint)path=self.temp_item=self.scene().addPath(self.curPath,self.defPen)self.ownDrawGroup.addToGroup(path)self.ownDrawCount+=1#鼠标移动事件重载          def mouseMoveEvent(self, event):  if(self.draw_Type==drawType.DRAW_NO):       #非绘画模式不对后面的代码作处理return super().mouseMoveEvent(event)#print(f'当前坐标:x={event.pos().x()},y={event.pos().y()}')if event.buttons() and self.bLeftMouseKey:if(self.draw_Type==drawType.DRAW_FREE):  #仅随手画时要实时得到坐标位置并画出self.endPoint = event.pos()self.curPath.lineTo(self.endPoint)self.temp_item.setPath(self.curPath)# 进行重新绘制self.bDrawOK=True   #打开重绘事件else:pass#print('非随手画模式请自行增加代码来画一临时虚框显示绘图过程,但不真正绘会出来')#自定义槽函数,用于接收画文本内容的子窗口发送信号sig_ToMian和接收传来的数据def getDrawTXT(self,lstdata):print(f'父窗体paintCanvas接收到sig_ToMian信号和变量值:{lstdata}')#将数值传给子窗体self.label,以便进行绘画文本self.lsttxt = lstdata           #['文本内容xxxx',  [x,y,width,height],  ['宋体',12,'black',False,False,False,False]]# 鼠标左键释放        def mouseReleaseEvent(self, event):#print(f'当前坐标:x={event.pos().x()},y={event.pos().y()}')if(self.draw_Type==drawType.DRAW_NO):       #非绘画模式不对后面的代码作处理return super().mouseReleaseEvent(event)if event.button() == Qt.LeftButton:self.endPoint = event.pos()x1,y1=self.lastPoint.x(),self.lastPoint.y()x2,y2=self.endPoint.x(),self.endPoint.y()#print(f'当前坐标:x={event.pos().x()},y={event.pos().y()}')# 进行重新绘制self.bDrawOK=Trueif(self.draw_Type==drawType.DRAW_POINT):                             #画点(实际就是画一小圆)pointsize=max(3,self.defPen.width())point=self.scene().addEllipse(x2-pointsize/2,y2-pointsize/2,pointsize,pointsize,self.defPen,QBrush(self.defPen.color()))self.ownDrawGroup.addToGroup(point)   #将自绘的图形加入到一组中,用于控制显示或不显示本组图形self.ownDrawCount+=1elif(self.draw_Type==drawType.DRAW_LINE):                            #画线line=self.scene().addLine(x1,y1,x2,y2,self.defPen)self.ownDrawGroup.addToGroup(line)self.ownDrawCount+=1elif(self.draw_Type==drawType.DRAW_RECT):                            #画矩形if(x1<=x2):  #从上往下拖rect=self.scene().addRect(x1,y1,abs(x2-x1),abs(y2-y1),self.defPen)else:       #从下往上拖rect=self.scene().addRect(x2,y2,abs(x1-x2),abs(y1-y2),self.defPen)self.ownDrawGroup.addToGroup(rect)  self.ownDrawCount+=1elif(self.draw_Type==drawType.DRAW_FILLRECT):                        #画填充矩形if(x1<=x2):  #从上往下拖fillrect=self.scene().addRect(x1,y1,abs(x2-x1),abs(y2-y1),self.defPen,self.defBrush)  else:       #从下往上拖fillrect=self.scene().addRect(x2,y2,abs(x1-x2),abs(y1-y2),self.defPen,self.defBrush)self.ownDrawGroup.addToGroup(fillrect)  self.ownDrawCount+=1elif(self.draw_Type==drawType.DRAW_CIRCLE):   #画圆#计算出圆半径,并更改结束点坐标已满足最大圆D=min(abs(x2-x1),abs(y2-y1))if(x1<=x2):x2 = x1+Dy2 = y1+Delse:x2 = x1 - Dy2 = y1 - Dif(x1<=x2):  #从上往下拖circle=self.scene().addEllipse(x1,y1,abs(x2-x1),abs(y2-y1),self.defPen,QBrush(QColor(0,0,0,0)))  else:  #从下往上拖circle=self.scene().addEllipse(x2,y2,abs(x1-x2),abs(y1-y2),self.defPen,QBrush(QColor(0,0,0,0))) self.ownDrawGroup.addToGroup(circle)  self.ownDrawCount+=1elif(self.draw_Type==drawType.DRAW_FILLCIRCLE):   #画填充圆#计算出圆半径,并更改结束点坐标已满足最大圆D=min(abs(x2-x1),abs(y2-y1))if(x1<=x2):x2 = x1+Dy2 = y1+Delse:x2 = x1 - Dy2 = y1 - Dif(x1<=x2):  #从上往下拖fillcircle=self.scene().addEllipse(x1,y1,abs(x2-x1),abs(y2-y1),self.defPen,self.defBrush)  else:  #从下往上拖fillcircle=self.scene().addEllipse(x2,y2,abs(x1-x2),abs(y1-y2),self.defPen,self.defBrush) self.ownDrawGroup.addToGroup(fillcircle)self.ownDrawCount+=1elif(self.draw_Type==drawType.DRAW_ELLPTIC):   #画椭圆if(x1<=x2):  #从上往下拖ellptic=self.scene().addEllipse(x1,y1,abs(x2-x1),abs(y2-y1),self.defPen,QBrush(QColor(0,0,0,0)))  else:  #从下往上拖ellptic=self.scene().addEllipse(x2,y2,abs(x1-x2),abs(y1-y2),self.defPen,QBrush(QColor(0,0,0,0))) self.ownDrawGroup.addToGroup(ellptic)  self.ownDrawCount+=1elif(self.draw_Type==drawType.DRAW_FILLELLPTIC):   #画填充椭圆if(x1<=x2):  #从上往下拖fillellptic=self.scene().addEllipse(x1,y1,abs(x2-x1),abs(y2-y1),self.defPen,self.defBrush)  else:  #从下往上拖fillellptic=self.scene().addEllipse(x2,y2,abs(x1-x2),abs(y1-y2),self.defPen,self.defBrush)    self.ownDrawGroup.addToGroup(fillellptic)  self.ownDrawCount+=1elif(self.draw_Type==drawType.DRAW_FREE):   #随手画pass                                    #已在下压和移动事件中处理完成elif(self.draw_Type==drawType.DRAW_TEXT):   #画文本模式pass                                    #已在下压事件中处理完成     self.update()                  #画文本时,返回新建窗体或编辑框控件左上角坐标def getTxtEdtPos(self):return self.edtCtlPosX,self.edtCtrlPosYdef create_editor(self,pos,w=150,h=30,font=QFont('宋体',11),txtCol=QColor('black'),bkCol=QColor(0,0,0,0)):"""运态创建一编辑框,编辑框失去焦点则将文本内容发送出去,同时隐藏本身"""self.editor=drawEditWidget(self)self.editor.setGeometry(pos.x(),pos.y(),w,h)self.editor.setEditType(font,txtCol,bkCol)self.editor.setPlaceholderText('输入文本...(Alt+拖动移动)')    #设置默认掩码文字self.editor.signal_sendDrawText.connect(self.drawEditText)   #关联信号槽:在编辑框失去焦点销毁前得到文本信息并在chartView上绘出来#优化焦点获取self.editor.setFocus()QTimer.singleShot(10,lambda:self.editor.setFocus() or self.editor.selectAll())#在父类中初步设置编辑框的字体等属性self.editor.setStyleSheet("""drawEditWidget { border:2px solid #3498db;border-radius:1pxpadding:2px;badkground-color:#ffffff;selection-background-color:#3498db;selection-color: white;}QLineEdit:focus {border-color:#e74c3c;background-color:#fef9e7;}QLineEdit:hover {border-color:#9b59b6;}""")#对字体、字号,字色再更改self.editor.setFont(font)#设置工具提示self.editor.setToolTip("Alt+鼠标左键拖动移动\n点击外部后提交内容")self.editor.show()def drawEditText(self,lstDatas):"""                                         0       1             2            3得到临时创建的文本编辑框中的文本,列表数据格式: ['',QRect(x,y,w,h),QColor, QFont ['字体',字号,加粗,下划线,倾斜,删除线]]如文本有背景,这里暂不支持,方法是先画了填充矩形,在矩形上再画文字,实际成了两个对象了,用处不大,不作处理"""self.lstText=lstDatasif(len(self.lstText[0])>0):spaceX=3  #文字间横向间距spaceY=6  #文字间纵向间距dpi=96self.txtWidth=len(lstDatas[0])*(lstDatas[3].pointSize()+spaceX)self.txtHeight=self.lstText[3].pointSize()+spaceYdrawTxt=self.scene().addText(lstDatas[0],lstDatas[3])   drawTxt.setFont(lstDatas[3])drawTxt.setDefaultTextColor(lstDatas[2])drawTxt.setPos(lstDatas[1].x(),lstDatas[1].y())self.ownDrawGroup.addToGroup(drawTxt)self.ownDrawCount+=1#字号同像素点的转换def points_to_pixels(self,points, dpi=96):return points * dpi / 72.0def pixels_to_points(self,pixels, dpi=96):return pixels * 72.0 / dpi#def contextMenuEvent(self, event):"""在图表视上单击鼠标右键时,弹出的菜单事件及处理函数"""cmenu = QMenu(self)                    #暂不对右键菜单增加左则图标的美化功能,请自行添加图标作美化act_draw_undo = cmenu.addAction("撤消")  act_draw_redo = cmenu.addAction("重作")act_draw_redo.setEnabled(True)act_draw_undo.setEnabled(True)if(self.ownDrawCount==0):           #有自绘画内容时才可撤消act_draw_undo.setEnabled(False)if(len(self.lstRedo)==0):           #撤消列表中已有内容时,才可重做act_draw_redo.setEnabled(False)cmenu.addSeparator()                    act_draw_point = cmenu.addAction("画点")  act_draw_line = cmenu.addAction("画直线")act_draw_rect = cmenu.addAction("画矩形")act_draw_fillrect = cmenu.addAction("画填充矩形")act_draw_circle = cmenu.addAction("画圆形")act_draw_fillcircle = cmenu.addAction("画填充圆形")act_draw_ellptic = cmenu.addAction("画椭圆")act_draw_fillellptic = cmenu.addAction("画填充椭圆")act_draw_text= cmenu.addAction("画文本")act_draw_free= cmenu.addAction("随手画")act_draw_set= cmenu.addAction("画板设置")act_draw_show= cmenu.addAction(self.ownDrawShowText)   cmenu.addSeparator()act_draw_quit= cmenu.addAction("退出绘画模式")#关联菜单信号对象action = cmenu.exec_(self.mapToGlobal(event.pos()))#处理对应菜单的响应函数(python3.1以后支持枚举case,这里仍采用旧版本的if结构)if action == act_draw_quit:self.draw_Type=drawType.DRAW_NO         #退出绘画模式self.setCursor(Qt.ArrowCursor)          #设定鼠标为普通状态: 箭头if action == act_draw_undo:self.draw_Type=drawType.DRAW_NO         #撤消一步自绘画self.setCursor(Qt.ArrowCursor)          #self.onDo()if action == act_draw_redo:self.draw_Type=drawType.DRAW_NO         #恢复撤消的最近一步自绘画self.setCursor(Qt.ArrowCursor)  self.onRedo()       elif action == act_draw_point:              #画点 self.draw_Type=drawType.DRAW_POINTself.setCursor(Qt.CrossCursor)          #设定鼠标为普通状态: 十字elif action == act_draw_line:               #画线 self.draw_Type=drawType.DRAW_LINEself.setCursor(Qt.CrossCursor)  elif action == act_draw_rect:               #画矩形self.draw_Type=drawType.DRAW_RECT self.setCursor(Qt.CrossCursor)elif action == act_draw_fillrect:           #画填充矩形self.draw_Type=drawType.DRAW_FILLRECTself.setCursor(Qt.CrossCursor)elif action == act_draw_circle:             #画圆形self.draw_Type=drawType.DRAW_CIRCLEself.setCursor(Qt.CrossCursor)elif action == act_draw_fillcircle:         #画圆形self.draw_Type=drawType.DRAW_FILLCIRCLEself.setCursor(Qt.CrossCursor)    elif action == act_draw_ellptic:            #画椭圆形self.draw_Type=drawType.DRAW_ELLPTICself.setCursor(Qt.CrossCursor)elif action == act_draw_fillellptic:        #画填充椭圆形self.draw_Type=drawType.DRAW_FILLELLPTICself.setCursor(Qt.CrossCursor)    elif action == act_draw_text:               #画文本self.draw_Type=drawType.DRAW_TEXTself.setCursor(Qt.CrossCursor)elif action == act_draw_free:               #自由画self.draw_Type=drawType.DRAW_FREEself.setCursor(Qt.CrossCursor)elif action == act_draw_set:               #打开自绘图设置小悬浮窗口self.openSetDlg()elif action == act_draw_show:         #是否将当前自绘制的图形显示出来self.setownDrawShow()    def onDo(self):"""撤消最近的一次自绘画内容(支持无限撤消)"""if(self.ownDrawCount>=0):item=self.scene().items()[0]   #绘制时是后加入的在前,不用item=self.scene().items()[self.ownDrawCount-1]#newitems=self.scene().items().copy()  #好象无需新复制也可以实现功能#newitem=newitems[0]self.lstRedo.insert(0,item)   #将撤消的加入的待恢复的列表中(同上,后删除的在前)self.scene().removeItem(item)self.ownDrawCount-=1def onRedo(self):"""恢复最近一步被撤消的操作"""if(len(self.lstRedo)>0):self.scene().addItem(self.lstRedo[0])self.ownDrawGroup.addToGroup(self.lstRedo[0]) self.lstRedo.pop(0)count=len(self.lstRedo)self.ownDrawCount+=1def setownDrawShow(self):"""是否将当前自绘制的图形显示出来:运行一次此函数,转换一次身份""" self.ownDrawShow=not self.ownDrawShowif(self.ownDrawShow):     #当前是打开状态,可以显示自画self.ownDrawShowText='关闭自绘图'else:self.ownDrawShowText='打开自绘图'self.ownDrawGroup.setVisible(self.ownDrawShow) self.update()                #重画图表视图def openSetDlg(self):"""打开一设置对话框,设置自画图属性"""self.setDlg= painterSet()                             #实例化上浮在主窗体上的了小窗体用于设置自绘画时的一些基本参数self.setDlg.show()                                    #会默认在屏幕中心显示 self.setDlg.sendData.connect(self.getSetFromSetDlg)   #子窗体【painterSet】向主窗传送数据信号槽定义@Slot(list)def getSetFromSetDlg(self, lstSet):"""从self.setDlg悬浮小窗体中发来的信号对应的槽函数,用于实时更改绘图参数"""#print('接收到设置数据')                  #父亲窗体在这里处理接收到的数据                             0              1               2          3     4              5self.paintSet=lstSet                   #从小画板设置窗体上得到当前自画图的设置值self.paintSet=[QColor('black'),QColor('white'),QFont('宋体',9),1,Qt.SolidLine,Qt.SolidPattern]self.defPen=gf_getPen(lstSet[0],lstSet[3])   #默认画笔self.defBrush=QBrush(lstSet[1])              #画刷颜色if(lstSet[6]>=15 and lstSet[6]<=18):         #这几种画刷为直接赋值的画刷self.defBrush=lstSet[5]else:self.defBrush.setStyle(lstSet[5])   #画刷类型:后几种组合复杂画刷无效?self.defFont= lstSet[2]#def toggleMenu(self, state):"""对应主菜单:视图-->显示/隐藏状态栏的信号槽函数"""if state:self.statusbar.show()else:self.statusbar.hide()#++++++++++++++++++++++++++++++++++++++++++++++++++++++++++++++++++++++++++++++++++++++++++++++++++++++++++++++++++++++++++++++++++++++++++++++++++++++++++++++++++++++++++++++++++++++++++++++++++++++++
class drawEditWidget(QLineEdit):"""基于单行QT编辑框控件QLineEdit的继承类,用于在动态创建编辑框,输完内容失去焦点时即销毁,销毁前将编辑框内容发送给父窗口"""signal_sendDrawText = Signal(list)   #自定义信号,向父窗口发送当前编辑框内的文本内容   [self.text,self.font]def __init__(self,parent=None):super().__init__(parent)self.dragging=False                      #是否支持窗口被拖动 self.drag_start_position=QPoint()        #鼠标在本控件上压下开始的坐标点(相对父控件)self.setEditType()                       #先按默认属性设置编辑框文本属性def setEditType(self,font=QFont('宋体',9),txtCol=QColor('black'),bkCol=QColor(0,0,0,0)):"""设置本文本框中的字体样式、文字颜色,背景颜色"""self.txtCol=txtColself.bkCol=bkColself.font = font#使用QPalette设置颜色palette=QPalette()self.setAutoFillBackground(True)   palette.setColor(QPalette.Text,txtCol)              #文本颜色palette.setColor(QPalette.Base,bkCol)               #背景颜色self.setPalette(palette)#self.setStyleSheet("background-color:green") self.setFont(self.font)                       #应用到字体#鼠标按下事件重载   def mousePressEvent(self, event):  #当按下Alt键并点击时开始拖动if event.modifiers()==Qt.AltModifier and event.button()==Qt.LeftButton:self.dragging=Trueself.drag_start_position=event.globalPosition().toPoint()   self.initial_pos=self.pos()self.setCursor(Qt.ClosedHandCursor)event.accept()returnsuper().mousePressEvent(event)#鼠标移动事件重载          def mouseMoveEvent(self, event):  """拖动标识位设定为真时, 进入移动事件"""if self.dragging:# 计算鼠标移动的x,y位移delta=event.globalPosition().toPoint() - self.drag_start_positionself.move(self.initial_pos+delta)event.accept()returnsuper().mouseMoveEvent(event)#        def mouseReleaseEvent(self, event):"""鼠标左键释放 """if(self.dragging and event.button()==Qt.LeftButton):self.dragging=Falseself.setCursor(Qt.IBeamCursor)event.accept()returnsuper().mouseReleaseEvent(event)def apply_font_properties(self,txtCol='black',fontName='宋体',fontSize=11,bBold=False,bItalic=False,bUnderLine=False,bStrikeOut=False):"""创建并配置字体:暂没有使用"""self.font=QFont()self.font.setFamily(fontName)self.font.setPointSize(fontSize)self.font.setBold(bBold)self.font.setItalic(bItalic)self.font.setUnderline(bUnderLine)self.font.setStrikeOut(bStrikeOut)self.txtCol=txtCol#使用QPalette设置颜色palette=QPalette()palette.setColor(QPalette.Text,QColor(self.txtCol))  #暗红色文本self.setFont(self.font)                              #应用到字体def focusOutEvent(self,event):"""当编辑框失去焦点后,向其父窗口发送信号,传递当前编辑框中的文字信息,并在框的当前位置绘出文字"""#print(f'录入内容:{self.text()}')lstDatas=[self.text(),QRect(self.x(),self.y(),self.width(),self.height()),self.txtCol,self.font]self.signal_sendDrawText.emit(lstDatas)  #发送信号给父窗口,传送编辑框被销毁前的文本信息self.deleteLater()                       #销毁编辑框本身super().focusOutEvent(event)
图表及图表项的各种属性定义类chartAttrib.py模块代码如下:
# -*- coding: utf-8 -*-
"""
chartAttrib.py: 图表及图表项的各种属性定义类
"""
import random
from enum import Enum
from PySide6.QtWidgets import (QApplication, QGraphicsScene, QGraphicsView,QGraphicsSimpleTextItem, QGraphicsItem)
from PySide6.QtWidgets import (QLabel,QCheckBox, QComboBox, QDialog, QLineEdit,QMenu, QPushButton,QGridLayout,QHBoxLayout,QVBoxLayout,QGroupBox)
from PySide6.QtCore import Qt, QPointF, QRectF, QRect,Slot
from PySide6.QtCharts import (QChart, QLineSeries, QSplineSeries, QChartView, QXYSeries,QValueAxis,QAbstractSeries,QStackedBarSeries,QAbstractBarSeries,QBarCategoryAxis,QPieSeries, QBarSet,QBarSeries,QScatterSeries,QPieSlice)
from PySide6.QtGui import QPainter, QFont, QFontMetrics, QPainterPath, QColor,QPen,QAction,QBrush
from PySide6.QtCore import QThread,QObject,Signaldef gf_getPen(col='black',linewidth=1,lineType=Qt.SolidLine):"""根据指定的内容得到画笔对象"""pen=QPen(col)   #线颜色pen.setWidth(linewidth)     #线宽 pen.setStyle(lineType)  #Qt.SolidLine:实线 Qt.DashLine:虚线  Qt.DotLine:点划线 Qt.DashDotLine:双点划线  DashDotDotLine多双点划线return pendef gf_getBrush(col='black',brushType=Qt.SolidPattern):"""根据指定参数得到画刷"""brush=QBrush()brush.setColor(col)    #透明色可设置为brush.setColor(QColor(0,0,0,0))brush.setStyle(brushType)return brushdef gf_QPointF_to_list(qpoints):"""QPointF类型转换成列表"""lstPoints=[[p.x(),p.y()] for p in qpoints]return lstPointsdef gf_sort_QPointF(qpoints,sort_x=True,sort_y=True):lstPoints=list(qpoints) if(sort_x and sort_y):lstPoints.sort(key=lambda p: (p.x(),p.y()))elif(sort_x):lstPoints.sort(key=lambda p: (p.x()))elif(sort_y):lstPoints.sort(key=lambda p: (p.y()))return lstPointsdef gf_getAxisLabels(mainGroups,subGroups):"""对直方图系列,如直主图主分类列表下又各分为子分类,如主分类为['1月','2月'...]共n类,每月下面又划分为['产品1','产品2'...]共m项,如采用主分类作为x轴标,则会自动将图表轴线长度L平分2*n块,每块长k,排头和结尾长度占L/(2*n),是间有直方图形和直主图形间的空白长度为L/n如采用主类下的每个子项来作为轴标,轴标数量就为2*len(mainGroups)*len(subGroups)"""count=len(mainGroups)subcount=len(subGroups)allcount=2*len(mainGroups)*len(subGroups)new_lstGroupText=[str(x) for x in range(allcount)] pos=int(count/2)for n in range(2*count-1):if n%2==0:new_lstGroupText[pos:pos+subcount]=subGroupspos+=subcountelse:pos+=subcountprint(new_lstGroupText)return new_lstGroupText   #注意,用于直方图的轴标分类时,此值不能有重复,他以集合set的方式处理,即将重复的内容只保留一份
##############################################################################################################################################################
class chartType(Enum):"""本模块支持的绘制图表的类型枚举"""BAR=1                  #直方图(每个图块对应一个数据)BAR_H = 2              #柱状图(每个图块又由几个图块构成,每个图块对应一组数据):纵向堆叠BAR_V = 3              #柱状图(每个图块又由几个图块构成,每个图块对应一组数据):纵向堆叠LINE=4                 #折线图SPLINE=5               #曲线图SCATTER = 6            #散点图PIE=7                  #饼图(可单环也可多环,多环实际是对应多个饼图,只是中间空心部分进行了计算调整)LEGEND=9                 #图例axis_NUMBER =10          #为数字型标签()               axis_CATEGOR=11          #类型轴标签(文字型,如月份等,每月份对应几组数据)SCATTER_CIRCLE=20        #散点为圆形SCATTER_RECT=21          #散点为矩形SCATTER_REVRECT=22       #散点为旋转矩形SCATTER_BUBBLE=23        #带大小的散点图(气泡图)SCATTER_HEATMAP=24       #高密度散点图(热力图)VIEW_SHOWXY=30           #在chart视图底部显示信息的类型class drawType(Enum):"""本模块支持的在图表上自绘画的类型枚举"""DRAW_NO=0           #非绘画状态DRAW_POINT=1        #画一点DRAW_LINE=2         #画直线DRAW_RECT=3         #画矩形 DRAW_FILLRECT=4     #画填充矩形DRAW_CIRCLE=5       #画圆DRAW_FILLCIRCLE=6   #画填充圆DRAW_ELLPTIC=7      #画椭圆DRAW_FILLELLPTIC=8  #画填充椭圆DRAW_TEXT=9         #画文本DRAW_FREE=10         #随手画class Apainter():"""定义绘制图形的一些属性和方法"""def __init__(self):self.lineCol=QColor('black')self.lineWidth=1self.lineType_cn=['实线','虚线','点线','点划线','双点划线','自定义线']self.lineType=[Qt.SolidLine,Qt.DashLine,Qt.DotLine,Qt.DashDotLine,Qt.DashDotLine,Qt.DashDotDotLine]self.fillCol=QColor('white')self.bursh=QBrush(QColor(0,0,0,0))  #透明画刷self.fillType_cn=['无画刷','纯色','线逆转45度','线顺转45度','方格转45度','水平线','竖直线','方格','密集填充1','密集填充2','密集填充3','密集填充4','密集填充5','密集填充6','密集填充7','实体','放射亮点','圆锥投影','图象填充']self.fillType=[Qt.NoBrush,Qt.SolidPattern,Qt.BDiagPattern,Qt.FDiagPattern,Qt.DiagCrossPattern,Qt.HorPattern,Qt.VerPattern,Qt.CrossPattern,Qt.Dense1Pattern,Qt.Dense2Pattern,Qt.Dense3Pattern,Qt.Dense4Pattern,Qt.Dense5Pattern,Qt.Dense6Pattern,Qt.Dense7Pattern,Qt.LinearGradientPattern,Qt.RadialGradientPattern,Qt.ConicalGradientPattern,Qt.TexturePattern                ]self.font=QFont('宋体',9)self.dicLineType,self.dicFillType={},{}for i in range(len(self.lineType_cn)):self.dicLineType[self.lineType_cn[i]]=self.lineType[i]for i in range(len(self.fillType_cn)):self.dicFillType[self.fillType_cn[i]]=self.fillType[i]def getLineType(self,lineTypeStr):return self.dicLineType.get(lineTypeStr,Qt.SolidLine)def getFillType(self,fillTypeStr):return self.dicFillType.get(fillTypeStr,Qt.SolidPattern)class Achart():"""定义图表的显示属性值,统一管理,增加可读性"""def __init__(self,titleName,x=0,y=0,w=0,h=0):#定义可用的图表视图的全部属性self.titleName=titleNameself.view_x=x                    #图表视在父窗口的X位置self.view_y=x                    #图表示在父窗口的y位置 self.view_width=0                #图表示在父窗口视宽度(在外部赋值)self.view_height=0               #图表示在父窗口视高度(在外部赋值)self.chart_x=x                   #图表相对所在父窗口的xself.chart_y=y                   #图表相对所在父窗口的yself.chart_width=w               #图表宽度self.chart_height=h              #图表高度self.chart_minWidth=100          #图表最小宽度self.chart_minHeight=100         #图表最小高度self.chart_maxWidth=1920          #图表最小宽度self.chart_maxHeight=1080         #图表最小高度self.chart_align=Qt.AlignCenter  #图表相对所在父窗口的对齐方式:无用?self.show_legend=True                #是否显示所有图例self.legend_align=Qt.AlignBottom     #所有图例位于图表的下方self.legendTxt_font=QFont("宋体",9)   #所有图例文本字体self.legendTxt_col=None              #所有图例文本显示颜色(为None时表示同图例颜色一致)self.legendTxt_bkcol=None            #所有图例文本背景颜色(为None时表示不要背景)self.titleFont=QFont("黑体",20)    #图表标题字号self.titleCol=QColor('blue')      #图表标题颜色self.titleAlign=Qt.AlignTop       #图表标题位置:顶部self.infoFont=QFont("宋体",9)      #图表实时显示信息字体self.infoCol=QColor('black')      #图表实时显示信息颜色 self.infoAlign=Qt.AlignBottom     #图表实时显示信息位置:在视图底部(X轴下方)      self.view_drag=False              #是否支持拖放视self.show_axis=True               #是否显示XY两轴(暂示支持)self.show_tooltip=True            #是否显示点的tooltip self.show_HScrollBar=Qt.ScrollBarAlwaysOff         #显示视的水平滚动条方式self.show_VScrollBar=Qt.ScrollBarAlwaysOff         #显示视的竖直滚动条方式self.xyOffSet=0.1                #在线条上点选的允许偏差值self.usePointXY=True             #当单击线上任一点进行tooltip标注时,如距离线上节点位置小于偏差值时,tooplip标注的xy值采用节点的xy值(否则标注可能用小许偏差)self.show_buttonXY=False         #在视底部是否显示XY坐标值class AxyAxis():"""XY轴网图表项的全部属性值"""def __init__(self):#定义可用的全部XY轴属性self.text='X轴'                       #x或y轴文字                   self.axis_type=chartType.axis_NUMBER  #轴类型chartType.axis_CATEGORself.vformat="%d"                     #如是数字轴线,数字显示格式,如要显示小数用"%.3f" self.axisCol=QColor('black')        #x或y轴轴线颜色self.textFont=QFont("黑体",20)       #x或y轴文字字体self.textCol=QColor('black')        #x或y轴文字颜色self.min=0                          #x或y轴最小值self.max=0                          #x或y轴最大值self.mainStep=1                     #x或y轴主刻度间隔self.subNum=3                       #x或y轴主间隔间再分子项数量self.mainVisable=True               #x或y轴主刻度是否显示self.mainPen=gf_getPen(col=QColor('black'),linewidth=2,lineType=Qt.SolidLine)    #x或y轴主刻度画线类型(线颜色,线宽、线型)self.subVisable=True                #x或y轴辅刻度是否显示self.subPen=gf_getPen(col=QColor('gray'),linewidth=0.0,lineType=Qt.SolidLine)     #x或y轴辅刻度画线类型(线颜色,线宽、线型)self.align=Qt.AlignBottom           #x或y轴在视上的位置:x默认在 Qt.AlignBottom  y默认在 Qt.AlignLeftself.lstGroupText=["1月", "2月", "3月", "4月", "5月", "6月"]   #对chartType.axis_CATEGOR,分组的文本内容列表:应在使用时初始化合适的内容self.lstSubGroupText=['产品1','产品2','产品3','产品4','产品5']   #每组(如上面每个月)中包含的子项列表,直方图共计数长方形数class Aseries():"""所有图表中图表序列的基类属性"""all_ID=[]def __init__(self,ID,seriesType):self.ID=ID                  #本序列对应的ID号(每self._chart.addSeries(series)一次,此ID号加1,对饼图可能存在多环每环对应一个ID)self.testID(ID)self.show=True              #本序列是否显示self.type=seriesType        #本序列类型chartType枚举self.inItemGroup=True       #本序列是否加入到图表对象中的self.itemGroup对象中,加入后,可以通过设置开关显示或隐藏此组中的系列对象self.legend_show=True       #是否显示本序列的图例self.labelVisible=True      #数据标签是否显示self.labelPos=0             #是否在直方图上显示文字标签位置(各子类需重载)self.labelFormat="@value"   #标签格式为仅数据数字       """="数值:@value"                          #为数值增加其他说明文字 当前支持="(@percent%)"                          #数据换算成百分比显示   QT6支持="{@barset}:@value"                      #对有分组的图表,如直方图和饼图,同时显示分组名和数据名 QT6支持="{@barset}\n@value\n(@percent%)"       #组合显示 QT6支持"""self.attchAxis_xID=0        #本图表项中的数据是否依附当前图表中已创建的X轴(0=关联主X轴,如为-1,则将此图表项按当前X轴范围填满?,数据同X轴上的刻度不会对应,其他数字对应X轴管理器的有的X轴序号)self.attchAxis_yID=0        #同上,关联Y轴...def testID(self,ID):"""测试当前新建的序列series对象分配的ID是否有重复,如有重复,提示错误"""if(ID==-1):self.ID=len(Aseries.all_ID)-1  #ID号从0起Aseries.all_ID.append(self.ID)   #将ID加入类全局变量中if ID in Aseries.all_ID:self.ID=len(Aseries.all_ID)-1Aseries.all_ID.append(self.ID)   #将修改后的ID加入ID列表中print(f"当前新建的图表指定的序列ID={ID}已经存在,系统重新分配此序列对象的ID号={self.ID}")class Alegend(Aseries):"""图表中的图例对象属性"""def __init__(self,ID=-1):super().__init__(ID,seriesType=chartType.LEGEND)self.ID=-1                          #本单个图例对应chart图表的图例的ID号self.legend_Col=None                #为None时表示为默认或同对应序列对象一种颜色self.legend_Size=10                 #本单个图例正方形尺寸        self.legendTxt=''                    #要更改的图例文本内容self.legendTxt_font=QFont("宋体",9)  #图例文本字体self.legendTxt_col=None             #本单个图例文本显示颜色(为None时表示同图例颜色一致)self.legendTxt_bkcol=None           #本单个图例文本背景颜色(为None时表示不要背景)self.legendTxt_align=Qt.AlignRight  #本单个图例文本对齐方式   class Apoint(Aseries):"""图表中直线、曲线图、散点图表项的属性值"""def __init__(self,ID=-1):super().__init__(ID,seriesType=chartType.SCATTER_BUBBLE)self.legendID=[]                 #本系列加入chart后的图例序号self.show_point=True              #是否显示图表中的点self.pointType=chartType.SCATTER_CIRCLE #散点类型为圆形  #chartType.SCATTER_REVRECT#self.pointRevolve=45                    #散点类型旋转矩形时的旋转角度:原有类不支持设置散点为矩形时的旋转角度self.pointCol=QColor('green')     #图表中点显示颜色self.usegradient=True             #是否使用填充渐变(对大量点没必要用)self.pointSize=10                #图表中点显示大小(像素)self.transparent=1.0              #点透明度self.show_pointTxt=True           #是否显示点文本self.pointTxtCol= QColor('black') #图表中点文本显示颜色self.pointTxtFont=QFont("宋体",9) #图表中点文本显示字体self.pointCol_sel=QColor('red')   #图表中点被选择时显示颜色self.pointSize_sel=20            #图表中点被选择时显示大小(像素):只是相对值,如果画图表项时进行适配坐标缩放,此显示效果相应缩放self.sort=True                   #是否对原始坐标点进行排序class Aline(Aseries):"""图表中直线、曲线图、散点图表项的属性值"""def __init__(self,ID=-1):super().__init__(ID,seriesType=chartType.LINE)self.legendID=[]                 #本系列加入chart后的图例序号self.show_line=True              #是否显示图表中的线self.lineCol=QColor('green')     #图表中线显示颜色self.lineWidth=2                 #图表中线显示宽度(像素)self.lineType=Qt.SolidLine       #图表中线类型 self.lineCol_sel=QColor('red')   #图表中线被选择时显示颜色self.lineWidth_sel=5              #图表中线被选择时显示大小(像素)self.show_point=True              #是否显示图表中的点self.pointCol=QColor('green')     #图表中点显示颜色self.pointSize=3                 #图表中点显示大小(像素):只是相对值,如果画图表项时进行适配坐标缩放,此显示效果相应缩放self.transparent=1.0              #点透明度self.show_pointTxt=True           #是否显示点文本self.pointTxtCol= QColor('black')#图表中点文本显示颜色self.pointTxtFont=QFont("宋体",12) #图表中点文本显示字体self.pointCol_sel=QColor('red')   #图表中点被选择时显示颜色self.pointSize_sel=10              #图表中点被选择时显示大小(像素)self.sort=True                    #是否对原始坐标点进行排序:即画线时总是按排序后的点沿一个方向绘制class Abar(Aseries):"""直方图图表项的全部属性值"""def __init__(self,ID=-1):super().__init__(ID,seriesType=chartType.BAR)self.bartype=chartType.BAR_H       #水平直方图堆叠self.bartype=chartType.BAR_Vself.legendID=[]                   #本系列加入chart后的图例序号列表,对直方图图例可能占用chart图例对象1-n个self.groupNumber=1                 #直方图每系列数量(1~n) self.x_min=0    #设置直方图在图表显示范围上的区段:如图表上已有数字类型图表项(直方图将新建一标签类轴线叠加到数字轴线下方)self.x_max=1    #1表示对标签字直主图填满本轴线顶部长度self.labelPos=QStackedBarSeries.LabelsCenter  #是否在直方图上显示文字标签位置(各子类需重载)"""QStackedBarSeries.LabelsCenter      数据值居中显示QStackedBarSeries.LabelsInsideEnd   内部顶端  QStackedBarSeries.LabelsInsideBase  内部底端QStackedBarSeries.LabelsOutsideEnd  #外部顶端              """self_labelFont=QFont("黑体",11)                #直方图标签字体self_labelCol=QColor('black')                  #直方图标签颜色self.attchAxis_xID=-1               self.attchAxis_yID=0     self.barWidth=0.8        #直方图每项的宽度(沿X轴可能有几项,每项可在每组中横向叠拼,也可竖向叠拼)self.barOrg=0            #=0,每项沿X轴叠拼,1=每项沿Y轴叠拼  class Apie(Aseries):"""定义饼图图表项的全部的属性值"""   def __init__(self,ID=-1):super().__init__(ID,seriesType=chartType.PIE)#定义可用的全部饼图属性  self.legendID=[]                     #本系列的一环加入chart后的图例序号列表,对饼图图例可能占用chart图例对象1-n个,每个环切片占用一个图例索引号self.groupNumber=1                   #饼图每系列(每一环为一个系列,多环就有多个系列)数量(1~n)self.attchAxis_xID=-1               self.attchAxis_yID=-1               self.pieName=''                    #饼图名称self.pieLine=gf_getPen(col=QColor('blue'),linewidth=1,lineType=Qt.SolidLine)   #饼图线属性self.pieHoleSize=0.35    #饼图中心空白区尺寸self.pieSize=0.65        #饼图尺寸self.useAni=True         #是否定时动画显示  self.ainTime=2000        #动画每毫秒执行一次self.donutCount=1        #饼图环数self.slcCount=2          #每环的切片数量self.minSize=0.1self.maxSize=0.5self.labelVisible=True                          #饼切片标签self.labelFont=QFont("仿宋体",9)                 #饼切片标签self.labelCol=QColor('green')                   #饼切片标签self.labelPos=QPieSlice.LabelInsideTangential   #饼切片标签位置QPieSlice.LabelOutside = 外部   QPieSlice.LabelInsideTangential=内部################################################################################
#PYTHONT或PYQT5/6支持的可用文字表示的颜色列表
dic_Cols={"lightpink":[[255,192,193],0xFFB6C1,"浅粉红色"],"pink":[[255,192,203],0xFFC0CB,"粉红色"],"crimson":[[220,20,60],0xDC143C,"猩红色"],"lavenderblush":[[255,240,245],0xFFF0F5,"脸红的淡紫色"],"palevioletred":[[219,112,147],0xDB7093,"苍白的紫罗兰红色"],"hotpink":[[255,105,180],0xFF69B4,"热情的粉红"],"deeppink":[[255,20,147],0xFF1493,"深粉色"],"mediumvioletred":[[199,21,133],0xC71585,"适中的紫罗兰红色"],"orchid":[[218,112,214],0xDA70D6,"兰花的紫色"],"thistle":[[216,191,216],0xD8BFD8,"蓟色"],"plum":[[221,160,221],0xDDA0DD,"李子色"],"violet":[[238,130,238],0xEE82EE,"紫罗兰色"],"magenta":[[255,0,255],0xFF00FF,"洋红色"],"fuchsia":[[255,0,255],0xFF00FF,"灯笼海棠(紫红色)"],"darkmagenta":[[139,0,139],0x8B008B,"深洋红色"],"purple":[[128,0,128],0x800080,"紫色"],"mediumorchid":[[186,85,211],0xBA55D3,"适中的兰花紫色"],"darkviolet":[[148,0,211],0x9400D3,"深紫罗兰色"],"darkorchid":[[153,50,204],0x9932CC,"深兰花紫"],"indigo":[[75,0,130],0x4B0082,"靛青色"],"blueviolet":[[138,43,226],0x8A2BE2,"深紫罗兰的蓝色"],"mediumpurple":[[147,112,219],0x9370DB,"适中的紫色"],"mediumslateblue":[[123,104,238],0x7B68EE,"适中的板岩暗蓝灰色"],"slateblue":[[106,90,205],0x6A5ACD,"板岩暗蓝灰色"],"darkslateblue":[[72,61,139],0x483D8B,"深岩暗蓝灰色"],"lavender":[[230,230,250],0xE6E6FA,"熏衣草花的淡紫色"],"ghostwhite":[[248,248,255],0xF8F8FF,"幽灵的白色"],"blue":[[0,0,255],0x0000FF,"纯蓝色"],"mediumblue":[[0,0,205],0x0000CD,"适中的蓝色"],"midnightblue":[[25,25,112],0x191970,"午夜的蓝色"],"darkblue":[[0,0,139],0x00008B,"深蓝色"],"navy":[[0,0,128],0x000080,"海军蓝色"],"royalblue":[[65,105,225],0x4169E1,"皇军蓝色"],"cornflowerblue":[[100,149,237],0x6495ED,"矢车菊的蓝色"],"lightsteelblue":[[176,196,222],0xB0C4DE,"淡钢蓝色"],"lightslategray":[[119,136,153],0x778899,"浅石板灰色"],"slategray":[[112,128,144],0x708090,"石板灰色"],"dodgerblue":[[30,144,255],0x1E90FF,"道奇蓝色"],"aliceblue":[[240,248,255],0xF0F8FF,"爱丽丝蓝"],"steelblue":[[70,130,180],0x4682B4,"钢蓝"],"lightskyblue":[[135,206,250],0x87CEFA,"淡蓝色"],"skyblue":[[135,206,235],0x87CEEB,"天蓝色"],"deepskyblue":[[0,191,255],0x00BFFF,"深天蓝"],"lightblue":[[173,216,230],0xADD8E6,"淡蓝"],"powderblue":[[176,224,230],0xB0E0E6,"火药蓝"],"cadetblue":[[95,158,160],0x5F9EA0,"军校蓝"],"azure":[[240,255,255],0xF0FFFF,"蔚蓝色"],"lightcyan":[[225,255,255],0xE1FFFF,"淡青色"],"paleturquoise":[[175,238,238],0xAFEEEE,"苍白的绿宝石"],"cyan":[[0,255,255],0x00FFFF,"青色"],"aqua":[[0,255,255],0x00FFFF,"水绿色"],"darkturquoise":[[0,206,209],0x00CED1,"深绿宝石色"],"darkslategray":[[47,79,79],0x2F4F4F,"深石板灰色"],"darkcyan":[[0,139,139],0x008B8B,"深青色"],"teal":[[0,128,128],0x008080,"水鸭色"],"mediumturquoise":[[72,209,204],0x48D1CC,"适中的绿宝石色"],"lightseagreen":[[32,178,170],0x20B2AA,"浅海洋绿色"],"turquoise":[[64,224,208],0x40E0D0,"绿宝石色"],"aquamarine":[[127,255,170],0x7FFFAA,"绿玉、碧绿色"],"mediumaquamarine":[[0,250,154],0x00FA9A,"适中的碧绿色"],"mediumspringgreen":[[245,255,250],0xF5FFFA,"适中的春天绿色"],"mintcream":[[0,255,127],0x00FF7F,"薄荷奶油色"],"springgreen":[[60,179,113],0x3CB371,"春天的绿色"],"seagreen":[[46,139,87],0x2E8B57,"海洋绿色"],"honeydew":[[240,255,240],0xF0FFF0,"蜂蜜色"],"lightgreen":[[144,238,144],0x90EE90,"淡绿色"],"palegreen":[[152,251,152],0x98FB98,"苍白的绿色"],"darkseagreen":[[143,188,143],0x8FBC8F,"深海洋绿"],"limegreen":[[50,205,50],0x32CD32,"酸橙绿"],"lime":[[0,255,0],0x00FF00,"酸橙色"],"forestgreen":[[34,139,34],0x228B22,"森林绿"],"green":[[0,128,0],0x008000,"纯绿"],"darkgreen":[[0,100,0],0x006400,"深绿色"],"chartreuse":[[127,255,0],0x7FFF00,"查特酒绿"],"lawngreen":[[124,252,0],0x7CFC00,"草坪绿"],"greenyellow":[[173,255,47],0xADFF2F,"绿黄色"],"olivedrab":[[85,107,47],0x556B2F,"橄榄土褐色"],"beige":[[107,142,35],0x6B8E23,"米色(浅褐色)"],"lightgoldenrodyellow":[[250,250,210],0xFAFAD2,"浅秋麒麟黄"],"ivory":[[255,255,240],0xFFFFF0,"象牙色"],"lightyellow":[[255,255,224],0xFFFFE0,"浅黄色"],"yellow":[[255,255,0],0xFFFF00,"纯黄"],"olive":[[128,128,0],0x808000,"橄榄色"],"darkkhaki":[[189,183,107],0xBDB76B,"深卡其布色"],"lemonchiffon":[[255,250,205],0xFFFACD,"柠檬薄纱色"],"palegoldenrod":[[238,232,170],0xEEE8AA,"灰秋麒麟色"],"khaki":[[240,230,140],0xF0E68C,"卡其布色"],"gold":[[255,215,0],0xFFD700,"金色"],"cornsilk":[[255,248,220],0xFFF8DC,"玉米色"],"goldenrod":[[218,165,32],0xDAA520,"秋麒麟色"],"floralwhite":[[255,250,240],0xFFFAF0,"花的白色"],"oldlace":[[253,245,230],0xFDF5E6,"老饰带色"],"wheat":[[245,222,179],0xF5DEB3,"小麦色色"],"moccasin":[[255,228,181],0xFFE4B5,"鹿皮鞋色"],"orange":[[255,165,0],0xFFA500,"橙色"],"papayawhip":[[255,239,213],0xFFEFD5,"番木瓜色"],"blanchedalmond":[[255,235,205],0xFFEBCD,"漂白的杏仁色"],"navajowhite":[[255,222,173],0xFFDEAD,"纳瓦尔白色"],"antiquewhite":[[250,235,215],0xFAEBD7,"古代的白色"],"tan":[[210,180,140],0xD2B48C,"晒黑色"],"burlywood":[[222,184,135],0xDEB887,"结实的树色"],"bisque":[[255,228,196],0xFFE4C4,"(浓汤)乳脂,番茄色"],"darkorange":[[255,140,0],0xFF8C00,"深橙色"],"linen":[[250,240,230],0xFAF0E6,"亚麻布色"],"peru":[[205,133,63],0xCD853F,"秘鲁色"],"peachpuff":[[255,218,185],0xFFDAB9,"桃色"],"sandybrown":[[244,164,96],0xF4A460,"沙棕色"],"chocolate":[[210,105,30],0xD2691E,"巧克力色"],"saddlebrown":[[139,69,19],0x8B4513,"马鞍棕色"],"seashell":[[255,245,238],0xFFF5EE,"海贝壳色"],"sienna":[[160,82,45],0xA0522D,"黄土赭色"],"lightsalmon":[[255,160,122],0xFFA07A,"浅鲜肉(鲑鱼)色"],"coral":[[255,127,80],0xFF7F50,"珊瑚色"],"orangered":[[255,69,0],0xFF4500,"橙红色"],"darksalmon":[[233,150,122],0xE9967A,"深鲜肉(鲑鱼)色"],"tomato":[[255,99,71],0xFF6347,"番茄色"],"mistyrose":[[255,228,225],0xFFE4E1,"薄雾玫瑰色"],"salmon":[[250,128,114],0xFA8072,"鲜肉(鲑鱼)色"],"snow":[[255,250,250],0xFFFAFA,"白雪色"],"lightcoral":[[240,128,128],0xF08080,"淡珊瑚色"],"rosybrown":[[188,143,143],0xBC8F8F,"玫瑰棕色"],"indianred":[[205,92,92],0xCD5C5C,"印度红色"],"red":[[255,0,0],0xFF0000,"纯红色"],"brown":[[165,42,42],0xA52A2A,"棕色"],"firebrick":[[178,34,34],0xB22222,"耐火砖色"],"darkred":[[139,0,0],0x8B0000,"深红色"],"maroon":[[128,0,0],0x800000,"栗色"],"white":[[255,255,255],0xFFFFFF,"纯白色"],"whitesmoke":[[245,245,245],0xF5F5F5,"白烟色"],"gainsboro":[[220,220,220],0xDCDCDC,"亮灰色"],"lightgrey":[[211,211,211],0xD3D3D3,"浅灰色"],"silver":[[192,192,192],0xC0C0C0,"银白色"],"darkgray":[[169,169,169],0xA9A9A9,"深灰色"],"gray":[[128,128,128],0x808080,"灰色"],"dimgray":[[105,105,105],0x696969,"暗淡灰"],"black":[[0,0,0],0x000000,"纯黑色"]
}
#得到PYTHON字符串转换成颜色对象的RGB255列表值,默认返回0-1的值,同vtk要求的值一致
def gf_getColRgb(colstr,deflstcol=[[211,211,211],0xD3D3D3,"浅灰色"],b255=False):colstr=str.lower(colstr)lst_col = dic_Cols.get(colstr,deflstcol) #用get函数来得到对应字典key的值,如果没有,得到默认值,防报错if(not b255):newCol=[lst_col[0][0]/255.,lst_col[0][1]/255.,lst_col[0][2]/255.]return newColreturn lst_col[0]    #返回lst_col[1]结果一样#将上面的字典转换成列表['英文色',[R,G,B],'中文色']
def gf_getColList():lstAllCol=[[]]lstAllCol.clear()#遍历字典得到数据值for key in dic_Cols:lstDic=dic_Cols[key]#       'black' [0,0,0] '纯黑'oneCol=[key,lstDic[0],lstDic[2]]lstAllCol.append(oneCol)return lstAllCol#根据英文,得到色彩的中文名
def gf_getChineseColInfo(colstr):if(colstr==None):return ''colstr=str.lower(colstr)lst_col = dic_Cols.get(colstr,None)if(lst_col != None): colstr=f'{lst_col[2]}(r={lst_col[0][0]},g={lst_col[0][1]},b={lst_col[0][2]})' return colstr     else:return '未知颜色'def gf_getCommonCol(num,minID=0,maxID=24,useRandID=False,reQColor=False):"""从图表常用的24种颜色中得到一种颜色值,返回颜色的字符串或QColor值"""lstCol=['#4E79A7', #0:深邃蓝'#F28E2C', #1:温暖橘色'#E15759', #2:红宝石色'#76B7B2', #3:蓝绿色'#59A14F', #4:森林绿'#EDC949', #5:金黄色'#B07AA1', #6:紫罗兰色'#FF9DA7', #7:珊瑚粉'#9C755F', #8:咖啡综'#BAB0AC', #9:高级灰'#5F9E93', #10:翡翠绿'#D37295', #11:莓果紫'#8CD17D', #12:嫩绿色'#FABFD2', #13:樱花粉'#499894', #14:深青绿'#79706E', #15:炭灰色'#D4A6C8', #16:薰衣草紫'#86BCB6', #17:浅水蓝'#FFBE7D', #18:蜜橙色'#A0DBE8', #19:天蓝色'#F1CE63', #20:琥珀色'#E8A1BE', #21:玫瑰粉'#B6992D', #22:橄榄金'#D7B5A6', #23:浅陶土色]newColList=[]if(num>24):num=24if(num<1):num=1if(useRandID):randID=random.sample(range(24),24)newColList=[lstCol[randID[x]] for x in range(0,num)]else:if(minID<0):minID=0if(minID>=24):minID=23if(maxID<0):maxID=0if(maxID>=24):maxID=23if(minID>maxID):minID=maxIDif(num>(maxID-minID)):print(f'指定ID范围太小,返回色彩数不足')newColList=lstCol[minID:]else:newColList=lstCol[minID:minID+num]if(reQColor):return [lambda x: QColor(x),newColList]return   newColList  #1、图示视图上的构件相关类:类似于提示框的标识类(可画在图表视上)
class charTooltip(QGraphicsItem):         #QGraphicsItem为视QGraphicsView的一个部件"""在指定停泊位置处单击后画出坐标点提示框内容"""def __init__(self, chart,axisX,axisY):QGraphicsItem.__init__(self, chart)self._chart = chart                   #传入图表对象self._chart = chart = QChart()self.axisX=axisX                      #为避免映射的坐标轴因调整图表项系列绘制顺序发生变化,造成self._chart.mapToPosition()值变化,指定本类对象采用的轴self.axisY=axisYself._text = ""                       #单击线条后显示的坐标数据提示文本self._textRect = QRectF()             #提示文本矩形self._anchor = QPointF()              #停泊点self._font = QFont()self._rect = QRectF()self.sel_xyOffSet=0.1    #选择视图上的点的容许偏差值def boundingRect(self):"""计算要显示的停泊点提示框的矩形提示框"""anchor = self.mapFromParent(self._chart.mapToPosition(self._anchor))   #停泊点显示的实例化对象rect = QRectF()rect.setLeft(min(self._rect.left(), anchor.x()))rect.setRight(max(self._rect.right(), anchor.x()))rect.setTop(min(self._rect.top(), anchor.y()))rect.setBottom(max(self._rect.bottom(), anchor.y()))return rectdef paint(self, painter, option, widget):"""重载绘视图"""path = QPainterPath()path.addRoundedRect(self._rect, 5, 5)   #提示矩形框的四角倒园尺寸,值越大越接接园anchor = self.mapFromParent(self._chart.mapToPosition(self._anchor))if not self._rect.contains(anchor) and not self._anchor.isNull():point1 = QPointF()point2 = QPointF()# 在已设立的位置关联停泊点的矩形区above = anchor.y() <= self._rect.top()above_center = (anchor.y() > self._rect.top()and anchor.y() <= self._rect.center().y())below_center = (anchor.y() > self._rect.center().y()and anchor.y() <= self._rect.bottom())below = anchor.y() > self._rect.bottom()on_left = anchor.x() <= self._rect.left()left_of_center = (anchor.x() > self._rect.left()and anchor.x() <= self._rect.center().x())right_of_center = (anchor.x() > self._rect.center().x()and anchor.x() <= self._rect.right())on_right = anchor.x() > self._rect.right()#得到停泊点最近的矩形区.x = (on_right + right_of_center) * self._rect.width()y = (below + below_center) * self._rect.height()corner_case = ((above and on_left) or (above and on_right)or (below and on_left) or (below and on_right))vertical = abs(anchor.x() - x) > abs(anchor.y() - y)x1 = (x + left_of_center * 10 - right_of_center * 20 + corner_case* int(not vertical) * (on_left * 10 - on_right * 20))y1 = (y + above_center * 10 - below_center * 20 + corner_case* vertical * (above * 10 - below * 20))point1.setX(x1)point1.setY(y1)x2 = (x + left_of_center * 20 - right_of_center * 10 + corner_case* int(not vertical) * (on_left * 20 - on_right * 10))y2 = (y + above_center * 20 - below_center * 10 + corner_case* vertical * (above * 20 - below * 10))point2.setX(x2)point2.setY(y2)path.moveTo(point1)path.lineTo(anchor)path.lineTo(point2)   #绘制矩形提示框到停泊点的连线(两根尖角线)path = path.simplified()painter.setBrush(QColor(255, 255, 255))painter.drawPath(path)painter.drawText(self._textRect, self._text)def mousePressEvent(self, event):event.setAccepted(True)def mouseMoveEvent(self, event):if event.buttons() & Qt.LeftButton:self.setPos(self.mapToParent(event.pos() - event.buttonDownPos(Qt.LeftButton)))event.setAccepted(True)else:event.setAccepted(False)def set_text(self, text):"""设置提示框内容文本"""self._text = textmetrics = QFontMetrics(self._font)                             #计算停泊点位置矩形的对外象                    self._textRect = QRectF(metrics.boundingRect(                  #计算停泊点的文本显示矩形区QRect(0.0, 0.0, 150.0, 150.0), Qt.AlignLeft, self._text))self._textRect.translate(5, 5)self.prepareGeometryChange()          #应用变化self._rect = self._textRect.adjusted(-5, -5, 5, 5)def set_anchor(self, point):self._anchor = QPointF(point)def update_geometry(self):"""更新显示位置"""self.prepareGeometryChange()pos=self._chart.mapToPosition(self._anchor) + QPointF(10, -50)#pos=self._chart.mapToPosition(self._anchor,self.axisX,self.axisY) + QPointF(10, -50)#print(f'显示位置={pos}')   #对图表self_chart排序重绘后self.create_order_series([0,2]),此位置发生了变化???????????????????self.setPos(pos)
在图表视上要执行画板功能时,需要一悬浮工具窗体模块painterSet.py
# -*- coding: utf-8 -*-
"""
painterSet.py  画板的所画图形的设置属性悬浮窗体
"""
import sys,os,time,math,copy,random
from math import *
import PySide6
from PySide6 import *
from PySide6.QtCore  import *
from PySide6.QtWidgets  import *
from PySide6.QtWidgets import (QApplication,  QHBoxLayout, QLabel, QPushButton, QWidget)
from PySide6.QtCore import ( QObject, QPoint, QRect,  QSize,  Qt)
from PySide6.QtGui import (QAction, QBrush, QColor,  QCursor, QFont, QFontDatabase, QPainter,QPalette,QPixmap,QLinearGradient,QRadialGradient,QConicalGradient)
from chartAttrib import *
#################################################################################################################
#pyside6-uic -o  ui_PainterSet.py ./ui/PainterSet.ui      #编绎此子窗口UI到PY代码的命令
from ui_PainterSet import Ui_PainterSet                   #加载编绎后的UI窗体代码(此代码一般不要加自写代码,因每编译一次会覆盖一次)#*********************************子窗体Widget_5模块,基于ui创建*****************************************
#子窗体模块【源自界面文件: ./ui/PainterSet.ui->ui_PainterSet.py】
class painterSet(QWidget,Ui_PainterSet):#窗体自定义信号格式,参数可以为:int,str,float,list,object等类型,用object时可传递窗体本身self、控件,文件内容,字典等任意类型sendData = Signal(object)               #自定义信号【sendData】,用于属性变化时,将当前全部设置属性发送给父窗口#窗体类初始化构造函数def __init__(self,parent=None):super(painterSet, self).__init__(parent)self.setupUi(self)                      #安装子窗口的UI  #主窗口界面的一些其他初始化设置self.setWindowTitle('画板设置')self.setWindowFlags(Qt.FramelessWindowHint | Qt.WindowStaysOnTopHint)self.setStyleSheet("""painterSet {background-color: gainsboro;border: 2px solid darkgray;          border-radius: 5px;box-shadow: 0 0 5px rgba(0,0,0,0.5)}""")self.move_Flag=Trueself.bObjSeled=Falseself.lstSet=[QColor('black'),QColor('white'),QFont('宋体',9),2,Qt.SolidLine,Qt.SolidPattern,0]self.a_draw= Apainter()self.mouse_x=self.mouse_y=0self.initUI()                           #其他初始化代码self.init_sign()                        #控件信号槽定义初始化代码#除了ui界面文件界面初始化的内容外,还需要子窗口2初始化的代码    def initUI(self):self.combo_lineType.addItems(self.a_draw.lineType_cn)self.combo_fillType.addItems(self.a_draw.fillType_cn)self.combo_fillType.setCurrentIndex(1)self.label_Show.setReDrawAttrib(self.lstSet) self.raise_()                              #窗体在最上        #************************************定义子窗体的其他功能函数*****************************************************#1、def init_sign(self):    self.btnExit.clicked.connect(self.closeWindow)          #单击子窗体按纽【self.btnExit】时的响应槽函数   self.btn_lineCol.clicked.connect(self.openFnColDlg)   self.btn_fillCol.clicked.connect(self.openBkColDlg)self.btnTxtFont.clicked.connect(self.openFontDlg)self.spin_lineWidth.valueChanged.connect(self.sendDataToView)self.combo_lineType.currentIndexChanged.connect(self.lineTypeChged)self.combo_fillType.currentIndexChanged.connect(self.fillTypeChged)#************************************定义子窗体响应信号的槽函数*****************************************************#槽方法:对应子窗口按纽【self.pushButton】被单击的槽响应函数,用于向主窗体发送一列表变量#发送信号的对象:所有选择项变化时(包括关闭窗口时)@Slot(list)def sendDataToView(self,hasBrush=False):self.lstSet[3]=self.spin_lineWidth.value()self.lstSet[4]=self.a_draw.getLineType(self.combo_lineType.currentText())self.lstSet[6]=self.combo_fillType.currentIndex()if(not hasBrush):     #如画刷在前面的代码中没有被初始化,直接用函数默认值self.lstSet[5]=self.a_draw.getFillType(self.combo_fillType.currentText())self.label_Show.setReDrawAttrib(self.lstSet)   #更新显示本窗体上的一样例标签控件self.sendData.emit(self.lstSet)                #定自义信号【sendData】应位于类构造函数__init__前面def lineTypeChged(self):"""线类型组合框选项发生变化时"""self.sendDataToView()   #传回设置数据给父窗口def fillTypeChged(self):"""填充类型组合框选项发生变化时"""curSelID=self.combo_fillType.currentIndex()self.lstSet[6]=curSelIDif(curSelID==15):                         #15 '实体'linear_gradient = QLinearGradient(0, 0, 100, 100)linear_gradient.setColorAt(0.0, Qt.white)linear_gradient.setColorAt(0.2, Qt.green)linear_gradient.setColorAt(1.0, Qt.black)self.lstSet[5]=(QBrush(linear_gradient))self.sendDataToView(True)   #传回设置数据给父窗口:True参数通知后面的方法画刷在此方法中已被设置好了,不能再用默认值覆盖if(curSelID==16):                         #16 '放射状(有一亮点散射)'radial_gradient = QRadialGradient(50, 50, 50, 70, 70)radial_gradient.setColorAt(0.0, Qt.white)radial_gradient.setColorAt(0.2, Qt.green)radial_gradient.setColorAt(1.0, Qt.black)self.lstSet[5]=(QBrush(radial_gradient))self.sendDataToView(True)   #传回设置数据给父窗口:True参数通知后面的方法画刷在此方法中已被设置好了,不能再用默认值覆盖elif(curSelID==17):                         #17  '圆锥投影(有一时钟刻度)'conical_gradient = QConicalGradient(50, 50, 150)conical_gradient.setColorAt(0.0, Qt.white)conical_gradient.setColorAt(0.2, Qt.green)conical_gradient.setColorAt(1.0, Qt.black)self.lstSet[5]=(QBrush(conical_gradient))self.sendDataToView(True)   #传回设置数据给父窗口:True参数通知后面的方法画刷在此方法中已被设置好了,不能再用默认值覆盖elif(curSelID==18):                         #18 '图象'fillFileName=sys.path[0]+'\\fill.png'if(not os.path.exists(fillFileName)):result=QMessageBox.warning(self,'警告',f'用于绘图填充的图像文件:{fillFileName} 不存在,按【是】将允许选定一文件作为填充文件',QMessageBox.Yes|QMessageBox.No)if(result==QMessageBox.Yes):fillFileName,filter = QFileDialog.getSaveFileName(self, '打开文件', './','png文件(*.png);;jpg文件(*.jpg);;所有文件(*.*)')else:returnbrush=QBrush(QPixmap(fillFileName))   # self.lstSet[5]= brush                 #重新指定画刷self.sendDataToView(True)            #传回设置数据给父窗口:True参数通知后面的方法画刷在此方法中已被设置好了,不能再用默认值覆盖else:self.sendDataToView(False)   #@Slot(list)def closeWindow(self):self.sendData.emit(self.lstSet)    self.close()@Slot()def openFnColDlg(self):fnCol = QColorDialog.getColor()self.lstSet[0]=fnColself.label_Show.setReDrawAttrib(self.lstSet)self.sendData.emit(self.lstSet)@Slot()def openBkColDlg(self):bkcol = QColorDialog.getColor()self.lstSet[1]=bkcolself.label_Show.setReDrawAttrib(self.lstSet)self.sendData.emit(self.lstSet)@Slot()def openFontDlg(self):QLocale.setDefault(QLocale(QLocale.Chinese, QLocale.China)) #设置打开的对话框为中文:没见到效果?ok,font= QFontDialog.getFont()if ok:fontstr='字体:,'+font.family()+',字号:'+str(font.pointSize())if(font.bold):fontstr = fontstr+",加粗"if(font.italic):fontstr = fontstr+",斜体"if(font.underline):fontstr = fontstr+",下划线"if(font.strikeOut):fontstr = fontstr+",删除线"print(fontstr)self.lstSet[2]=fontself.label_Show.setReDrawAttrib(self.lstSet)self.sendData.emit(self.lstSet)#鼠标按下事件重载   def mousePressEvent(self, event):   #如在其子类又重载了此事件,子类中要加上super(A_Obj, self).mousePressEvent(event) #调用其父类的同样事件                               print(f'鼠标压下:当前坐标:x={event.pos().x()},y={event.pos().y()}')# 当点击时候,先重新初始化拖动标识位为否#self.move_Flag = False# 核心部分: 当鼠标点击是左键 并且 在top控件内点击时候触发 (这里的top控件即为 我自定义的顶部窗体)if (event.button() == Qt.LeftButton and self.move_Flag):    #and self.top.underMouse():self.setCursor(Qt.OpenHandCursor)    #移动时设置成手型光标# 但判断条件满足时候, 把拖动标识位设定为真#self.move_Flag = Trueself.mouse_x = event.globalX()self.mouse_y = event.globalY()# 获取窗体当前坐标self.origin_x = self.x()self.origin_y = self.y()self.bObjSeled=True  elif event.button() == Qt.RightButton:  #打开一半透明窗体,窗体上列出对象的属性值pass#鼠标移动事件重载          def mouseMoveEvent(self, event):  #print(f'ALL_Obj鼠标移动:当前坐标:x={event.pos().x()},y={event.pos().y()}')# 拖动标识位设定为真时, 进入移动事件if self.move_Flag:# 计算鼠标移动的x,y位移move_x = event.globalX() - self.mouse_xmove_y = event.globalY() - self.mouse_y# 计算窗体更新后的坐标:更新后的坐标 = 原本的坐标 + 鼠标的位移dest_x = self.origin_x + move_xdest_y = self.origin_y + move_y# 移动窗体size = self.geometry()self.move(dest_x, dest_y)self.gox=dest_x+size.width()/2   #不加这两行,放开对象后,对象在计时器的执行下回到上一个位置 self.goy=dest_y+size.height()/2self.raise_() #拖动的标签控件角色在最顶端显示# 鼠标左键释放        def mouseReleaseEvent(self, event):#print(f'ALL_Obj鼠标释放:当前坐标:x={event.pos().x()},y={event.pos().y()}')# 设定鼠标为普通状态: 箭头self.setCursor(Qt.ArrowCursor)if event.button() == Qt.LeftButton:self.endPoint = event.pos()#print(f'当前坐标:x={event.pos().x()},y={event.pos().y()}')
对应painterSet.py的UI编绎后的窗体UI模块ui_PainterSet.py代码如下
# -*- coding: utf-8 -*-################################################################################
## Form generated from reading UI file 'PainterSet.ui'
##
## Created by: Qt User Interface Compiler version 6.8.0
##
## WARNING! All changes made in this file will be lost when recompiling UI file!
################################################################################from PySide6.QtCore import (QCoreApplication, QDate, QDateTime, QLocale,QMetaObject, QObject, QPoint, QRect,QSize, QTime, QUrl, Qt)
from PySide6.QtGui import (QBrush, QColor, QConicalGradient, QCursor,QFont, QFontDatabase, QGradient, QIcon,QImage, QKeySequence, QLinearGradient, QPainter,QPalette, QPixmap, QRadialGradient, QTransform)
from PySide6.QtWidgets import (QApplication, QComboBox, QFrame, QLabel,QPushButton, QSizePolicy, QSpinBox, QWidget)from paintSample import paintSampleclass Ui_PainterSet(object):def setupUi(self, PainterSet):if not PainterSet.objectName():PainterSet.setObjectName(u"PainterSet")PainterSet.setWindowModality(Qt.WindowModality.NonModal)PainterSet.resize(165, 130)PainterSet.setContextMenuPolicy(Qt.ContextMenuPolicy.NoContextMenu)self.btnExit = QPushButton(PainterSet)self.btnExit.setObjectName(u"btnExit")self.btnExit.setGeometry(QRect(150, 0, 16, 16))font = QFont()font.setFamilies([u"Arial"])font.setBold(True)self.btnExit.setFont(font)self.btnExit.setCursor(QCursor(Qt.CursorShape.PointingHandCursor))self.btn_lineCol = QPushButton(PainterSet)self.btn_lineCol.setObjectName(u"btn_lineCol")self.btn_lineCol.setGeometry(QRect(10, 10, 52, 20))font1 = QFont()font1.setFamilies([u"\u4eff\u5b8b"])font1.setPointSize(8)self.btn_lineCol.setFont(font1)self.btn_lineCol.setCursor(QCursor(Qt.CursorShape.PointingHandCursor))self.btnTxtFont = QPushButton(PainterSet)self.btnTxtFont.setObjectName(u"btnTxtFont")self.btnTxtFont.setGeometry(QRect(10, 50, 52, 21))self.btnTxtFont.setFont(font1)self.btnTxtFont.setCursor(QCursor(Qt.CursorShape.PointingHandCursor))self.label_2 = QLabel(PainterSet)self.label_2.setObjectName(u"label_2")self.label_2.setGeometry(QRect(10, 70, 58, 21))self.label_2.setFont(font1)self.label_2.setFrameShape(QFrame.Shape.NoFrame)self.label_2.setFrameShadow(QFrame.Shadow.Plain)self.btn_fillCol = QPushButton(PainterSet)self.btn_fillCol.setObjectName(u"btn_fillCol")self.btn_fillCol.setGeometry(QRect(10, 30, 52, 20))self.btn_fillCol.setFont(font1)self.btn_fillCol.setCursor(QCursor(Qt.CursorShape.PointingHandCursor))self.label_3 = QLabel(PainterSet)self.label_3.setObjectName(u"label_3")self.label_3.setGeometry(QRect(10, 90, 58, 16))self.label_3.setFont(font1)self.label_5 = QLabel(PainterSet)self.label_5.setObjectName(u"label_5")self.label_5.setGeometry(QRect(10, 110, 58, 16))self.label_5.setFont(font1)self.spin_lineWidth = QSpinBox(PainterSet)self.spin_lineWidth.setObjectName(u"spin_lineWidth")self.spin_lineWidth.setGeometry(QRect(70, 70, 79, 16))self.spin_lineWidth.setFont(font1)self.spin_lineWidth.setMinimum(1)self.spin_lineWidth.setMaximum(200)self.combo_lineType = QComboBox(PainterSet)self.combo_lineType.setObjectName(u"combo_lineType")self.combo_lineType.setGeometry(QRect(70, 90, 79, 16))self.combo_lineType.setFont(font1)self.combo_fillType = QComboBox(PainterSet)self.combo_fillType.setObjectName(u"combo_fillType")self.combo_fillType.setGeometry(QRect(70, 110, 79, 16))self.combo_fillType.setFont(font1)self.label_Show = paintSample(PainterSet)self.label_Show.setObjectName(u"label_Show")self.label_Show.setGeometry(QRect(70, 10, 81, 61))self.label_Show.setFrameShape(QFrame.Shape.Box)self.label_Show.setFrameShadow(QFrame.Shadow.Raised)self.label_Show.setAlignment(Qt.AlignmentFlag.AlignBottom|Qt.AlignmentFlag.AlignHCenter)self.retranslateUi(PainterSet)QMetaObject.connectSlotsByName(PainterSet)# setupUidef retranslateUi(self, PainterSet):PainterSet.setWindowTitle(QCoreApplication.translate("PainterSet", u"\u753b\u677f\u8bbe\u7f6e", None))
#if QT_CONFIG(tooltip)self.btnExit.setToolTip(QCoreApplication.translate("PainterSet", u"\u5173\u95ed\u8bbe\u7f6e\u7a97\u53e3", None))
#endif // QT_CONFIG(tooltip)self.btnExit.setText(QCoreApplication.translate("PainterSet", u"x", None))self.btn_lineCol.setText(QCoreApplication.translate("PainterSet", u"\u753b\u7ebf\u989c\u8272", None))self.btnTxtFont.setText(QCoreApplication.translate("PainterSet", u"\u6587\u672c\u5b57\u4f53", None))self.label_2.setText(QCoreApplication.translate("PainterSet", u"\u7ebf\u5bbd\u5ea6\uff1a", None))self.btn_fillCol.setText(QCoreApplication.translate("PainterSet", u"\u586b\u5145\u989c\u8272", None))self.label_3.setText(QCoreApplication.translate("PainterSet", u"\u753b\u7ebf\u7c7b\u578b\uff1a", None))self.label_5.setText(QCoreApplication.translate("PainterSet", u"\u586b\u5145\u7c7b\u578b\uff1a", None))self.label_Show.setText(QCoreApplication.translate("PainterSet", u"Abc123", None))# retranslateUi
在画板设置的悬浮窗体上的一预览图形窗体模块paintSample.py代码如下
# -*- coding: utf-8 -*-
import sys,os,time,random,copy,math
from math import *
from PySide6 import *
from PySide6.QtWidgets import *
from PySide6.QtCore import *
from PySide6.QtCore import (Signal, QEvent,Property, QSize,Qt, QTimer,Slot,QPoint,QPointF,QRectF,QDateTime)
from PySide6.QtGui import  (QCursor, QFocusEvent,QIcon,QImage)
from PySide6.QtGui import (QPen,QBrush,QColor,QFont, QPainter,QPixmap,QGradient,QSurface, QWindow,QSurfaceFormat,QMovie,QAction)
from PySide6.QtWidgets import (QDialog,QWidget, QFileDialog, QMainWindow, QMessageBox)
from PySide6.QtWidgets import (QApplication, QLabel,QCheckBox, QComboBox, QDialog, QLineEdit,QMenu, QPushButton,QGridLayout,QHBoxLayout,QVBoxLayout,QGroupBox)from chartAttrib import *class paintSample(QLabel):"""用于显示当前设置的画笔,画刷、文本等属性,在标签的画布上画出效果"""def __init__(self,text=''):super(paintSample, self).__init__(text)        cursor = QCursor(Qt.CrossCursor)  #光标类型#定义当前绘画类型       0                 1              2          3      4             5self.paintSet=[QColor('black'),QColor('white'),QFont('宋体',9),1,Qt.SolidLine,Qt.SolidPattern]self.drawTxt='Abc123'self.setGeometry(QRect(70, 10, 81, 61))self.pix = QPixmap(79,59)    #实例化QPixmap类self.pix.fill(Qt.white)self.setPixmap(self.pix)     # 把pix_img传递给labelself.noPatter =  QPainter(self.pix).brush()  self.curBrushID=0  #当前选择的画刷在父窗体组合框中的ID号(ID=15-18时,需要对画刷单独处理)def setReDrawAttrib(self,lstSet):#定义当前绘画类型              0                 1              2          3      4             5self.paintSet=lstSet   #[QColor('black'),QColor('white'),QFont('宋体',9),1,Qt.SolidLine,Qt.SolidPattern]self.update()       #按当前设置属性刷新重画def setBackgroundColor(self, color):pal = self.palette()pal.setColor(self.backgroundRole(), QColor(color))self.setPalette(pal)#重载绘图函数:根据选择设置,画不同的图形  #0=非绘画模式   1=画线模式 2=画矩形模式 3=画填充矩形模式 4=画圆模式 5=画椭圆模式 6=随手画模式 7=画文本模式def paintEvent(self, event):self.pix.fill(Qt.white)    #清除全部图形重画pp = QPainter(self.pix)pen = gf_getPen(self.paintSet[0],self.paintSet[3],self.paintSet[4])     # 创建画笔对象pp.setPen(pen)                  #设置画笔brush = QBrush()                # 创建画刷对象brush.setColor(self.paintSet[1])curBrushID=self.paintSet[6]if(curBrushID>=15 and curBrushID<=18):  #这15-18号画刷是直接用=,不是用brush.setStylebrush=self.paintSet[5]else:brush.setStyle(self.paintSet[5])        pp.setBrush(brush)              #设置画刷pp.setFont(self.paintSet[2])    #设置字体#pp.setBrush(self.noPatter)     #画非填充矩形时:暂没找到透明画刷的得到方法,用的保存了一初始画刷没有加载颜色等时的值pp.drawRect(3,3,70,30)   pp.drawText(QRect(5,40,60,35),0,self.drawTxt) painter = QPainter(self)painter.drawPixmap(0, 0, self.pix)
painterSet.py窗体的UI设计代码: .\ui\PainterSet.ui, 此文件由pyside的窗体设计器来打开和编辑
<?xml version="1.0" encoding="UTF-8"?>
<ui version="4.0"><class>PainterSet</class><widget class="QWidget" name="PainterSet"><property name="windowModality"><enum>Qt::WindowModality::NonModal</enum></property><property name="geometry"><rect><x>0</x><y>0</y><width>165</width><height>130</height></rect></property><property name="contextMenuPolicy"><enum>Qt::ContextMenuPolicy::NoContextMenu</enum></property><property name="windowTitle"><string>画板设置</string></property><widget class="QPushButton" name="btnExit"><property name="geometry"><rect><x>150</x><y>0</y><width>16</width><height>16</height></rect></property><property name="font"><font><family>Arial</family><bold>true</bold></font></property><property name="cursor"><cursorShape>PointingHandCursor</cursorShape></property><property name="toolTip"><string>关闭设置窗口</string></property><property name="text"><string>x</string></property></widget><widget class="QPushButton" name="btn_lineCol"><property name="geometry"><rect><x>10</x><y>10</y><width>52</width><height>20</height></rect></property><property name="font"><font><family>仿宋</family><pointsize>8</pointsize></font></property><property name="cursor"><cursorShape>PointingHandCursor</cursorShape></property><property name="text"><string>画线颜色</string></property></widget><widget class="QPushButton" name="btnTxtFont"><property name="geometry"><rect><x>10</x><y>50</y><width>52</width><height>21</height></rect></property><property name="font"><font><family>仿宋</family><pointsize>8</pointsize></font></property><property name="cursor"><cursorShape>PointingHandCursor</cursorShape></property><property name="text"><string>文本字体</string></property></widget><widget class="QLabel" name="label_2"><property name="geometry"><rect><x>10</x><y>70</y><width>58</width><height>21</height></rect></property><property name="font"><font><family>仿宋</family><pointsize>8</pointsize></font></property><property name="frameShape"><enum>QFrame::Shape::NoFrame</enum></property><property name="frameShadow"><enum>QFrame::Shadow::Plain</enum></property><property name="text"><string>线宽度:</string></property></widget><widget class="QPushButton" name="btn_fillCol"><property name="geometry"><rect><x>10</x><y>30</y><width>52</width><height>20</height></rect></property><property name="font"><font><family>仿宋</family><pointsize>8</pointsize></font></property><property name="cursor"><cursorShape>PointingHandCursor</cursorShape></property><property name="text"><string>填充颜色</string></property></widget><widget class="QLabel" name="label_3"><property name="geometry"><rect><x>10</x><y>90</y><width>58</width><height>16</height></rect></property><property name="font"><font><family>仿宋</family><pointsize>8</pointsize></font></property><property name="text"><string>画线类型:</string></property></widget><widget class="QLabel" name="label_5"><property name="geometry"><rect><x>10</x><y>110</y><width>58</width><height>16</height></rect></property><property name="font"><font><family>仿宋</family><pointsize>8</pointsize></font></property><property name="text"><string>填充类型:</string></property></widget><widget class="QSpinBox" name="spin_lineWidth"><property name="geometry"><rect><x>70</x><y>70</y><width>79</width><height>16</height></rect></property><property name="font"><font><family>仿宋</family><pointsize>8</pointsize></font></property><property name="minimum"><number>1</number></property><property name="maximum"><number>200</number></property></widget><widget class="QComboBox" name="combo_lineType"><property name="geometry"><rect><x>70</x><y>90</y><width>79</width><height>16</height></rect></property><property name="font"><font><family>仿宋</family><pointsize>8</pointsize></font></property></widget><widget class="QComboBox" name="combo_fillType"><property name="geometry"><rect><x>70</x><y>110</y><width>79</width><height>16</height></rect></property><property name="font"><font><family>仿宋</family><pointsize>8</pointsize></font></property></widget><widget class="paintSample" name="label_Show"><property name="geometry"><rect><x>70</x><y>10</y><width>81</width><height>61</height></rect></property><property name="frameShape"><enum>QFrame::Shape::Box</enum></property><property name="frameShadow"><enum>QFrame::Shadow::Raised</enum></property><property name="text"><string>Abc123</string></property><property name="alignment"><set>Qt::AlignmentFlag::AlignBottom|Qt::AlignmentFlag::AlignHCenter</set></property></widget></widget><customwidgets><customwidget><class>paintSample</class><extends>QLabel</extends><header>paintsample.py</header></customwidget></customwidgets><resources/><connections/>
</ui>
本示例代码用到的画板图形填充图案fill.png