echarts 实现柱状图自动滚动展示数据(Vue3)
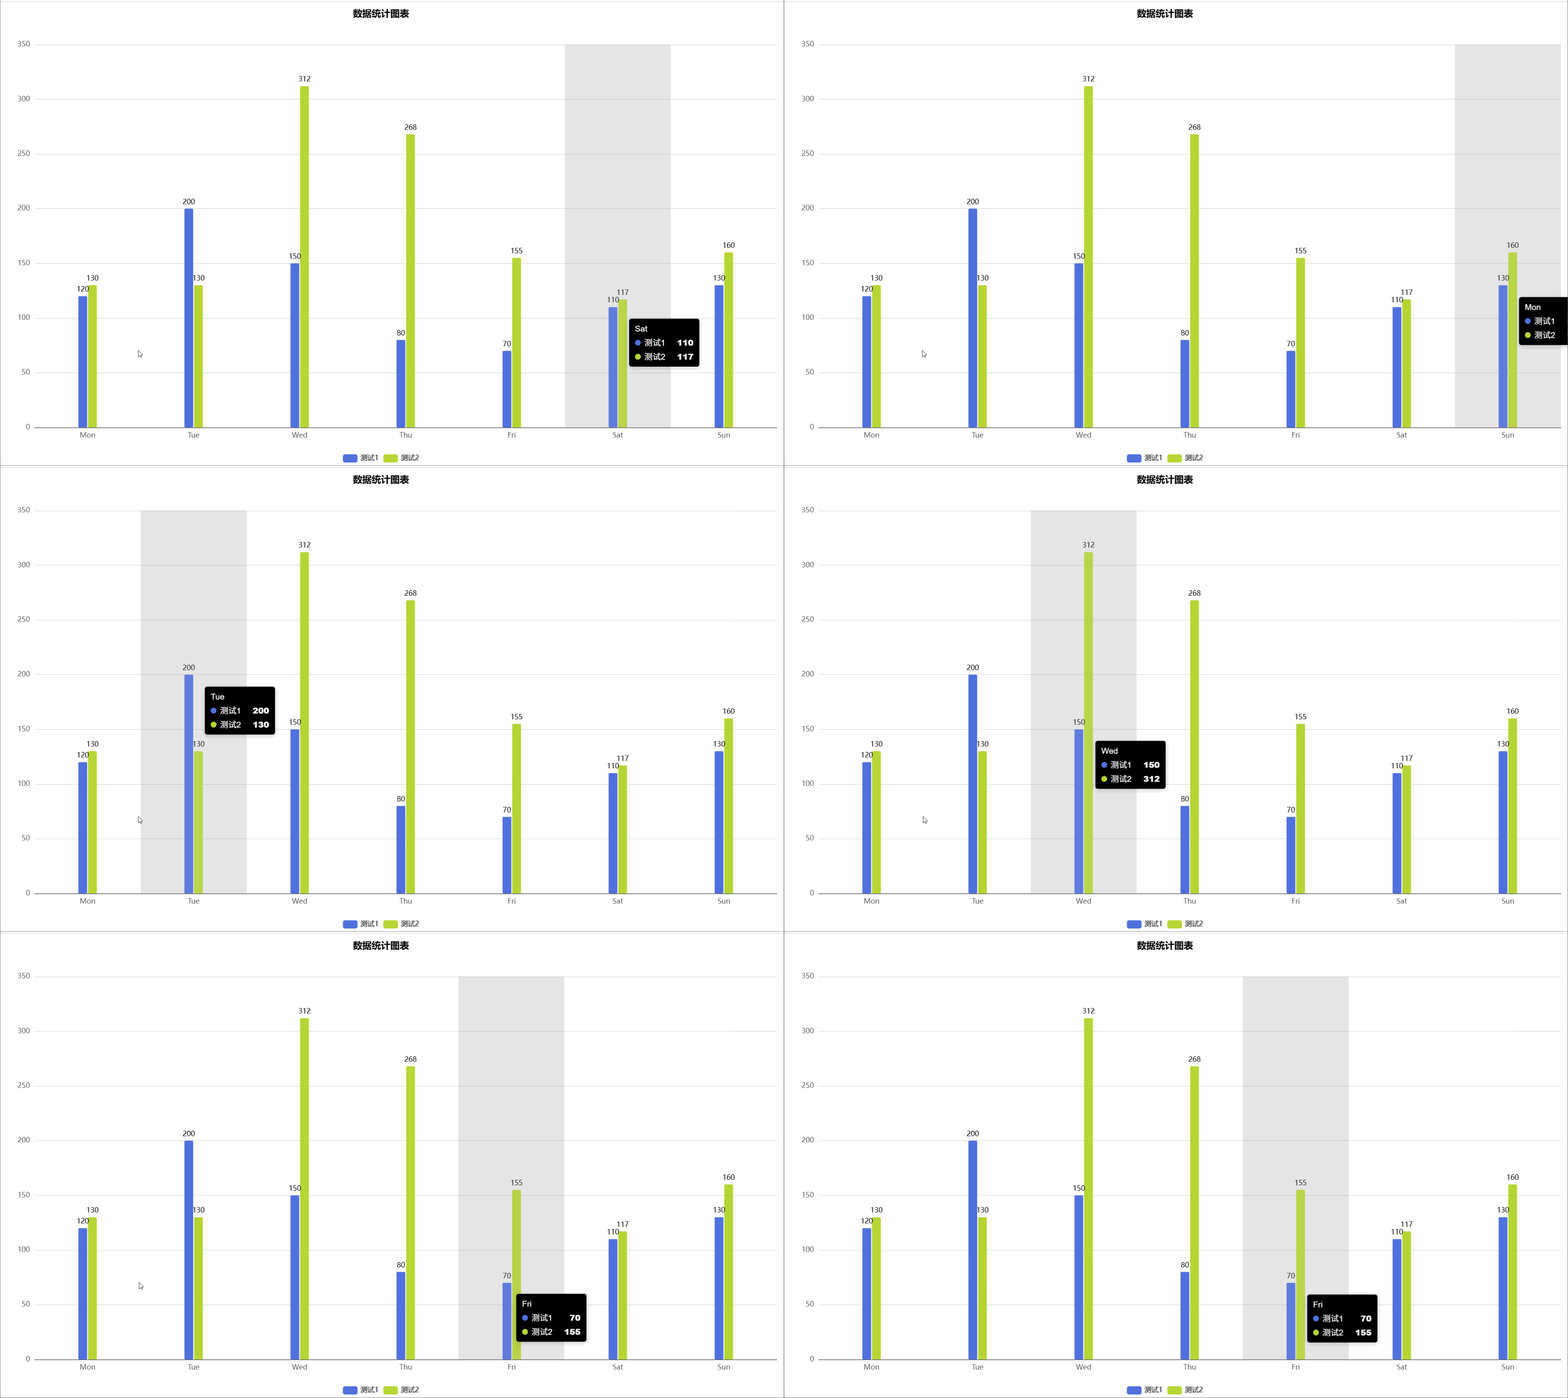
效果图:

需求:
- 自动滚动展示数据:当数据量较大时,自动滚动显示不同的数据区间
- 循环播放:当滚动到末尾时,重新从头开始播放
- 鼠标交互控制:鼠标悬停时暂停动画,移开后继续播放
<template><div @mouseover="mouseover" @mouseout="mouseout"><v-chartref="vChartRef":option="option"style="width: 100%; height: 800px"/></div>
</template>
<script setup lang="ts">
import { ref, reactive, onMounted, onBeforeUnmount, watch } from "vue";
import VChart from "vue-echarts";
import { use } from "echarts/core";
import { CanvasRenderer } from "echarts/renderers";
import { BarChart } from "echarts/charts";
import {DatasetComponent,GridComponent,TooltipComponent,LegendComponent,TitleComponent,
} from "echarts/components";use([DatasetComponent,CanvasRenderer,BarChart,GridComponent,TooltipComponent,LegendComponent,TitleComponent,
]);// 定义数据类型
interface ChartDataItem {x: string;y: number;s: string;
}// 模拟接口数据数组
const chartData = ref<ChartDataItem[]>([{ x: "Mon", y: 120, s: "测试1" },{ x: "Tue", y: 200, s: "测试1" },{ x: "Wed", y: 150, s: "测试1" },{ x: "Thu", y: 80, s: "测试1" },{ x: "Fri", y: 70, s: "测试1" },{ x: "Sat", y: 110, s: "测试1" },{ x: "Sun", y: 130, s: "测试1" },{ x: "Mon", y: 130, s: "测试2" },{ x: "Tue", y: 130, s: "测试2" },{ x: "Wed", y: 312, s: "测试2" },{ x: "Thu", y: 268, s: "测试2" },{ x: "Fri", y: 155, s: "测试2" },{ x: "Sat", y: 117, s: "测试2" },{ x: "Sun", y: 160, s: "测试2" },
]);// 获取图表实例
const vChartRef = ref();// 获取series
const seriesItem = ref({type: "bar",barWidth: 15,name: "",label: {show: true,position: "top",color: "#000",fontSize: 12,},itemStyle: {borderRadius: 2,color: null,},data: [],
});const getSeries = () => {const seriesNames = [...new Set(chartData.value.map((item) => item.s))];const xValues = [...new Set(chartData.value.map((item) => item.x))];const series = seriesNames.map((name) => {const seriesItemCopy = JSON.parse(JSON.stringify(seriesItem.value));seriesItemCopy.name = name;const seriesData = new Array(xValues.length).fill(null);chartData.value.forEach((item) => {if (item.s === name) {const index = xValues.indexOf(item.x);if (index !== -1) {seriesData[index] = item.y;}}});seriesItemCopy.data = seriesData;return seriesItemCopy;});return { series, xValues };
};const option = reactive({tooltip: {trigger: "axis",backgroundColor: "#000",borderWidth: 0,padding: 10,axisPointer: {type: "shadow",},textStyle: {//浮框文本样式color: "#fff",fontFamily: "Arial",fontSize: 14,},},title: {show: true,text: "数据统计图表",subtext: "",left: "center",top: "0",right: "0",bottom: "0",textStyle: {color: "#000",fontSize: 16,},subtextStyle: {color: "#eee",fontSize: 14,},},legend: {show: true,textStyle: {color: "#000",},},xAxis: [{type: "category",data: <any>[],},],yAxis: [{type: "value",},],series: <any>[],
});onMounted(() => {const { series, xValues } = getSeries();option.series = series;option.xAxis[0].data = xValues;setAnimate();
});watch(() => option.series,() => {setShowTips();}
);const isShowTips = ref(true);
const timer: any = ref(null);
let seriesDataNum = 0;
const setShowTips = () => {if (!isShowTips.value && isShowTips.value !== undefined) {clearInterval(timer.value);return;}clearInterval(timer.value);timer.value = setInterval(() => {let series = option.series;let length = series[0].data.length;vChartRef.value?.dispatchAction({type: "showTip",seriesIndex: 0,dataIndex: seriesDataNum,});seriesDataNum = seriesDataNum >= length - 1 ? 0 : seriesDataNum + 1;}, 2000);
};const mouseover = () => {if (timer.value) clearInterval(timer.value);if (timechartes.value) clearInterval(timechartes.value);
};const mouseout = () => {setShowTips();setAnimate();
};onBeforeUnmount(() => {if (timer.value) clearInterval(timer.value);if (timechartes.value) clearInterval(timechartes.value);
});
const timechartes: any = ref(null);
let dataZoom = ref([{xAxisIndex: 0, //这里是从X轴的0刻度开始show: false, //是否显示滑动条,不影响使用type: "inside", // 这个 dataZoom 组件是 slider 型 dataZoom 组件startValue: 0, // 从头开始。endValue: 8, // 一次性展示几个。},
]);
const setAnimate = () => {if (timechartes.value) clearInterval(timechartes.value);timechartes.value = setInterval(() => {const xValuesLength = [...new Set(chartData.value.map((item) => item.x))].length;// 每次向后滚动一个,最后一个从头开始。if (dataZoom.value[0].endValue === xValuesLength) {dataZoom.value[0].endValue = 8;dataZoom.value[0].startValue = 0;} else {dataZoom.value[0].endValue += 1;dataZoom.value[0].startValue += 1;}}, 2000);
};
</script>
