智数园区-前台
一、基础
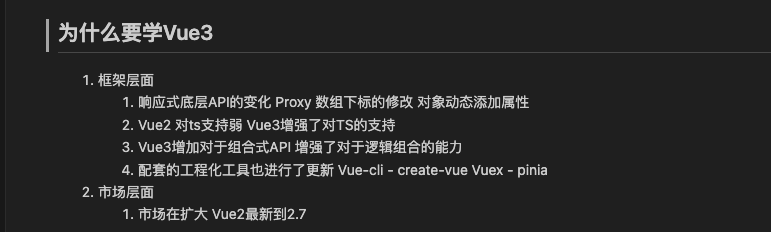
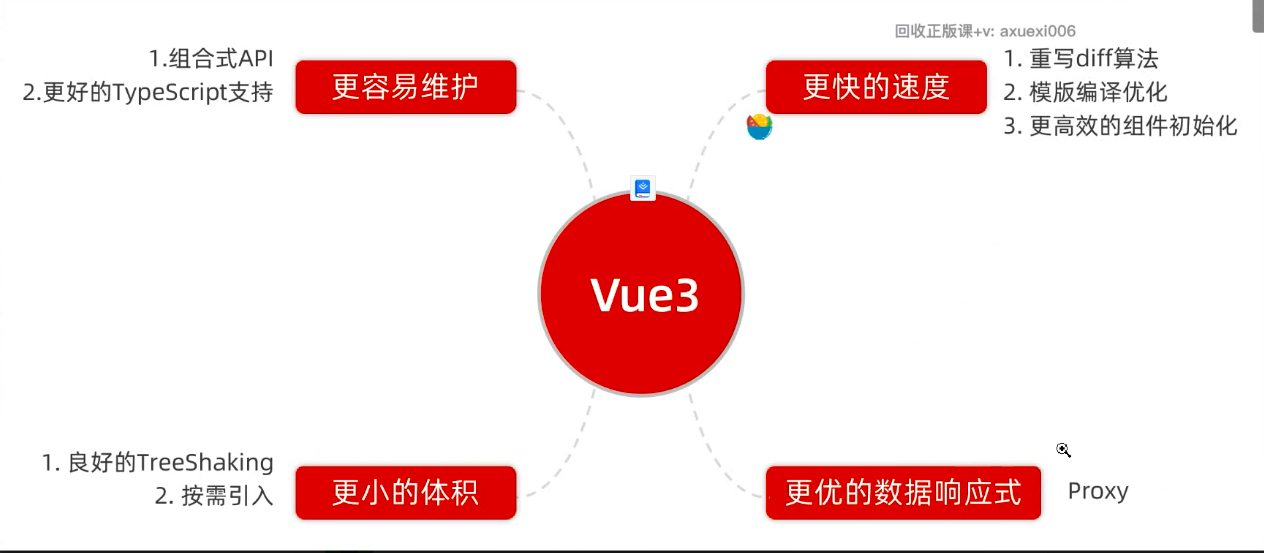
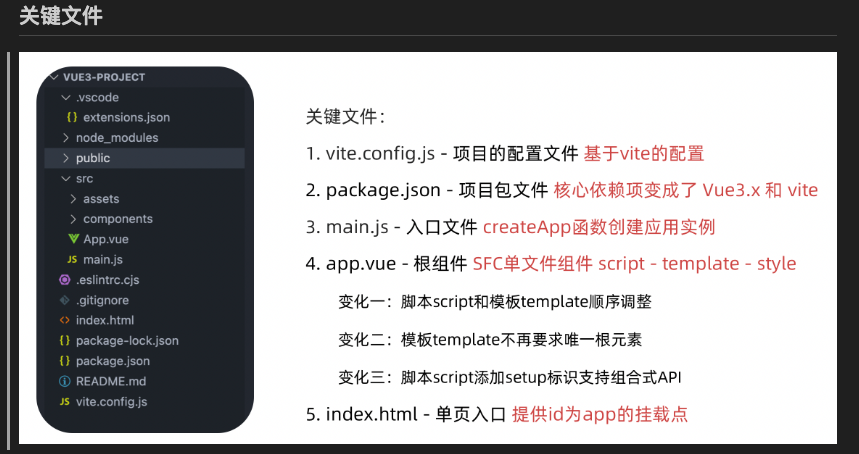
1. vue3的优势
npm init vue@lates
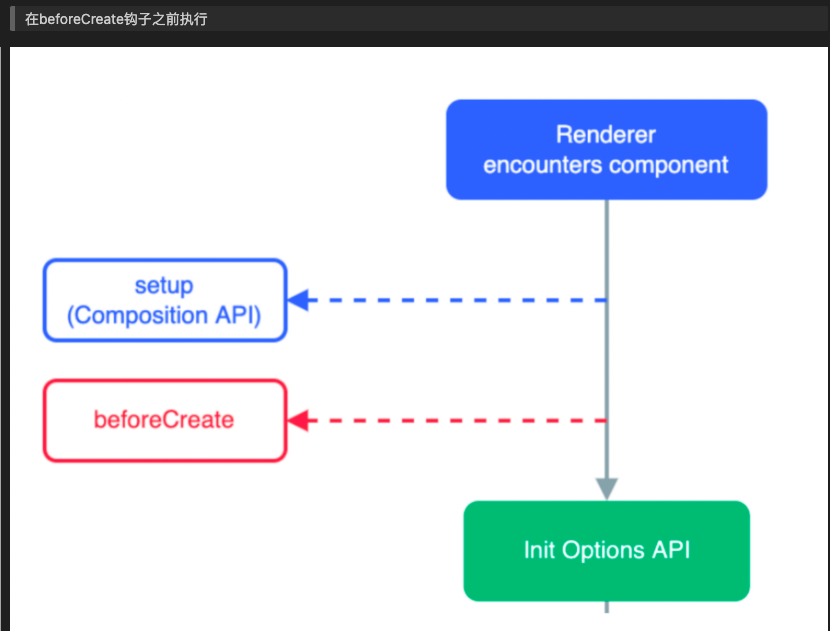
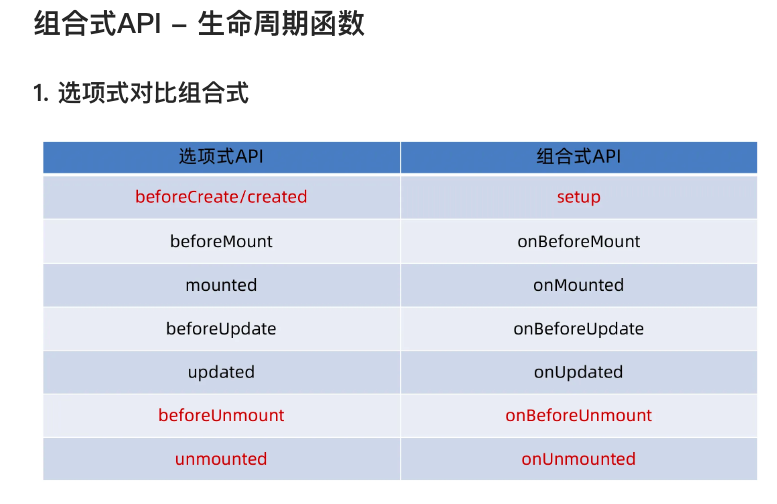
setup的执行时机,在beforeCreated钩子之前执行
2. 语法
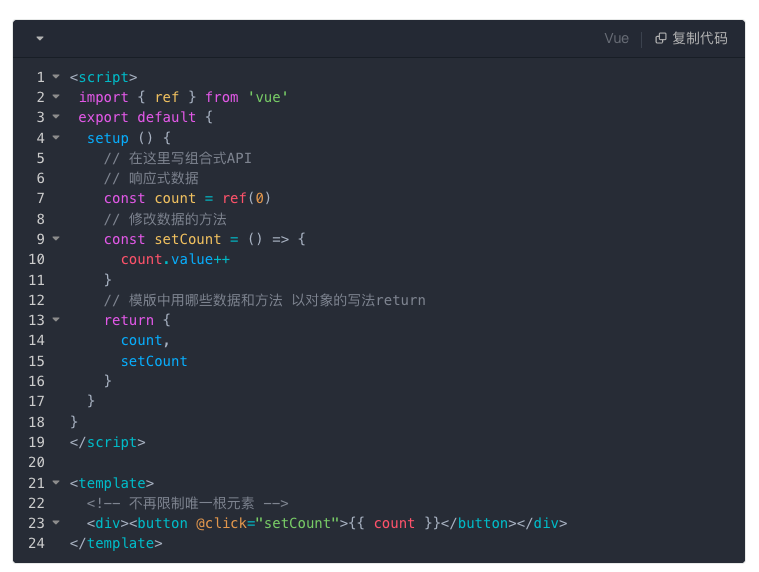
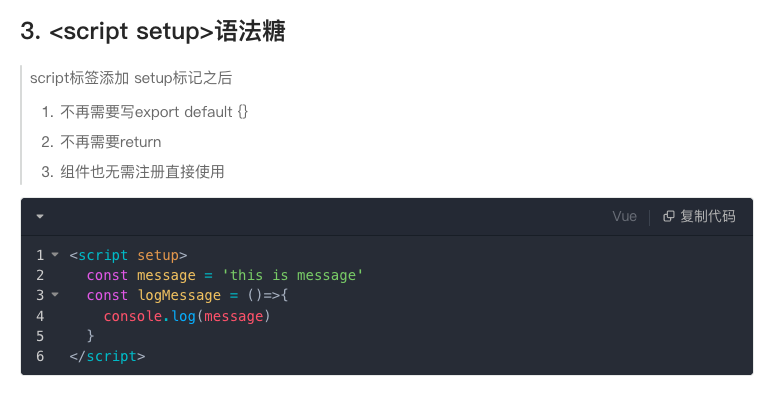
1. setup
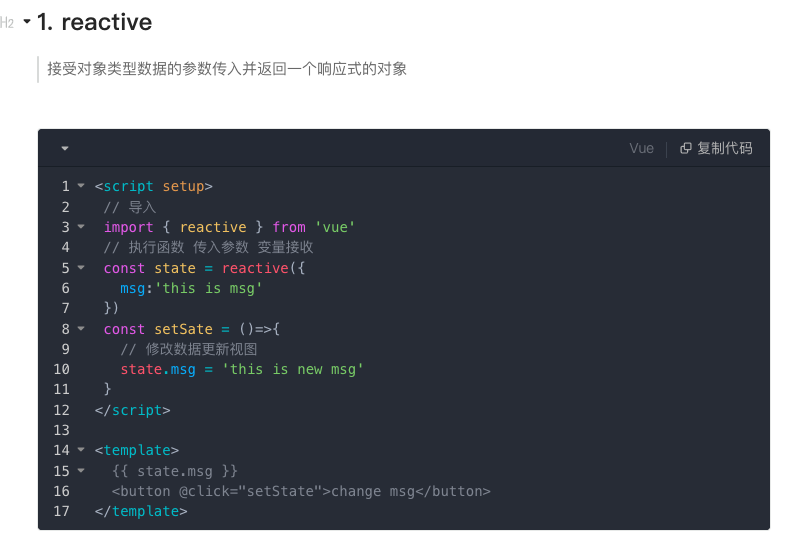
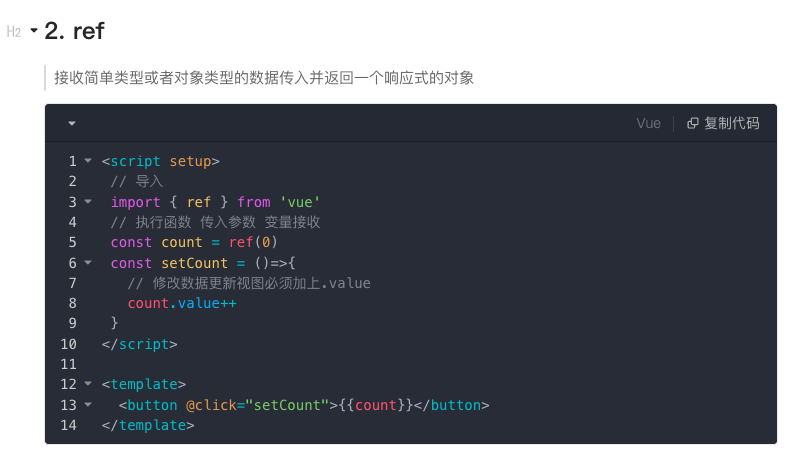
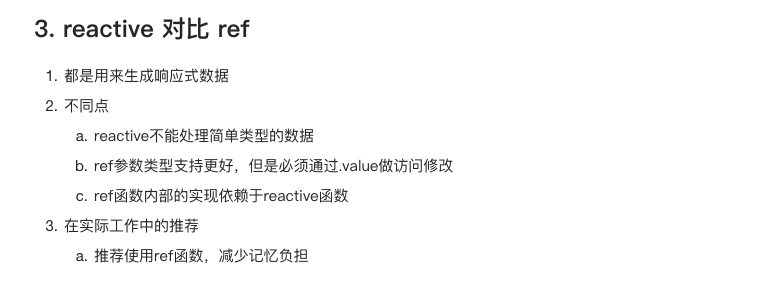
2. reactive和ref
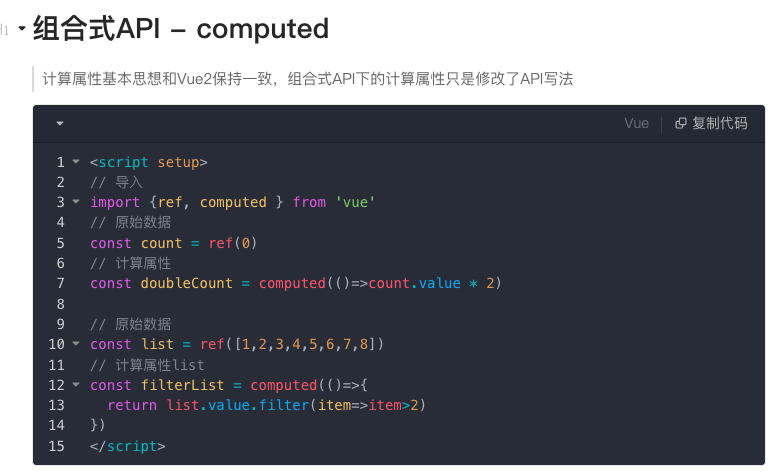
3. computed
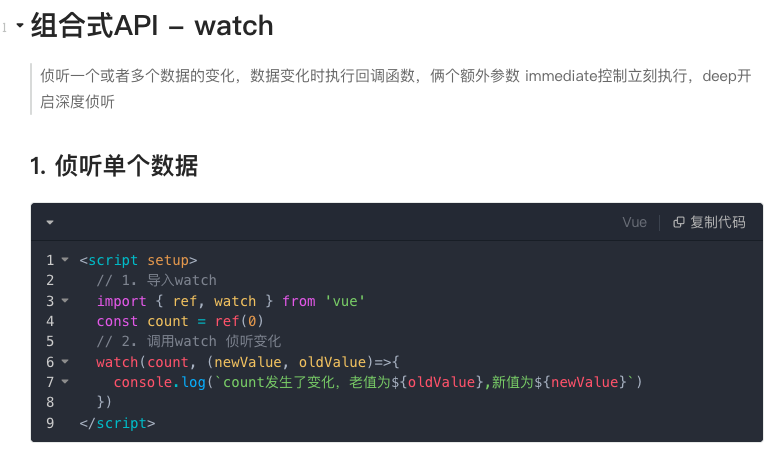
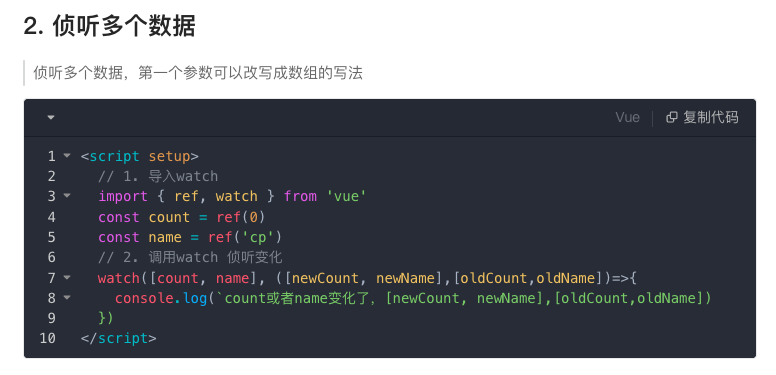
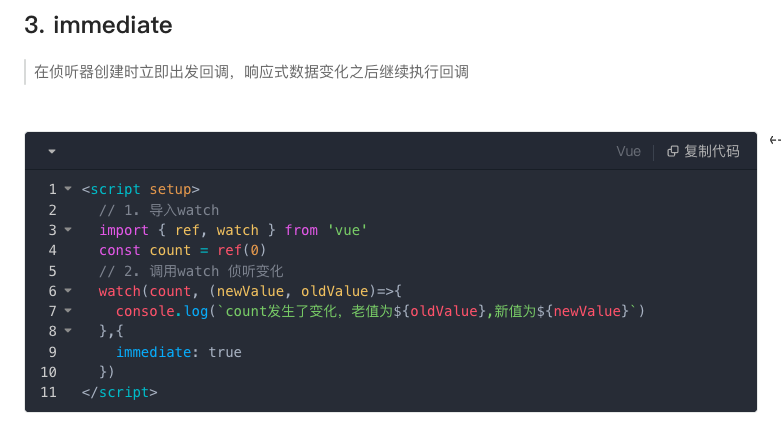
4. watch
通过watch监听的ref对象默认是浅层侦听的,直接修改嵌套的对象属性不会触发回调执行,需要开启deep
<script setup>// 1. 导入watchimport { ref, watch } from 'vue'const state = ref({ count: 0 })// 2. 监听对象statewatch(state, ()=>{console.log('数据变化了')})const changeStateByCount = ()=>{// 直接修改不会引发回调执行state.value.count++}
</script><script setup>// 1. 导入watchimport { ref, watch } from 'vue'const state = ref({ count: 0 })// 2. 监听对象state 并开启deepwatch(state, ()=>{console.log('数据变化了')},{deep:true})const changeStateByCount = ()=>{// 此时修改可以触发回调state.value.count++}
</script>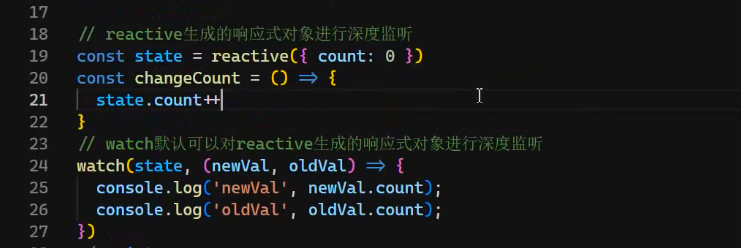
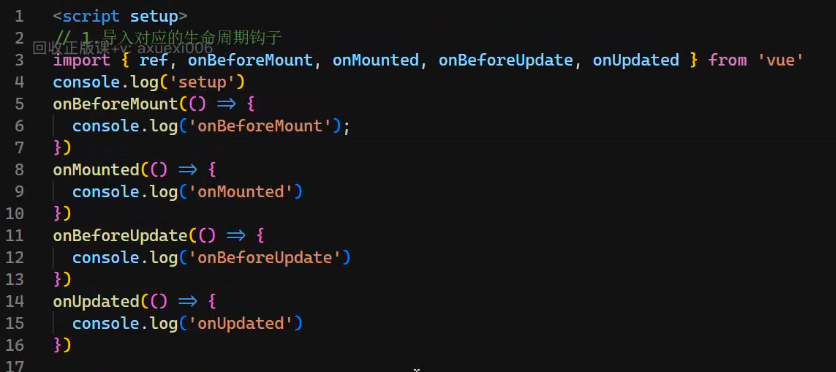
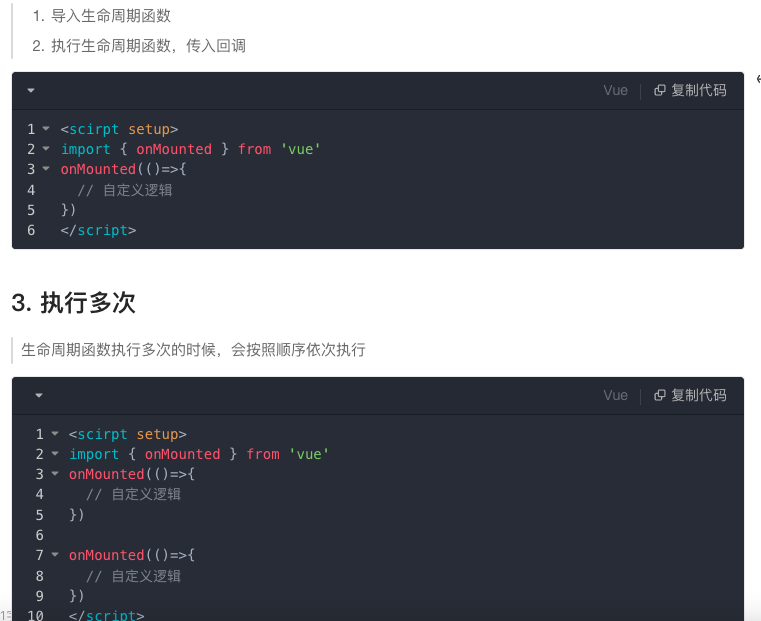
5. 生命周期
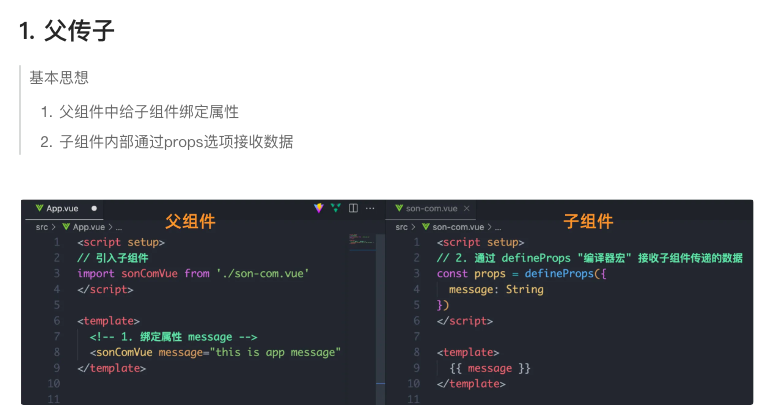
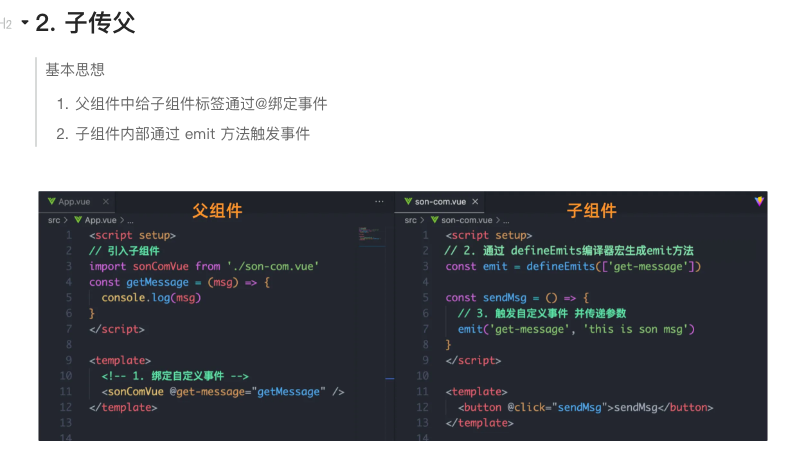
6. 父子组件通信
如果在js中使用父组件传过来的变量,直接props.message
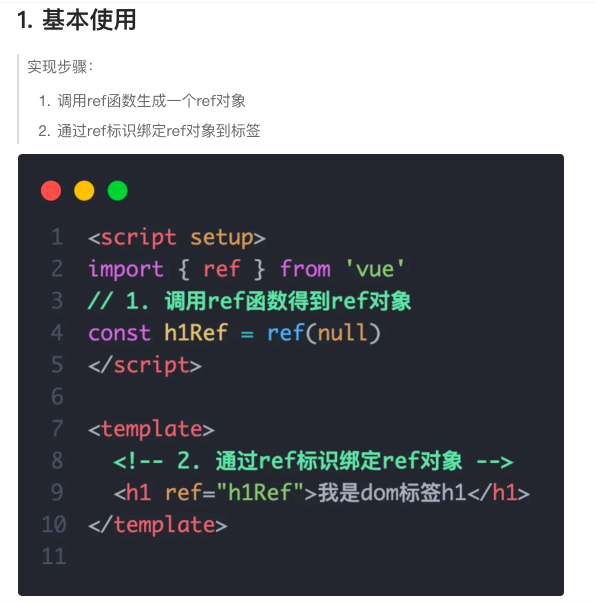
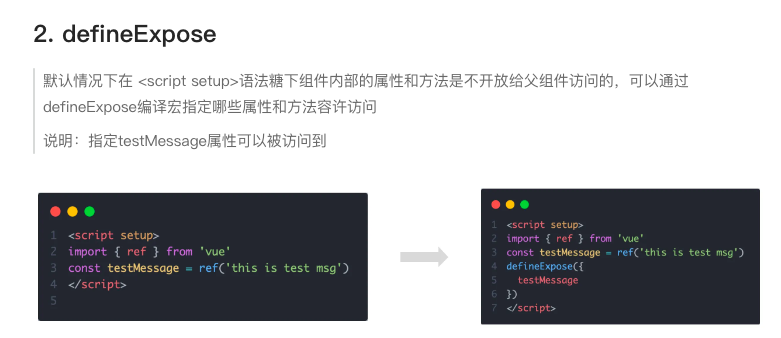
7. ref模板引用
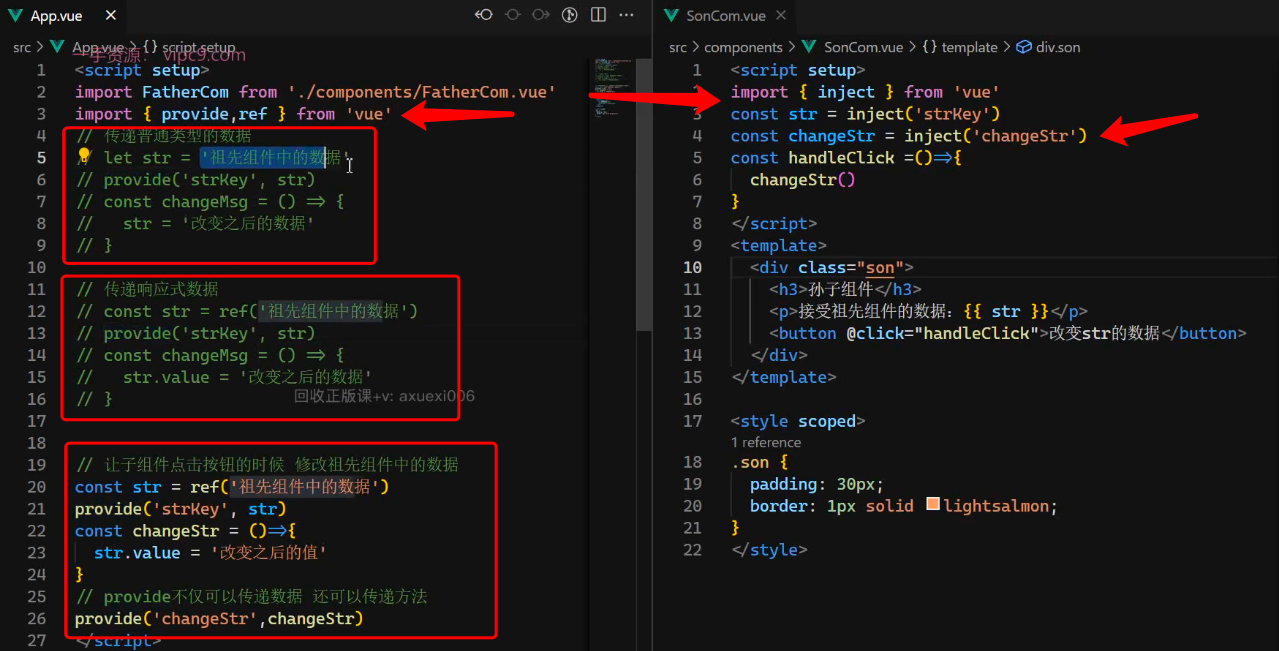
8. 组件通信之provide&inject
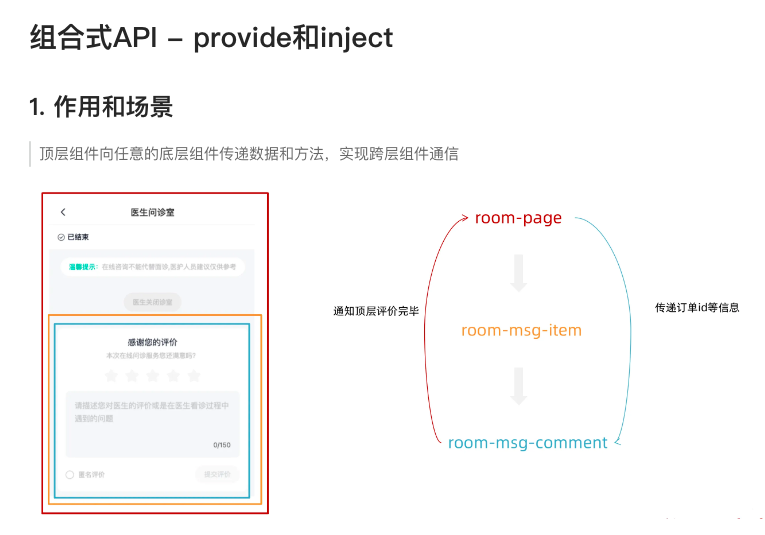
传递普通数据不是响应式的,传递ref包裹的数据是响应式的;
还可以给孙组件传递方法
二、可视化项目
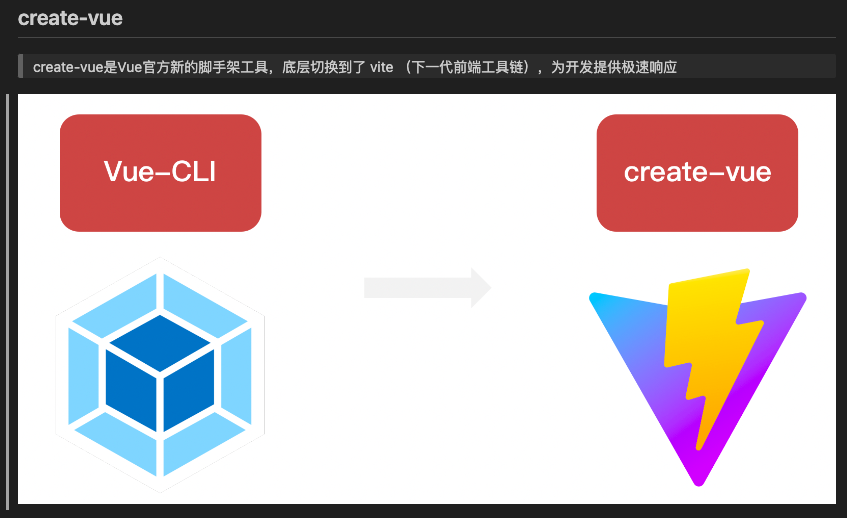
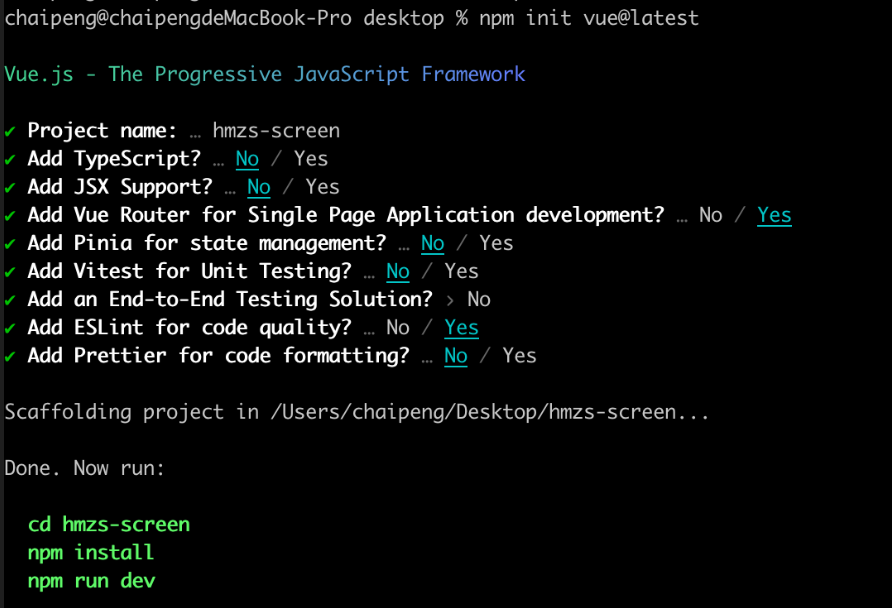
1. 使用create-vue初始化项目
npm init vue@latest
准备utils模块
业务背景:大屏项目属于后台项目的一个子项目,用户的token是共享的,所以大屏项目以同样的方式去cookie中获取token
封装cookies存取模块
npm i js-cookie
import Cookies from 'js-cookie'const KEY = 'token_key'export function getCookie () {return Cookies.get(KEY)
}export function setCookie (value) {Cookies.set(KEY, value)
}export function removeCookie () {Cookies.remove(KEY)
}
封装request请求模块
npm i axios
import axios from 'axios'
import { getCookie } from './cookie'
const service = axios.create({baseURL: 'https://api-hmzs.itheima.net/v1',timeout: 5000 // request timeout
})// 请求拦截器
service.interceptors.request.use(config => {const token = getCookie()if (token) {config.headers.Authorization = token}return config},error => {return Promise.reject(error)}
)// 响应拦截器
service.interceptors.response.use(response => {return response.data},error => {return Promise.reject(error)}
)export default service
路由搭建
创建路由组件
<script setup></script><template><div>我是大屏显示组件</div>
</template>
绑定路由
// createRouter: 创建路由实例对象
// createWebHistory: 创建history模式的路由(hash / history)import { createRouter, createWebHistory } from 'vue-router'// 导入路由级别的组件
import HomeView from '../views/HomeView.vue'
import BigScreenView from '../views/BigScreenView.vue'const router = createRouter({// 类似于mode:history 指定路由为history模式history: createWebHistory(import.meta.env.BASE_URL),// 配置路由path和component对应关系routes: [{path: '/',redirect: '/big-screen',name: 'home',component: HomeView,},{path: '/big-screen',name: 'big-screen',component: BigScreenView}]
})export default router
初始化样式
准备初始化文件
html,
body,
#app {height: 100vh;overflow: hidden;
}* {margin: 0;padding: 0;box-sizing: border-box;
}
安装sass
create-vue创建的项目默认不支持scss语法,需要我们手动安装sass
npm i sass
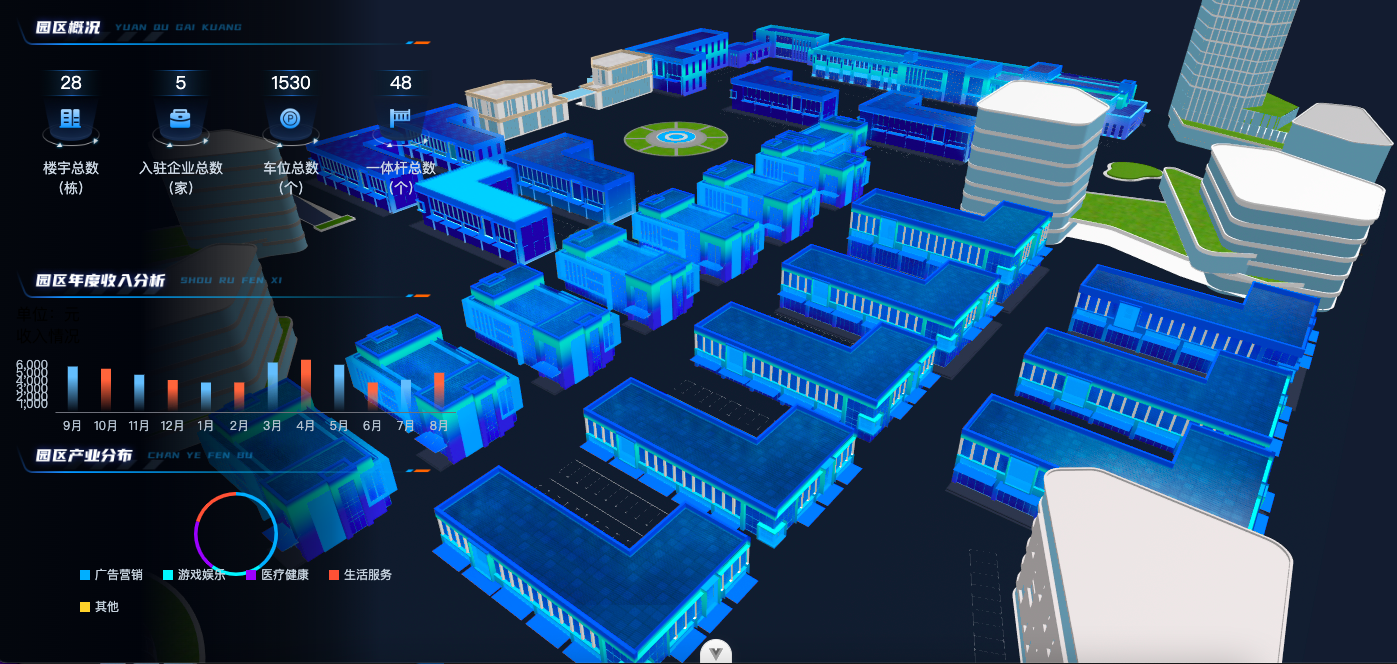
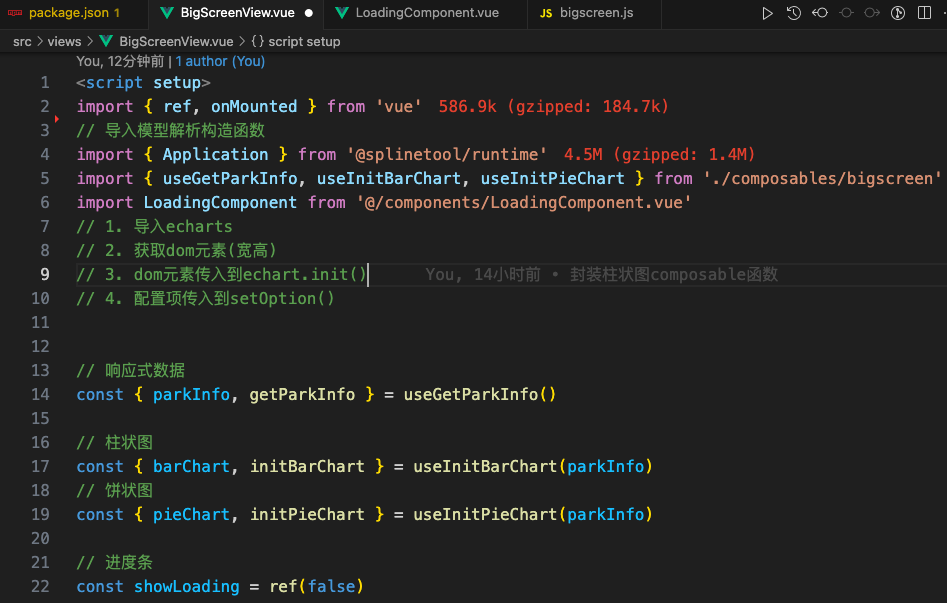
2.2d图表
composables/bigscreen.js
import { ref } from 'vue'
import { getParkInfoAPI } from '@/api/park'
import * as echarts from 'echarts'// 封装获取数据的的组合式函数
// 方法名以use开头
export function useGetParkInfo() {// 声明响应式数据const parkInfo = ref({})// 获取园区信息const getParkInfo = async () => {const res = await getParkInfoAPI()parkInfo.value = res.dataconsole.log('园区信息', res)}return { parkInfo, getParkInfo }
}export function useInitBarChart(parkInfo) {// 1. 导入echarts// 2. 获取dom元素(宽高)const barChart = ref(null)const initBarChart = () => {const { parkIncome } = parkInfo.value// 配置项const option = {tooltip: {trigger: 'axis',axisPointer: {type: 'shadow',},},grid: {// 让图表占满容器top: '10px',left: '0px',right: '0px',bottom: '0px',containLabel: true,},xAxis: [{type: 'category',axisTick: {alignWithLabel: true,show: false,},data: parkIncome.xMonth, // ["9月", "10月", "11月", "12月", "1月", "2月", "3月", "4月", "5月", "6月", "7月", "8月"]},],yAxis: [{type: 'value',splitLine: {show: false,},},],series: [// yIncome [6050, 3908.34, 6650, 6208.34, 3750, 3750, 5265, 4110, 4508.34, 3950, 6368.34, 3750]{name: '园区年度收入',type: 'bar',barWidth: '10px',data: parkIncome.yIncome.map((item, index) => {const color =index % 2 === 0? new echarts.graphic.LinearGradient(0, 0, 0, 1, [{ offset: 0.23, color: '#74c0f8' },{ offset: 1, color: 'rgba(116,192,248,0.00)' },]): new echarts.graphic.LinearGradient(0, 0, 0, 1, [{ offset: 0.23, color: '#ff7152' },{ offset: 1, color: 'rgba(255,113,82,0.00)' },])return { value: item, itemStyle: { color } }}),},],textStyle: {color: '#B4C0CC',},}// 3. dom元素传入到echart.init()const myChart = echarts.init(barChart.value)// 4. 配置项传入到setOption()myChart.setOption(option)}return {barChart,initBarChart}
}export function useInitPieChart(parkInfo) {// 渲染饼状图const pieChart = ref(null)const initPieChart = () => {const { parkIndustry } = parkInfo.valueconst pieOption = {color: ['#00B2FF', '#2CF2FF', '#892CFF', '#FF624D', '#FFCF54', '#86ECA2'],legend: {itemGap: 20,bottom: '0',icon: 'rect',itemHeight: 10, // 图例icon高度itemWidth: 10, // 图例icon宽度textStyle: {color: '#c6d1db',},},tooltip: {trigger: 'item'},series: [{name: '园区产业分析',type: 'pie',radius: ['55%', '60%'], // 设置内圈与外圈的半径使其呈现为环形center: ['50%', '40%'], // 圆心位置, 用于调整整个图的位置tooltip: {trigger: 'item',formatter: (params) => {return `${params.seriesName}</br><div style='display:flex;justify-content: space-between;'><div>${params.marker}${params.name}</div><div>${params.percent}%</div></div>`}},label: {show: false,position: 'center',},data: parkIndustry,},],}const myChart = echarts.init(pieChart.value)myChart.setOption(pieOption)}return {pieChart,initPieChart,}
}
使用composable函数
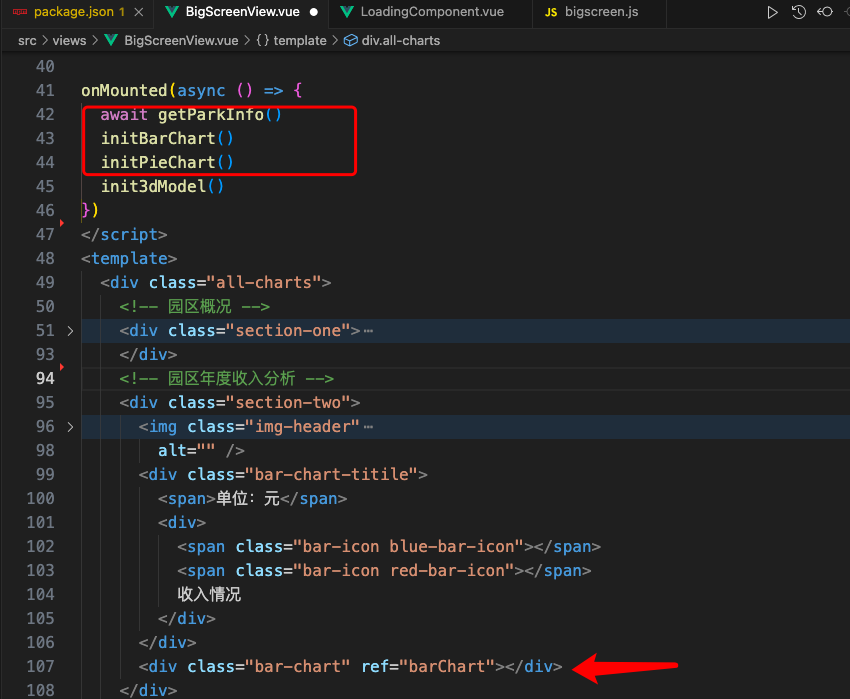
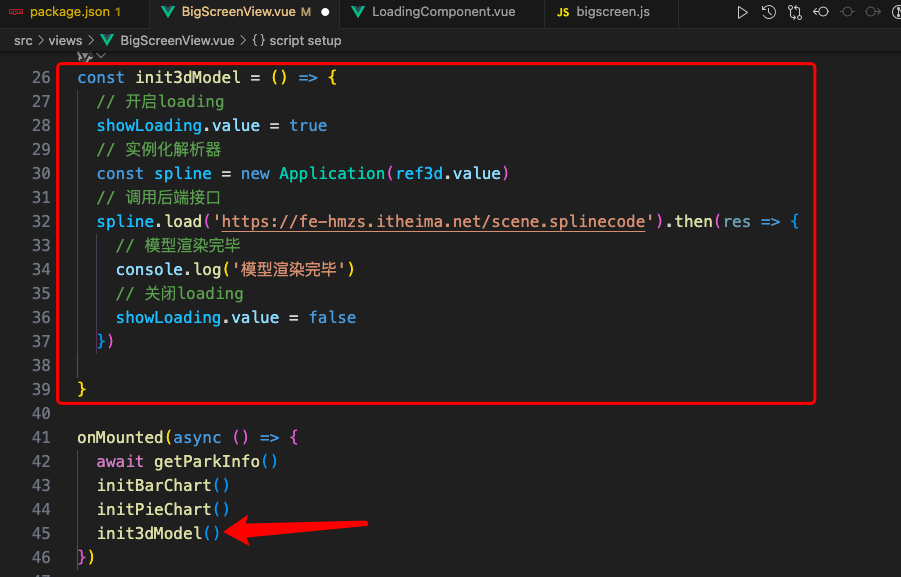
3. 3d渲染
1. 渲染
下载模型解析包
说明:模型解析包和制作3D的软件是配套的
npm i @splinetool/runtime
说明:spline实例既可以拉取模型同时拉取完毕之后会在canvas节点上渲染画布
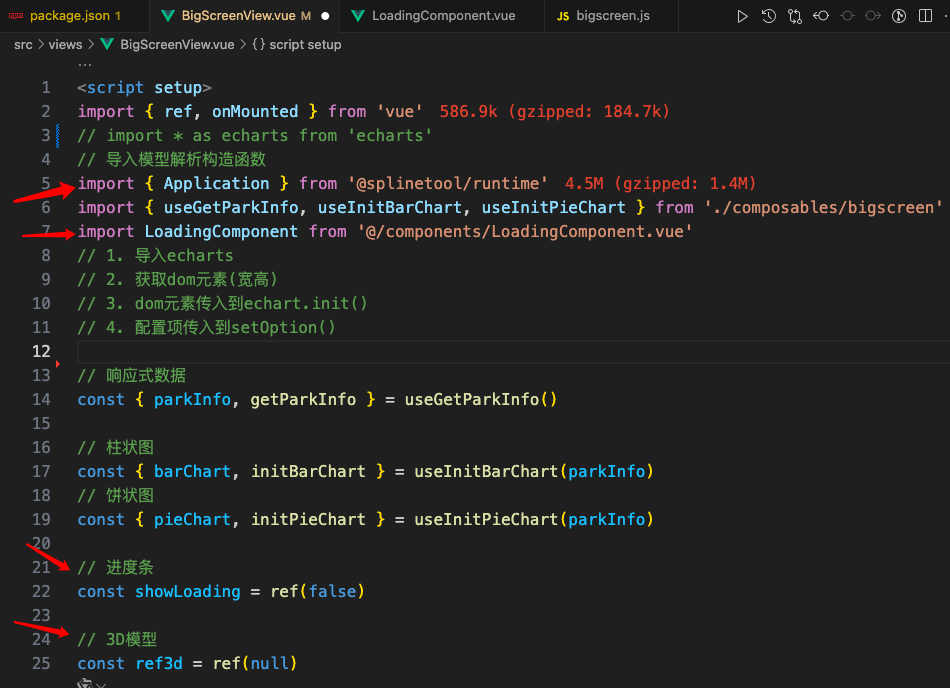
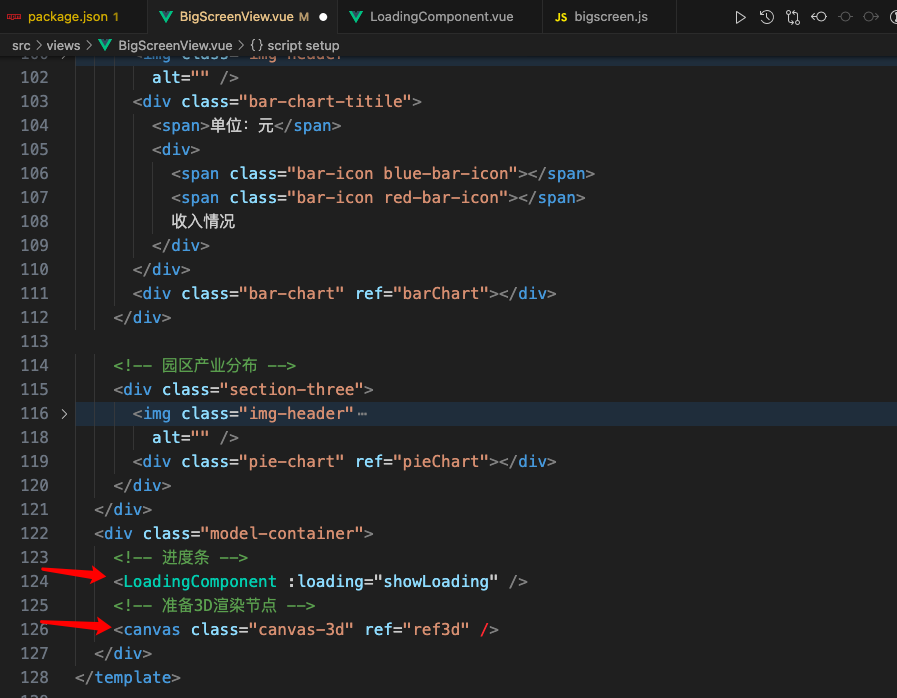
LoadingComponents
<script setup>
defineProps({loading: {type: Boolean,default: false}
})
</script><template><div v-if="loading" class="loading"><p class="text">园区资源加载中…</p><div class="loading-process"><div class="process-wrapper"></div></div></div>
</template><style lang="scss">
.loading {position: absolute;left: 66%;top: 40%;transform: translateX(-50%);text-align: center;.text {font-size: 14px;color: #909399;margin-bottom: 16px;}.loading-process {width: 280px;height: 4px;background: rgba(255, 255, 255, 0.16);border-radius: 20px;overflow: hidden;}.process-wrapper {height: 100%;width: 5%;background: linear-gradient(90deg, #48ffff 0%, #3656ff 100%);animation-duration: 1000s;animation-name: loading;}@keyframes loading {0% {transform: scaleX(1);}1% {transform: scaleX(38);}100% {transform: scaleX(40);}}
}
</style>
2. 大屏适配
适配方案说明
需求: 适配几个固定的设备 要求在一个主屏上完美适配最贴合 UI 设计稿,其它少量的设备上,保证正常的浏览显示没有问题
缩放方案:接入难度非常小 效果中上
GitHub - Alfred-Skyblue/v-scale-screen: Vue large screen adaptive component vue 大屏自适应组件
安装组件
npm i v-scale-screen
使用组件并制定宽高
注:以 1920 * 1080 为标准尺寸比
<v-scale-screen width="1920" height="1080">主体内容盒子
</v-scale-screen>
4. 接入微前端
1. 主应用改造
智数园区-后台管理系统为主应用
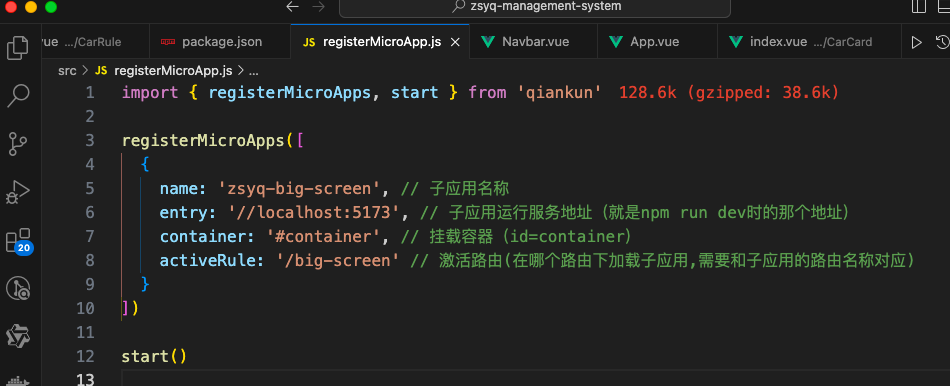
安装qiankun框架:npm i qiankun
这里的子应用名称要和子应用vite.config.js中写的保持一致
registerMicroApp.js
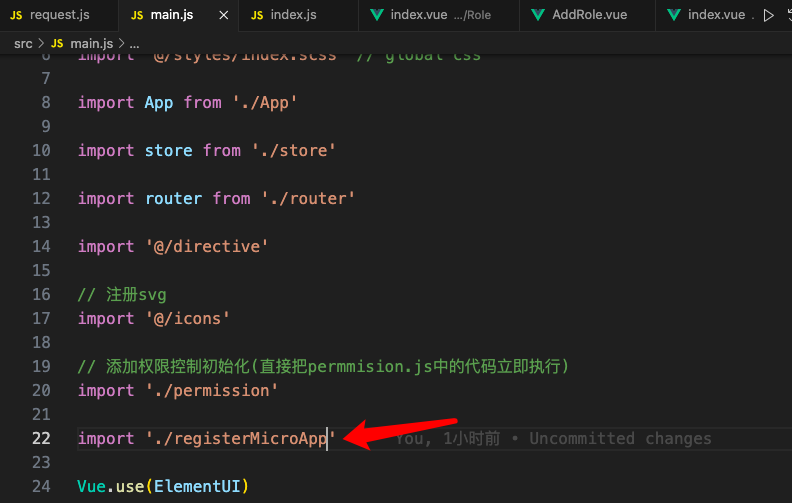
main.js中引入
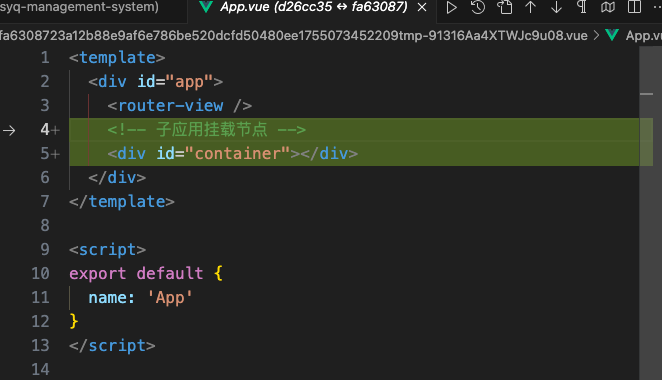
app.vue中增加挂载节点
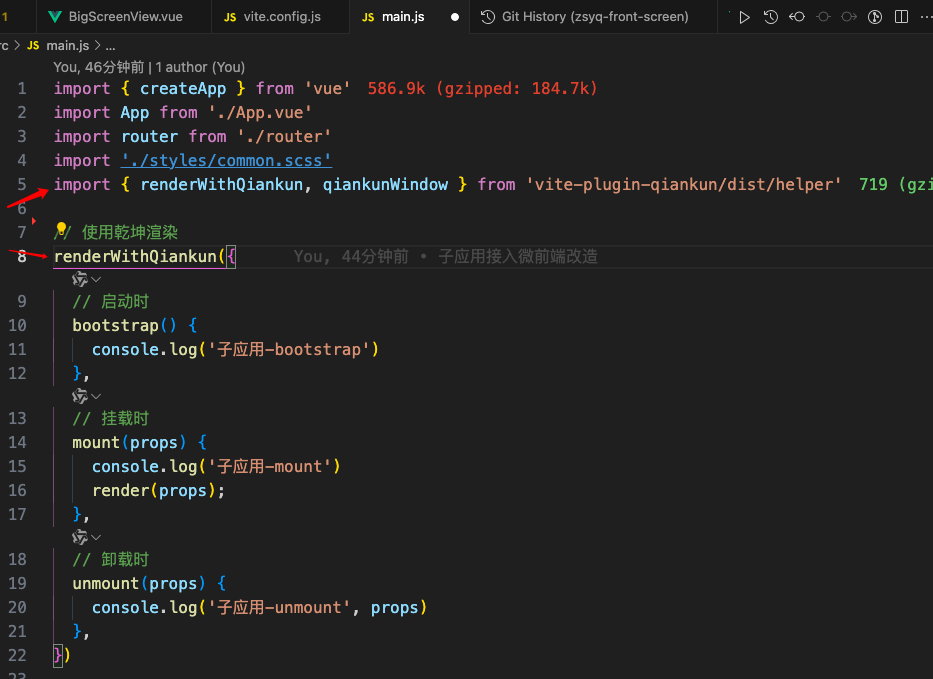
2. 子应用改造
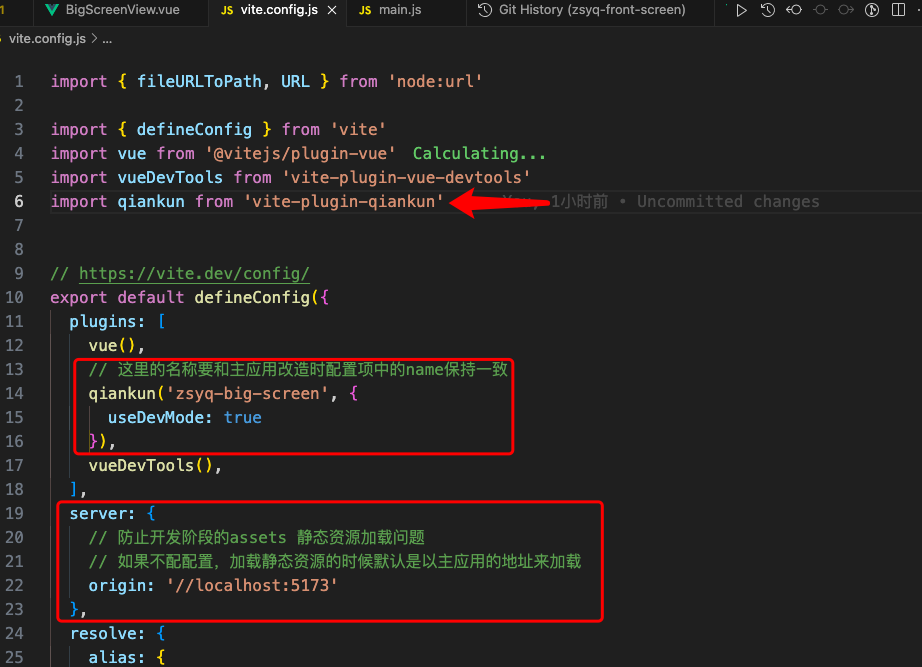
说明: qiankun 默认不支持 vite 项目作为子应用,需要借助 vite-plugin-qiankun 插件进行支持
1- 配置 vite-plugin-qiankun 插件
npm i vite-plugin-qiankun -D
vite.config.js中修改如下
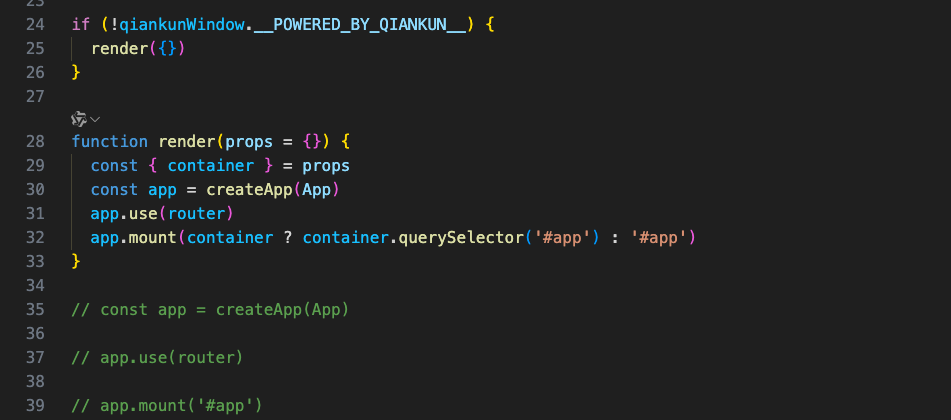
main.js修改
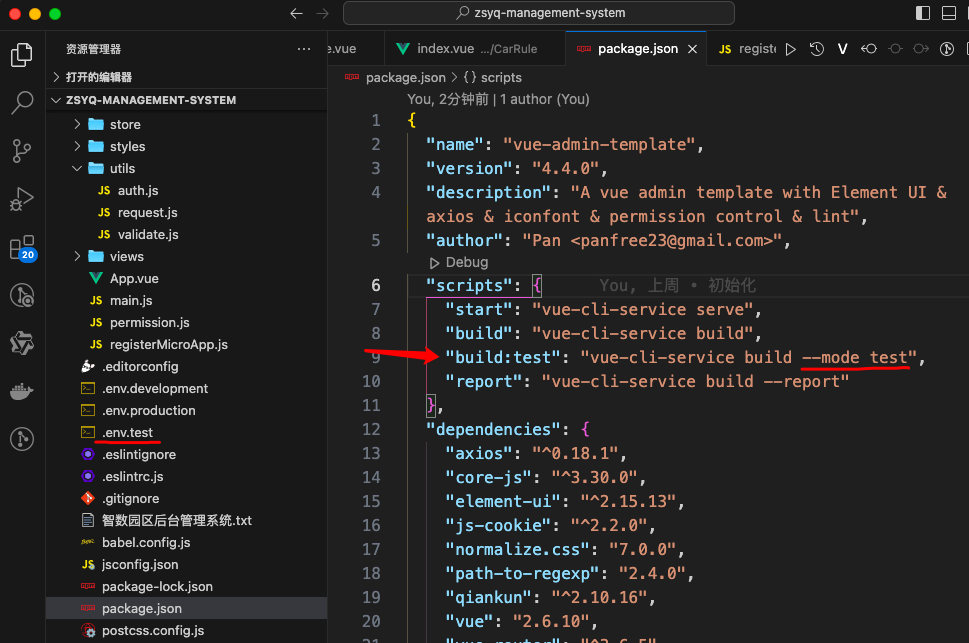
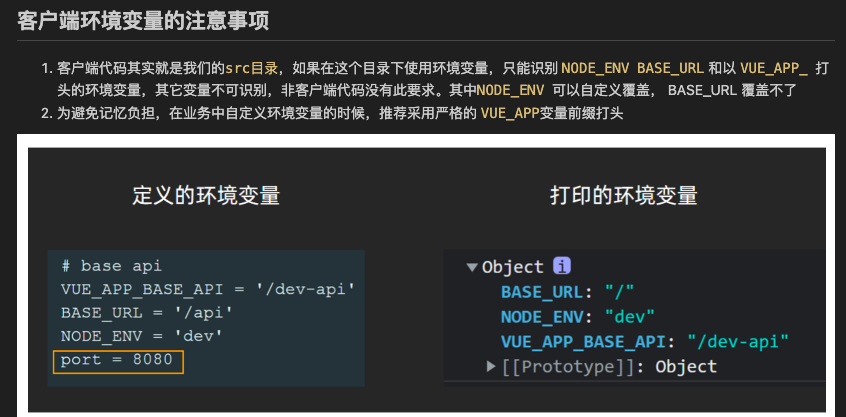
3. 配置不同环境变量
–mode 后面跟的名称与新增的.env.test中的后缀test是一致的
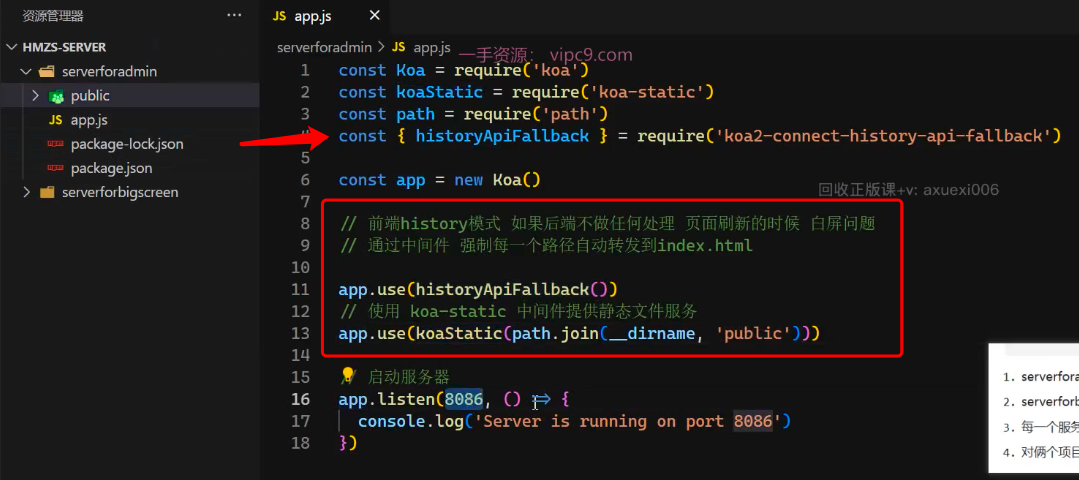
5. 部署有关
1. history模式刷新浏览器报404
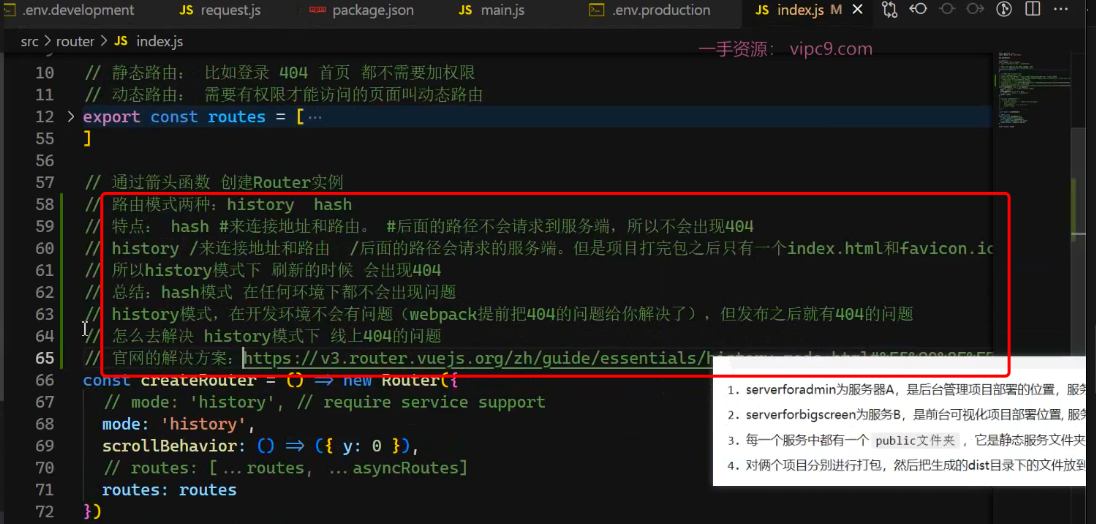
node服务器
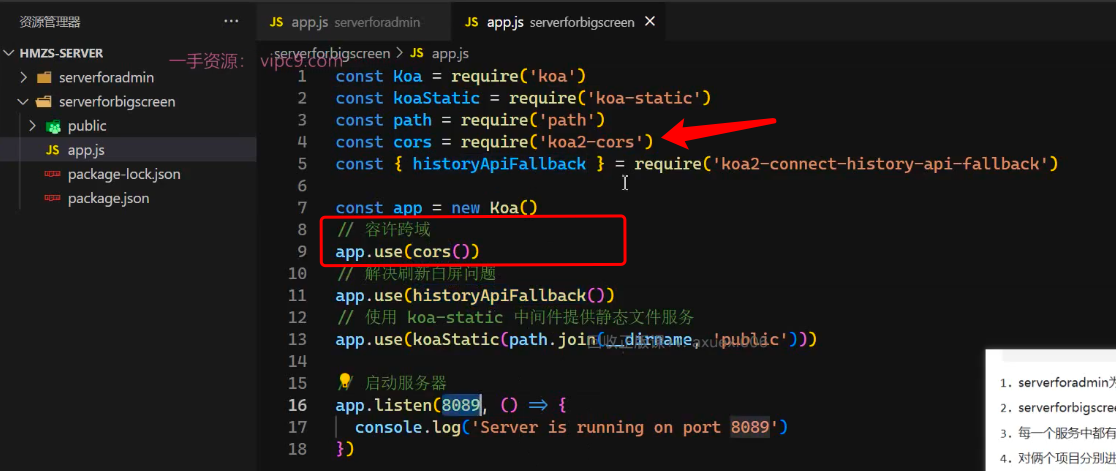
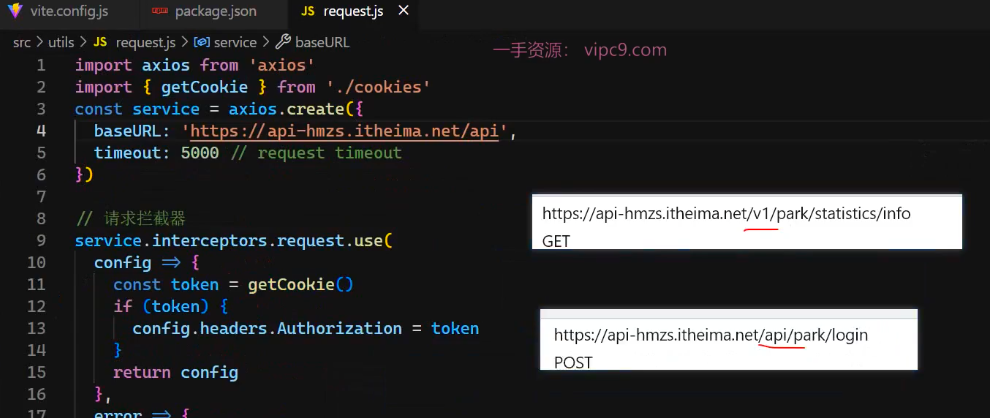
2.从后台项目点击跳转大屏,接口报401
cookie不互通,因为后台接口后面是api,大屏项目后面是v1,所以把大屏的也改成api
3. 根据不同环境,切换加载子应用的地址
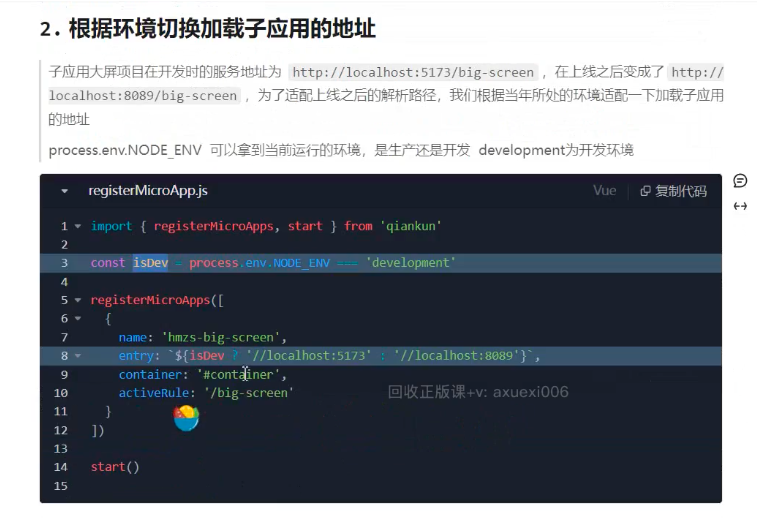
4. 更改子应用的base地址
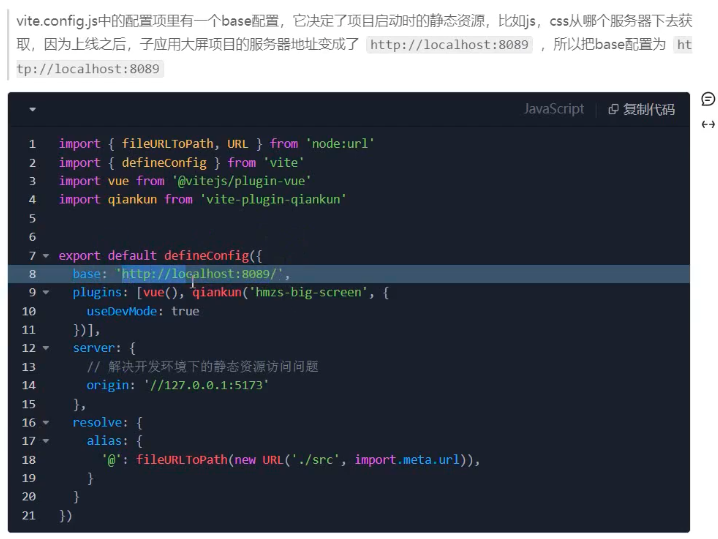
5. vue3路由基路径
vite,vue3路由这里参数的意思:加上之后再浏览器会自动带上app
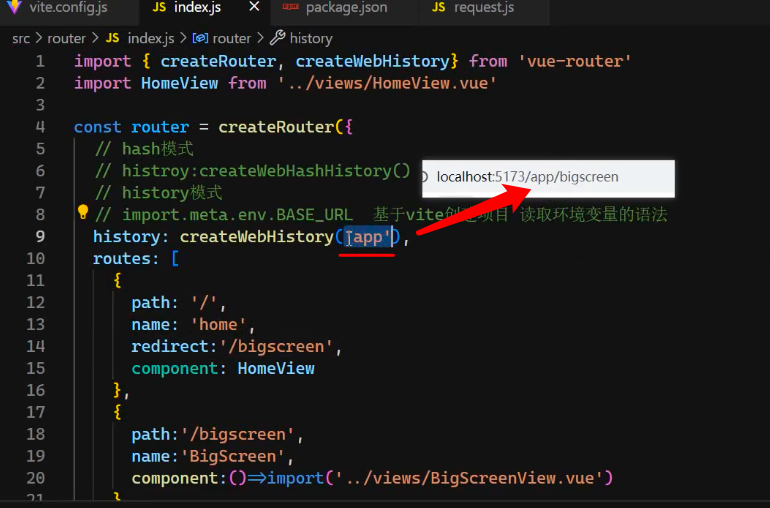
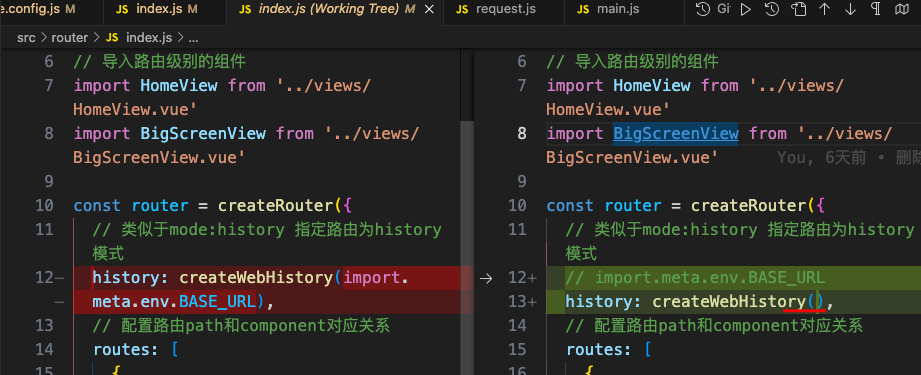
我们不需要,所以干掉
三、其他
1. github copilot
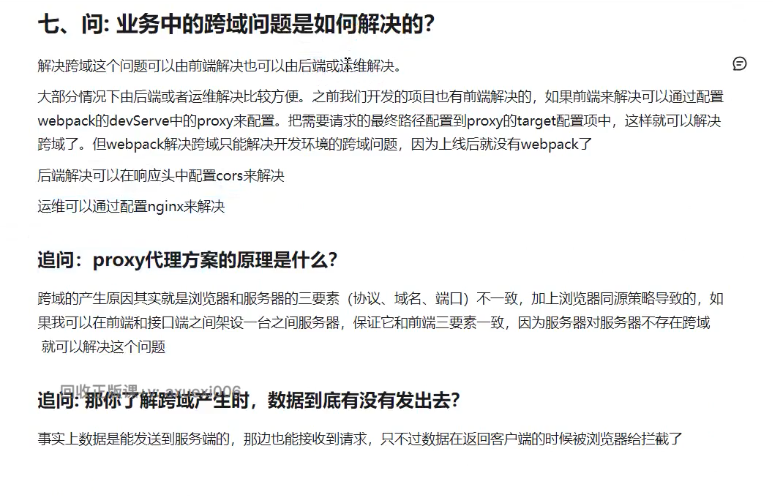
2. 跨域