对比学习与先验知识引导的特征提取网络在胶质瘤高风险复发区域预测中的应用|文献速递-深度学习人工智能医疗图像
Title
题目
Contrastive learning and prior knowledge-induced feature extractionnetwork for prediction of high-risk recurrence areas in Gliomas
对比学习与先验知识引导的特征提取网络在胶质瘤高风险复发区域预测中的应用
01
文献速递介绍
胶质瘤起源于神经胶质细胞,沿白质呈浸润性生长,是最常见的恶性脑肿瘤之一,具有高复发率和高死亡率(Wang 等,2022)。磁共振成像(MRI)是胶质瘤诊断、治疗及疗效评估的重要影像技术。在临床实践中,常规 MRI 序列应用最为广泛,包括 T1 加权(T1)、T2 加权(T2)、增强 T1 加权(T1C)和液体衰减反转恢复(FLAIR)图像。根据临床指南,胶质瘤的治疗采用手术联合术后放化疗的方案(Liu 等,2022a),手术标准为全切除(即 T1C 图像上无可见肿瘤残留及强化影)。全切除术后,放射治疗通常作为胶质瘤综合治疗策略的标准组成部分。尽管接受了全切除手术和术后放射治疗,胶质瘤的复发率仍然很高,潜在的高风险复发区域(HRA)通常位于手术腔附近的某些区域(Schipmann 等,2020)(如图 1 所示)。胶质瘤复发可能是由于肿瘤浸润区域接受的剂量不足所致(Lundemann 等,2019)。然而,增加辐射剂量也会提高辐射损伤的风险(Brambilla 等,2020)。若能在放射治疗前预测出高风险复发区域,便可根据预测结果合理设计放射治疗靶区剂量。因此,必须在术后早期 MRI 图像中预测高风险复发区域,以有效杀灭肿瘤细胞并保护脑组织。 高风险复发区域的预测是一项重要但极具挑战性的任务。尽管术后实现了全切除,但微观肿瘤细胞通常会残留,由于胶质瘤具有高度侵袭性和浸润性生长的特点,这些残留细胞难以通过视觉观察到。如图 1(b)和(d)所示,在术后早期常规 MRI 图像中,高风险复发区域与其他区域的信号强度差异在视觉上并不明显。此外,部分患者可能在胶质瘤复发前的随访过程中失访。而且,胶质瘤有时位于重要的脑功能区或手术难以触及的深部区域,这会使全切除手术变得困难。上述原因导致我们的高风险复发区域预测任务面临数据量少的问题。因此,高风险复发区域的定位难度较大,难以据此设计合理的辐射剂量。 目前,已有许多方法通过术前图像或部分切除后的图像来研究肿瘤生长预测,为高风险复发区域的预测提供了新视角。第一类是基于数学模型的方法,通过数学建模构建反应 - 扩散偏微分方程来实现(Engwer 等,2015;Lipková 等,2019;Engwer 和 Wenske,2021;Van Garderen 等,2021)。反应 - 扩散方程的基础是模拟肿瘤的增殖和扩散过程。具体而言,这些方法首先在术前图像中设定初始肿瘤点(即肿瘤位置和大小)。模型参数基于以往研究或观察结果确定,包括扩散系数、生长速率和生长时间等。随后,利用初始肿瘤点和模型参数预测肿瘤的生长情况。然而,由于全切除图像中缺失初始肿瘤点,此类方法难以应用于全切除图像。传统机器学习方法在肿瘤生长预测方面也取得了一些进展。这些方法手动提取与肿瘤相关的影像组学特征,然后在像素水平上构建分类器对术前图像的未来复发风险进行预测(Ren 等,2023;Morris 等,2006;Akbari 等,2016;Fathi Kazerooni 等,2021)。但手动提取的特征可能无法充分表征肿瘤的异质性,从而影响肿瘤生长的预测性能。随着深度学习方法的兴起,一些研究者开始考虑利用深度学习方法从提供多个时间点信息的术后纵向数据中学习肿瘤生长趋势,或确定反应 - 扩散方程的参数(Zhou 等,2023;Pati 等,2021;Ezhov 等,2023;Elazab 等,2020;Petersen 等,2021)。人们采用了不同的策略来验证这些方法的精度。在术前场景中,将预测的肿瘤生长扫描图像与随访复发扫描图像进行粗略配准,从而可在这两种扫描图像中验证肿瘤生长趋势。在术后场景中,直接将预测的肿瘤生长图像与复发图像进行比较,以验证预测准确性。尽管这些方法在肿瘤生长预测方面取得了一定成功,但大多数现有方法对数据有额外要求,例如需要正电子发射断层扫描(PET)、扩散张量成像(DTI)和纵向常规 MRI 数据等。这些数据在临床上获取成本高,且有时比常规 MRI 更难获取。此外,很少有研究仅利用术后早期全切除的常规 MRI 图像进行高风险复发区域预测。 为满足临床需求,本研究旨在填补这一空白,实现全切除 MRI 图像中的高风险复发区域预测。由于常规 MRI 图像无法提供肿瘤生长的动态信息,精确的肿瘤位置和形态(基于像素的预测)极难预测。与基于像素的方法不同,基于 patch 的方法只能获得大致位置。然而,与现有的放射治疗计划(即手术腔附近区域采用均匀低剂量)相比,复发 patch 的预测(图 2)可帮助临床专家有效优化放射治疗计划(即手术腔附近区域的高风险复发 patch 采用高剂量,非高风险复发 patch 采用低剂量)。因此,考虑到精确预测的难度和临床实践的可行性,本研究采用了基于 patch 的预测方法。 本文提出了一种基于对比学习和先验知识引导的特征提取网络(CLPKnet),用于术后早期全切除图像中的高风险复发区域预测。首先,构建了基于对比学习和多序列学习的编码器,用于从多序列 MRI 图像中提取特征,可增加提取特征的信息多样性。鉴于数据量少的问题,采用对比学习方法——动量对比(MoCo)(He 等,2020)对编码器进行预训练,以学习丰富的特征表示。其次,提出了双焦点融合模块,用于挖掘重要特征和区域,从而有效融合不同特征。第三,采用基于 patch 的预测方法来预测 patch 的复发概率。此外,结合先验引导白质扩散损失(PGWD loss,即临床先验),引导模型学习胶质瘤的生长模式,进一步提升预测性能。本文的贡献如下: - 提出了用于胶质瘤高风险复发区域预测的 CLPKnet,该网络挖掘手术腔周围信息多样性相关的关键特征和胶质瘤生长模式特征,并将其结合以提供与胶质瘤复发相关的互补信息。根据以往报道,在利用术后早期全切除常规 MRI 图像并结合胶质瘤生长模式学习来系统研究胶质瘤高风险复发区域预测方面仍存在空白。因此,CLPKnet 有望捕捉与胶质瘤复发相关的信息,并展现出更优的预测性能。 - 引入了通过 MoCo 预训练的基于对比学习和多序列学习的编码器,以解决数据集规模小的问题,并挖掘手术腔周围信息多样性相关特征,这有助于捕捉高风险复发区域与非高风险复发区域之间的细微差异。此外,将基于先验知识的白质扩散损失融入所提方法中,以学习胶质瘤的生长模式,进一步增强对高风险复发区域的识别判别能力。 - 提出了双焦点融合模块,包括空间注意力融合和序列注意力融合,用于自适应组合关键特征,以提供与胶质瘤复发相关的互补信息。此外,本研究采用基于 patch 的预测方法,以降低精确预测的难度,并为临床实践提供可行工具。 - 在来自四家医院的多中心数据集上对所提方法进行了高风险复发区域预测评估。依次将四家医院中的三家医院的样本作为独立测试集。实验结果表明,所提方法在高风险复发区域预测中表现出稳健且稳定的性能。此外,为验证所提方法的泛化性和稳健性,在两个外部数据集上进行了额外实验,对低级别胶质瘤(LGG)相关的浸润性水肿和脑膜瘤相关的血管源性水肿进行分类。所提方法在这两项任务中均表现出优异性能。
Abatract
摘要
Gliomas can easily recur even after standard treatments, and their recurrence may be related to insufficientradiation doses received by high-risk recurrence areas (HRA). Therefore, HRA prediction can help clinicalexperts in formulating effective radiotherapy plans. However, research on HRA prediction using earlypostoperative conventional MRI images with total resection is lacking. This gap is due to multifold challenges,including visually minimal differences between HRA and non-HRA and small dataset size caused by missingfollow-up data. A contrastive learning and prior knowledge-induced feature extraction network (CLPKnet) toexplore HRA-related features and achieve HRA prediction was proposed in this paper. First, a contrastiveand multisequence learning-based encoder was proposed to effectively extract diverse features across multipleMRI sequences around the operative cavity. Specifically, a contrastive learning method was employed topretrain the encoder, which enabled it to capture subtle differences between HRA and non-HRA regionswhile mitigating the challenges posed by the limited dataset size. Second, clinical prior knowledge wasincorporated into the CLPKnet to guide the model in learning the patterns of glioma growth and improveits discriminative capability for identifying HRA regions. Third, a dual-focus fusion module was utilized toexplore important sequential features and spatial regions and effectively fused multisequence features toprovide complementary information associated with glioma recurrence. Fourth, to balance clinical needs andtask difficulty, we used a patch-based prediction method to predict the recurrent probability. The CLPKnet wasvalidated on a multicenter dataset from four hospitals, and a remarkable performance was achieved. Moreover,the interpretability and robustness of our method were evaluated to illustrate its effectiveness and credibility.Therefore, the CLPKnet displays a great application potential for HRA prediction.
胶质瘤即使经过标准治疗也容易复发,其复发可能与高风险复发区域(HRA)接受的辐射剂量不足有关。因此,高风险复发区域预测能够帮助临床专家制定有效的放射治疗方案。然而,目前缺乏利用术后早期全切除的常规磁共振成像(MRI)图像进行高风险复发区域预测的研究。这一研究空白源于多方面的挑战,包括高风险复发区域与非高风险复发区域在视觉上的差异极小,以及因随访数据缺失导致的数据集规模较小等问题。 本文提出了一种基于对比学习和先验知识引导的特征提取网络(CLPKnet),用于挖掘与高风险复发区域相关的特征并实现高风险复发区域预测。首先,提出了一种基于对比学习和多序列学习的编码器,以有效提取手术腔周围多个MRI序列的多样化特征。具体而言,采用对比学习方法对编码器进行预训练,使其能够捕捉高风险复发区域与非高风险复发区域之间的细微差异,同时缓解数据集规模有限带来的挑战。其次,将临床先验知识融入CLPKnet,以引导模型学习胶质瘤的生长模式,提升其识别高风险复发区域的判别能力。第三,采用双焦点融合模块挖掘重要的序列特征和空间区域,并有效融合多序列特征,提供与胶质瘤复发相关的互补信息。第四,为平衡临床需求与任务难度,采用基于patch的预测方法来预测复发概率。 在来自四家医院的多中心数据集上对CLPKnet进行了验证,其表现优异。此外,还对该方法的可解释性和稳健性进行了评估,以证明其有效性和可信度。因此,CLPKnet在高风险复发区域预测中展现出巨大的应用潜力。
Method
方法
3.1. Material
For HRA prediction, the MRI images of gliomas used in this studywere obtained from Nanfang hospital (Hospital 1, 82 samples), TheFirst Affiliated Hospital of Zhengzhou University (Hospital 2, 36 samples), Sun Yat-sen University Cancer Center (Hospital 3, 18 samples),and Zhujiang hospital (Hospital 4, 42 samples). A total of 178 sampleswith gliomas were collected from these hospitals. Specifically, onlythose who met the following conditions were accepted: (1) gliomaswere diagnosed either clinically or pathologically; (2) samples withsurgical treatment were complete glioma resection, which meant thatno visible glioma remained in the early postoperative (before radiotherapy) MRI images; (3) MRI images were recorded at early post-operationand at the time of recurrence; (4) each sample contained four standardstructural MRI sequences (i.e., T1, T2, T1C, and FLAIR).The operative cavity was delineated by clinical experts on the T1CMRI images during early post-operation. For HRA delineation, theregions of glioma recurrence were initially observed on the T1C MRIimages at the time of recurrence. On the basis of clinical knowledgeand experience, HRA was then mapped back and delineated on T1CMRI images at early postoperation. In addition, a morphology-baseddilation algorithm was used for a uniform 1.5 cm expansion of theoperative cavity, and the expanded margin was used as a possiblerecurrence area. Moreover, the operative cavity combined with the1.5 cm margin was used as the region of interest (ROI). All MRI imageswere preprocessed as follows. First, N4 correction was performed on allMRI images to remove bias field artifacts. Second, all MRI sequences ofa sample were registered to the T1C MRI image. Third, skull strippingwas used to remove the skulls. Fourth, intensity normalization wasimplemented to scale the intensities to [0,1]. Fifth, for each slice ofan image, a minimized rectangle that covered the ROI was used tocrop the corresponding slice image. The cropped result, which wasdefined as rectangular ROI, was resized to 96 × 96, and it was usedas the input of our network. Moreover, given that our method is apatch-based prediction approach, each input was evenly divided into3 × 3 (total of 9) patches, with each patch having a size of 32 × 32(Fig. 3). Specifically, the central patch represented the operative cavity,whereas the eight other patches represented the extended 1.5 cmareas. Therefore, the relationship between the operative cavity andsurrounding areas was explored.We pretrained the encoder using MoCo on 752 samples from fourhospitals (381 from Hospital 1, 36 from Hospital 2, 18 from Hospital 3,and 317 from Hospital 4) under a broad inclusion criterion: (1) gliomaswere diagnosed either clinically or pathologically; (2) samples with surgical treatment can be complete or partial glioma resection; (3) sampleswith incomplete MRI sequence data can be included. All data used totrain MoCo were subjected to the following preprocessing procedures:N4 correction, registration, skull stripping, and intensity normalization.Moreover, all images were randomly cropped and resized to 96 × 96as input for the network to maintain consistency with the downstreamtask.For edema classification, we used data from 75 LGG from the braintumor segmentation (BraTS) dataset and 36 samples with meningiomafrom Hospital 4. The meningioma cases were included in accordancewith broad inclusion criteria: (1) diagnosis was established either clinically or pathologically, and (2) each sample had four standard preoperative structural MRI sequences available. The edema regions in Hospital4 were manually delineated by clinical experts, and those in the BraTSdataset were provided as a part of publicly available annotations.In both cases, the edema regions were used for classification. Then,all data in Hospital 4 were subjected to the following preprocessingprocedures: N4 correction, registration, and skull stripping. Followingpreprocessing, intensity normalization was performed on both Hospital4 and BraTS dataset to map voxel intensities to the [0, 1] range.For each MRI slice, a minimal bounding rectangle encompassing theedema was computed and used to crop the corresponding slice. Thecropped images were then resized to 96 × 96 pixels and served as inputsto our network. Moreover, given that our method was a patch-basedprediction approach, each input was evenly divided into 3 × 3 (total of
patches, with each a patch having a size of 32 × 32.This retrospective study is approved by the Ethics Review Committee of Zhujiang hospital and Sun Yat-sen University Cancer Center.Obtaining written informed consent is waived because of the retrospective design of the study. All samples’ data are anonymized (see Table1).
3.1 材料 本研究中用于高风险复发区域(HRA)预测的胶质瘤MRI图像来自南方医院(医院1,82例样本)、郑州大学第一附属医院(医院2,36例样本)、中山大学肿瘤防治中心(医院3,18例样本)和珠江医院(医院4,42例样本)。共从这些医院收集到178例胶质瘤样本。具体而言,仅纳入符合以下条件的样本:(1)经临床或病理诊断为胶质瘤;(2)接受手术治疗且实现胶质瘤全切除,即术后早期(放疗前)MRI图像中无可见肿瘤残留;(3)在术后早期和复发时均记录了MRI图像;(4)每个样本包含4种标准结构性MRI序列(即T1、T2、T1增强(T1C)和液体衰减反转恢复(FLAIR))。 临床专家在术后早期的T1C MRI图像上勾勒出手术腔。对于高风险复发区域的勾勒,首先在复发时的T1C MRI图像上观察胶质瘤复发区域,再基于临床知识和经验,将高风险复发区域映射回术后早期的T1C MRI图像并进行勾勒。此外,采用基于形态学的膨胀算法对手术腔进行1.5 cm的均匀扩展,扩展后的边缘区域作为潜在复发区域。将手术腔联合1.5 cm边缘区域定义为感兴趣区域(ROI)。所有MRI图像的预处理步骤如下:首先,对所有MRI图像进行N4校正以去除偏置场伪影;其次,将样本的所有MRI序列配准至T1C MRI图像;第三,采用颅骨剥离去除颅骨;第四,进行强度归一化,将强度值缩放至[0,1]范围;第五,对图像的每个切片,采用覆盖感兴趣区域的最小矩形进行裁剪,裁剪后的结果定义为矩形感兴趣区域,将其调整为96×96大小,作为网络的输入。此外,由于本研究采用基于图像块(patch)的预测方法,每个输入被均匀划分为3×3(共9个)图像块,每个图像块大小为32×32(图3)。其中,中心图像块代表手术腔,其余8个图像块代表1.5 cm扩展区域,以此探究手术腔与周围区域的关系。 我们使用动量对比(MoCo)方法在来自4家医院的752例样本(医院1 381例、医院2 36例、医院3 18例、医院4 317例)上对编码器进行预训练,纳入标准较宽泛:(1)经临床或病理诊断为胶质瘤;(2)接受手术治疗的样本可为胶质瘤全切除或部分切除;(3)可纳入MRI序列数据不完整的样本。用于MoCo训练的所有数据均经过以下预处理:N4校正、配准、颅骨剥离和强度归一化。此外,所有图像均经过随机裁剪并调整为96×96大小,作为网络输入,以与下游任务保持一致。 在水肿分类任务中,我们使用了脑肿瘤分割(BraTS)数据集中的75例低级别胶质瘤(LGG)样本和来自医院4的36例脑膜瘤样本。脑膜瘤病例的纳入标准较宽泛:(1)经临床或病理确诊;(2)每个样本具备4种标准术前结构性MRI序列。医院4的水肿区域由临床专家手动勾勒,BraTS数据集中的水肿区域为公开标注的一部分。在这两项任务中,均使用水肿区域进行分类。医院4的所有数据均经过以下预处理:N4校正、配准和颅骨剥离。预处理后,对医院4和BraTS数据集均进行强度归一化,将体素强度映射至[0,1]范围。对每个MRI切片,计算包含水肿区域的最小边界矩形并裁剪对应切片,裁剪后的图像调整为96×96像素,作为网络输入。此外,由于本方法采用基于图像块的预测方式,每个输入被均匀划分为3×3(共9个)图像块,每个图像块大小为32×32。 本回顾性研究已获得珠江医院和中山大学肿瘤防治中心伦理审查委员会的批准。由于研究为回顾性设计,免除了知情同意书的签署。所有样本数据均已匿名化处理(见表1)。
Conclusion
结论
We have proposed an accurate and effective framework namedCLPKnet to achieve HRA prediction. In CLPKnet, the multi-sequencelearning-based encoder was constructed to effectively explore information related to HRA, and the dual-focus fusion module was developedfor fusing multi-sequence features. Additionally, a patch-based prediction strategy was used to estimate the recurrent risk of each patchto balance clinical needs and task difficulty. Clinical prior knowledgeabout glioma invasion was incorporated into CLPKnet, which couldincrease the credibility and robustness of the proposed method. Consequently, the proposed model achieved excellent performance in HRAprediction in our independent testing set, implying its remarkablepotential in clinical practices.
我们提出了一个名为CLPKnet的精准且高效的框架,用于实现高风险复发区域(HRA)的预测。在CLPKnet中,构建了基于多序列学习的编码器,以有效挖掘与高风险复发区域相关的信息;同时设计了双焦点融合模块,用于融合多序列特征。此外,采用基于图像块(patch)的预测策略来评估每个图像块的复发风险,从而平衡临床需求与任务难度。该框架还融入了关于胶质瘤侵袭的临床先验知识,这有助于提升所提方法的可信度和稳健性。实验结果表明,所提模型在独立测试集中的高风险复发区域预测任务上表现优异,彰显出其在临床实践中的巨大潜力。
Figure
图
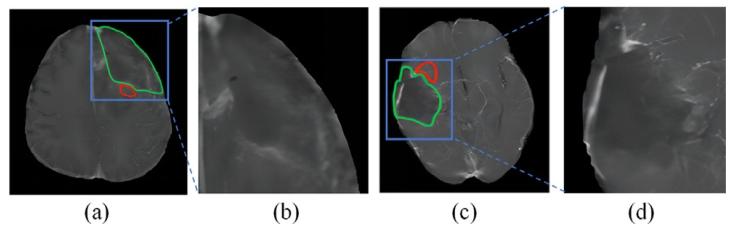
Fig. 1. The postoperative T1C MRI images after total resection of different patientsare shown in (a) and (c). The amplified areas of the blue bounding areas by 2.5 timesare shown in (b) and (d). Specifically, green and red curves are operative cavities andHRA of gliomas
图1 (a)和(c)展示了不同患者全切除术后的T1增强(T1C)MRI图像。(b)和(d)为蓝色框选区域的2.5倍放大图。其中,绿色曲线表示手术腔,红色曲线表示胶质瘤的高风险复发区域(HRA)。
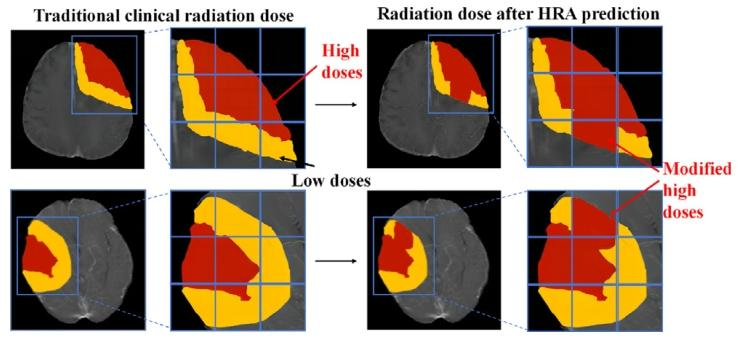
Fig. 2. Difference in radiation doses between traditional clinical plan and refinedradiotherapy plan after HRA prediction
图2 传统临床方案与高风险复发区域(HRA)预测后优化放疗方案的辐射剂量差异。
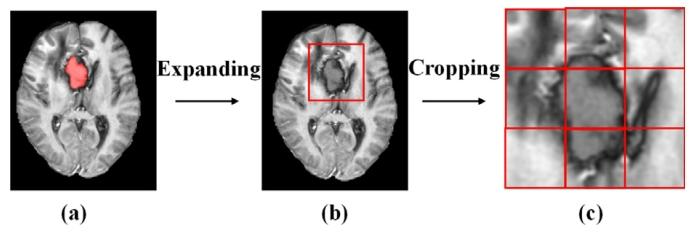
Fig. 3. (a) Early postoperative image, where operative cavity was painted in red; (b)minimized rectangle that covered the ROI (the operative cavity combined with the1.5 cm margin) was used to crop the early postoperative image; and (c) rectangularROI was amplified and divided into 3 × 3 patches.
图3 (a)术后早期图像,其中手术腔用红色标注;(b)采用覆盖感兴趣区域(ROI,即手术腔联合1.5厘米边缘区域)的最小矩形对术后早期图像进行裁剪;(c)将矩形感兴趣区域放大并划分为3×3的图像块(patches)。
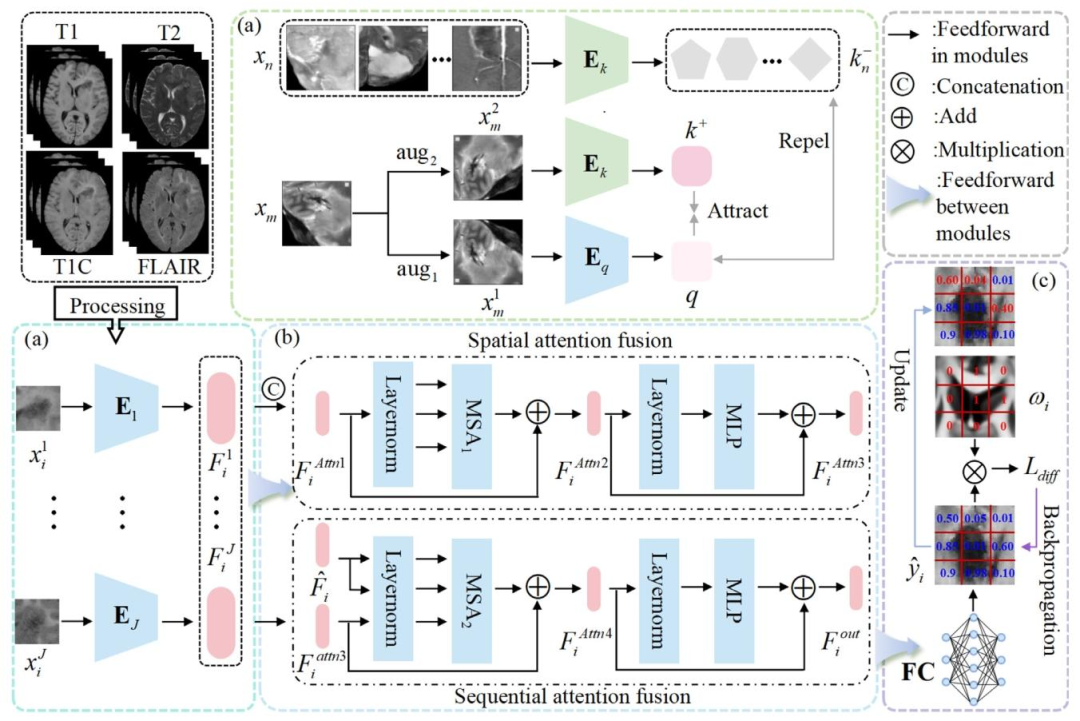
Fig. 4. Overall framework of the proposed method. (a) The encoders pretrained by MoCo strategy: ⃝1 Images from different samples and different sequences of the same samplewere treated as negative samples and augmented versions of the same image as positive samples to train the encoders and alleviate the issue of limited data size; ⃝2 the pretrainedencoders were used as encoders of different sequence images in the downstream task to obtain the high-level semantic features of patches 𝐹𝑖 𝑗 ; (b) dual-focus fusion module wasproposed to focus on crucial regions, integrate nonlinear relationships in 𝐹𝑖 𝑗 , and obtain the features 𝐹𝑖 𝑜𝑢𝑡 = { 𝐹𝑖 𝑝 } 𝑝=1...9 ; (c) prior guided patch-based prediction: ⃝1 𝐹𝑖 𝑝 was fedinto two fully connected layers to obtain the estimated probability of the HRA prediction ̂𝑦 𝑝 𝑖 ; ⃝2 a PGWD loss was introduced to incorporate the clinical prior knowledge, whichimproved recurrence prediction performance
图4 所提方法的整体框架。(a)通过动量对比(MoCo)策略预训练的编码器:⃝1 来自不同样本的图像和同一样本不同序列的图像被视为负样本,同一图像的增强版本被视为正样本,用于训练编码器并缓解数据量有限的问题;⃝2 预训练的编码器作为下游任务中不同序列图像的编码器,用于获取图像块的高层语义特征 𝐹𝑖 𝑗;(b)提出双焦点融合模块,用于聚焦关键区域,整合 𝐹𝑖 𝑗 中的非线性关系,得到特征 𝐹**𝑖 𝑜𝑢𝑡 = { 𝐹𝑖 𝑝 } 𝑝=1...9;(c)基于先验引导的图像块预测:⃝1 将 𝐹**𝑖 𝑝 输入两个全连接层,得到高风险复发区域(HRA)预测的估计概率 ̂𝑦 𝑝 𝑖;⃝2 引入先验引导白质扩散(PGWD)损失以融入临床先验知识,从而提升复发预测性能。
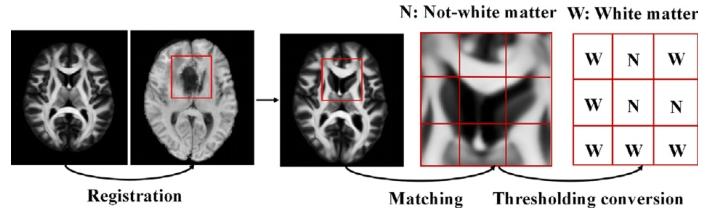
Fig. 5. Steps of constructing a weighted map
图5 加权图的构建步骤
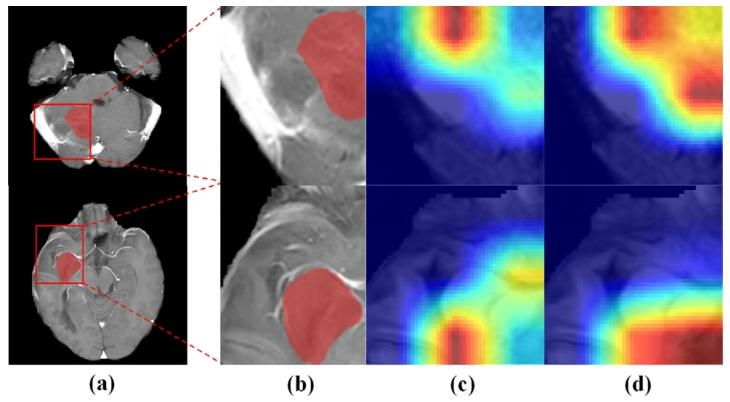
Fig. 6. (a) Origin T1C MRI images. (b) Amplified rectangular ROI with HRA regions(red region). (c)/(d) Regions captured by using the proposed method without/with thedual-focus fusion module
图6 (a)原始T1增强(T1C)MRI图像;(b)含高风险复发区域(HRA,红色区域)的矩形感兴趣区域(ROI)放大图;(c)/(d)所提方法在未使用/使用双焦点融合模块时捕捉到的区域。
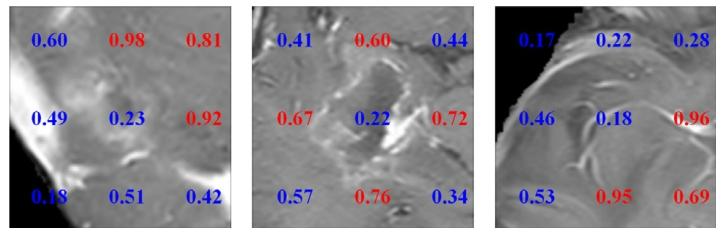
Fig. 7. Visualization result of the proposed method. Estimated probability of HRAprediction for each patch. Red and blue numbers represent areas of HRA or non-HRA,respectively
图7 所提方法的可视化结果。每个图像块(patch)的高风险复发区域(HRA)预测概率。红色数字和蓝色数字分别代表高风险复发区域和非高风险复发区域。
Table
表
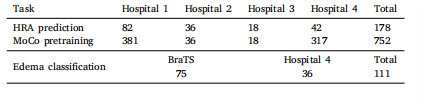
Table 1Summary of all datasets used in this study
表1 本研究中使用的所有数据集汇总
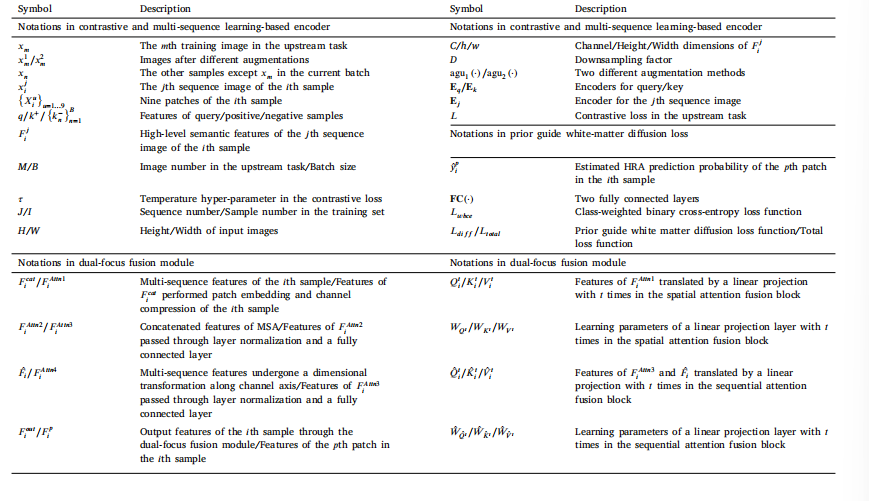
Table 2Main annotations in this study
表2 本研究中的主要标注信息
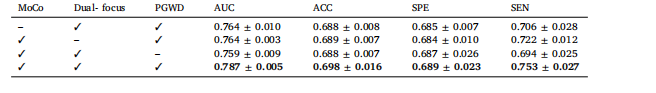
Table 3Ablation experiments of the proposed method for HRA prediction
表3 所提方法在高风险复发区域(HRA)预测任务中的消融实验结果
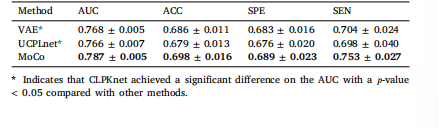
Table 4Prediction performance of different pretraining strategies
表4 不同预训练策略的预测性能
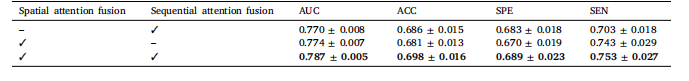
Table 5Effects of using different feature fusion methods
表5 不同特征融合方法的效果
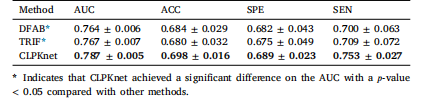
Table 6List of various domain shift scenarios in literature
表6 文献中各类领域偏移场景的列表。
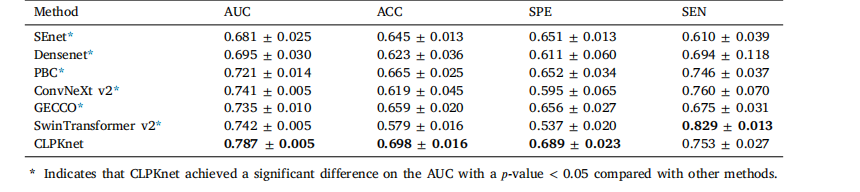
Table 7Prediction performance of our proposed method compared with that of other methods
表7 所提方法与其他方法的预测性能对比
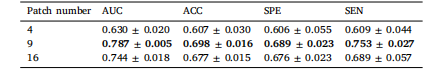
Table 8Prediction performance of our proposed method on different patch numbers
表8 所提方法在不同补丁数量下的预测性能
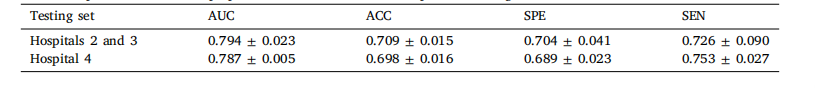
Table 9Prediction performance of our proposed method on different independent testing sets
表9 所提方法在不同独立测试集上的预测性能
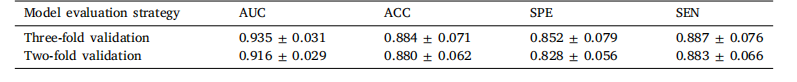
Table 10Edema classification results obtained using our proposed method.
表10 采用所提方法得到的水肿分类结果
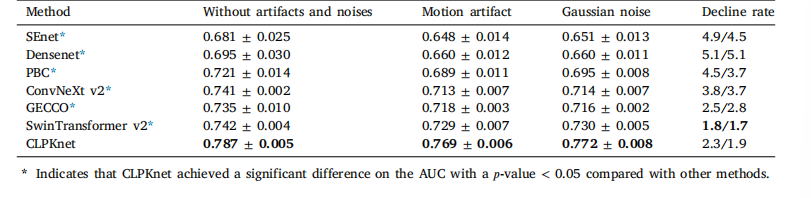
Table 11Prediction AUC of different Gaussian noise addition and motion artifact methods
表11 不同高斯噪声添加方法和运动伪影方法的预测AUC值