一周学会Matplotlib3 Python 数据可视化-绘制绘制甘特图
锋哥原创的Matplotlib3 Python数据可视化视频教程:
2026版 Matplotlib3 Python 数据可视化 视频教程(无废话版) 玩命更新中~_哔哩哔哩_bilibili
课程介绍
本课程讲解利用python进行数据可视化 科研绘图-Matplotlib,学习Matplotlib图形参数基本设置,绘图参数及主要函数,以及Matplotlib基础绘图,和Matplotlib高级绘图。
绘制绘制甘特图
甘特图(Gantt Chart)是一种常用的项目管理工具,用于可视化项目进度、任务安排和时间线。Matplotlib 提供了灵活的方式来创建专业的甘特图。
基本概念
-
任务条:表示任务持续时间的水平条形
-
里程碑:表示关键时间点的标记
-
依赖关系:任务之间的先后顺序关系
-
时间轴:显示项目时间范围的坐标轴
基础甘特图示例
import matplotlib.pyplot as plt
import matplotlib.dates as mdates
from datetime import datetime, timedelta
import numpy as np
# 设置中文字体支持
plt.rcParams['font.sans-serif'] = ['SimHei'] # 用来正常显示中文标签
plt.rcParams['axes.unicode_minus'] = False # 用来正常显示负号
# 任务数据
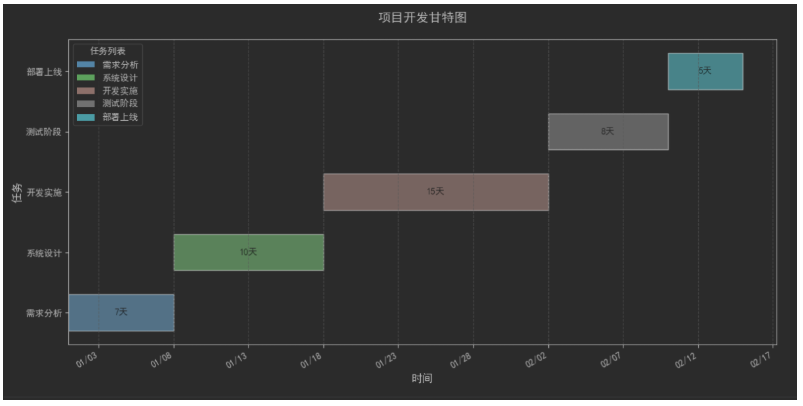
tasks = [{'name': '需求分析', 'start': '2023-01-01', 'duration': 7},{'name': '系统设计', 'start': '2023-01-08', 'duration': 10},{'name': '开发实施', 'start': '2023-01-18', 'duration': 15},{'name': '测试阶段', 'start': '2023-02-02', 'duration': 8},{'name': '部署上线', 'start': '2023-02-10', 'duration': 5}
]
# 将日期字符串转换为datetime对象
for task in tasks:task['start'] = datetime.strptime(task['start'], '%Y-%m-%d')task['end'] = task['start'] + timedelta(days=task['duration'])
# 创建图形
fig, ax = plt.subplots(figsize=(12, 6))
# 颜色映射
colors = plt.cm.tab10(np.linspace(0, 1, len(tasks)))
# 绘制任务条
for i, task in enumerate(tasks):start = task['start']end = task['end']ax.barh(task['name'],width=(end - start).days,left=start,height=0.6,color=colors[i],edgecolor='black',alpha=0.8)
# 添加任务持续时间标签mid_date = start + (end - start) / 2ax.text(mid_date, i, f"{task['duration']}天",va='center', ha='center', color='white', fontweight='bold')
# 设置日期格式
date_format = mdates.DateFormatter('%m/%d')
ax.xaxis.set_major_formatter(date_format)
ax.xaxis.set_major_locator(mdates.DayLocator(interval=5))
# 添加网格
ax.grid(axis='x', linestyle='--', alpha=0.7)
# 设置标题和标签
plt.title('项目开发甘特图', fontsize=14, pad=20)
plt.xlabel('时间', fontsize=12)
plt.ylabel('任务', fontsize=12)
# 自动调整日期显示
fig.autofmt_xdate()
# 添加图例
from matplotlib.patches import Patch
legend_elements = [Patch(facecolor=colors[i], label=tasks[i]['name'])for i in range(len(tasks))]
ax.legend(handles=legend_elements, loc='best', title='任务列表')
plt.tight_layout()
plt.show()