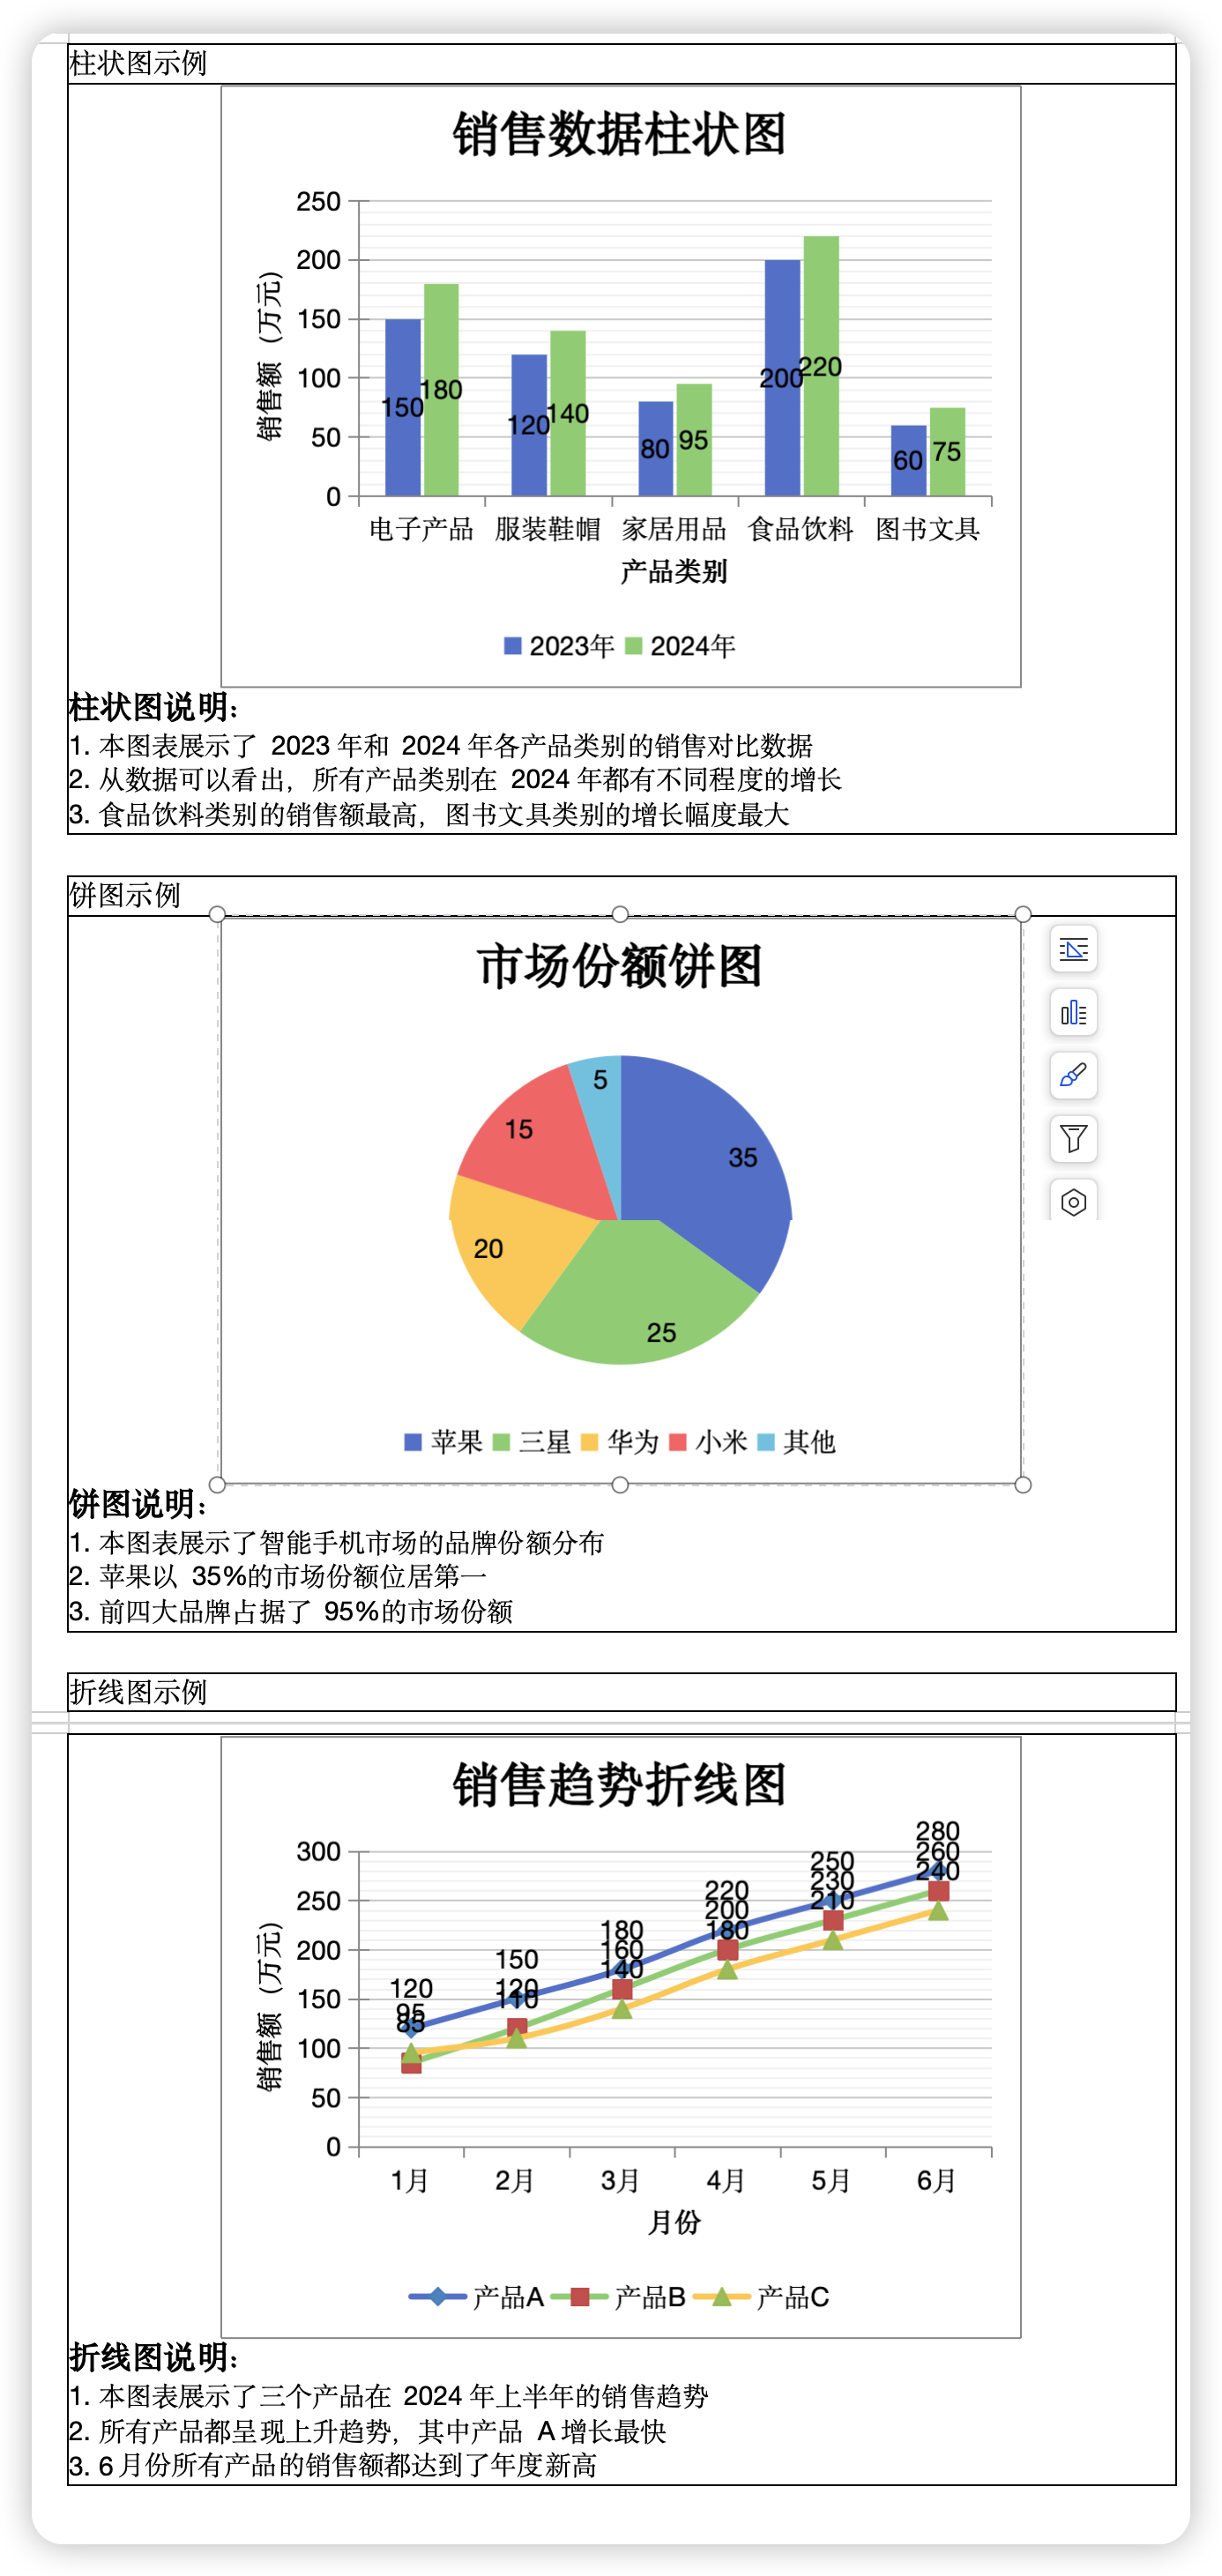
Java 导出word 实现表格内插入图表(柱状图、折线图、饼状图)--可编辑数据
表格内插入图表导出效果
表格内图表生成流程分析
核心问题与解决方案
问题
- Word 图表作为独立对象,容易与文本分离
- 位置难以精确控制,编辑时容易偏移
- 缺乏与表格数据的关联性
解决方案
- 直接嵌入:将图表嵌入表格单元格,确保数据关联
- 精确控制:使用
CTInline控制位置和大小 - 格式兼容:利用 DrawingML 格式实现精确嵌入
核心流程(5个关键步骤)
1. 准备阶段
// 验证参数,获取文档对象
XWPFDocument document = cellParagraph.getDocument();
XWPFRun run = cellParagraph.createRun();
CTInline inline = run.getCTR().addNewDrawing().addNewInline();
2. 图表创建
// 创建图表对象并渲染数据
XWPFChart chart = createChartInCell(document, chartConfig, widthEMU, heightEMU);
String chartRelId = document.getRelationId(chart);
3. 图表嵌入
// 构建 DrawingML XML 并嵌入
String chartXml = "<a:graphic xmlns:a=\"...\">...</a:graphic>";
XmlToken xmlToken = XmlToken.Factory.parse(chartXml);
inline.set(xmlToken);
4. 位置控制
// 设置边距和尺寸,确保图表完全限制在单元格内
inline.setDistT(0); inline.setDistB(0); inline.setDistL(0); inline.setDistR(0);
extent.setCx(widthEMU); extent.setCy(heightEMU);
5. 清理优化
// 权限保护和重复内容清理
TableChartCleanupUtil.cleanupTableAfterCharts(document);
关键技术要点
1. EMU 单位转换
int widthEMU = (int) (width * Units.EMU_PER_PIXEL);
- Word 文档使用 EMU (English Metric Units) 作为标准度量单位
- 确保图表尺寸的精确控制
2. DrawingML XML 嵌入
- 使用 DrawingML 格式定义图表结构
- 通过
r:id属性建立图表对象与嵌入内容的关联 - 实现图表在单元格中的精确定位
3. 数据源管理
- 使用嵌入的 Excel 数据作为图表数据源
- 数据与文档结构分离,便于维护
- 支持复杂的数据计算和格式化
图表类型特殊处理
柱状图/折线图
- 支持多系列数据
- 需要 X 轴和 Y 轴配置
- 支持网格线和数据标签
饼图
- 单系列数据
- 不需要坐标轴
- 数据验证:不能有负值或0值
设计优势
1. 精确控制
- 图表完全限制在单元格内
- 边距和尺寸精确控制
- 位置固定,不会因编辑而偏移
2. 数据关联
- 图表与表格数据紧密关联
- 便于数据展示和分析
- 支持复杂的数据结构
3. 格式兼容
- 与 Word 2007+ 格式完全兼容
- 支持 DrawingML 的所有功能
- 与 Excel 图表格式兼容
4. 易于扩展
- 模块化设计
- 支持新图表类型快速集成
- 配置驱动的样式管理
测试代码
package com.gemantic.gpt.util;import java.io.FileOutputStream;
import java.util.List;import org.apache.poi.xwpf.usermodel.XWPFDocument;
import org.apache.poi.xwpf.usermodel.XWPFParagraph;
import org.apache.poi.xwpf.usermodel.XWPFTable;
import org.apache.poi.xwpf.usermodel.XWPFTableCell;import com.fasterxml.jackson.databind.JsonNode;
import com.fasterxml.jackson.databind.ObjectMapper;
import org.apache.poi.xwpf.usermodel.IBodyElement;
import org.apache.poi.xwpf.usermodel.XWPFRun;/*** 测试表格内图表的修复效果*/
public class TableChartTest {public static void main(String[] args) throws Exception {// 1. 创建文档XWPFDocument document = new XWPFDocument();ObjectMapper mapper = new ObjectMapper();// 2. 测试柱状图System.out.println("=== 测试表格内的柱状图 ===");XWPFTable barTable = document.createTable(2, 1);barTable.setWidth("100%");barTable.setCellMargins(10, 10, 10, 10);barTable.getRow(0).getCell(0).setText("柱状图示例");barTable.getRow(1).getCell(0).setText("");XWPFTableCell barChartCell = barTable.getRow(1).getCell(0);barChartCell.removeParagraph(0);XWPFParagraph barChartParagraph = barChartCell.addParagraph();barChartParagraph.setAlignment(org.apache.poi.xwpf.usermodel.ParagraphAlignment.CENTER);String barChartConfigJson = "{\n" +"    \"type\": \"chart_bar\",\n" +"    \"title\": \"销售数据柱状图\",\n" +"    \"xAxisTitle\": \"产品类别\",\n" +"    \"yAxisTitle\": \"销售额(万元)\",\n" +"    \"showTitle\": true,\n" +"    \"showGrid\": true,\n" +"    \"showLegend\": true,\n" +"    \"showDataLabel\": true,\n" +"    \"showAxisLabel\": true,\n" +"    \"showAxis\": true,\n" +"    \"legend\": [\"2023年\", \"2024年\"],\n" +"    \"colors\": [\"#5470c6\", \"#91cc75\"],\n" +"    \"valueList\": [\n" +"        {\"name\": \"电子产品\", \"value\": [150, 180]},\n" +"        {\"name\": \"服装鞋帽\", \"value\": [120, 140]},\n" +"        {\"name\": \"家居用品\", \"value\": [80, 95]},\n" +"        {\"name\": \"食品饮料\", \"value\": [200, 220]},\n" +"        {\"name\": \"图书文具\", \"value\": [60, 75]}\n" +"    ]\n" +"}";JsonNode barChartConfig = mapper.readTree(barChartConfigJson);String barChartValueNodeJson = "{\n" +"    \"type\": \"image\",\n" +"    \"imageType\": \"chart\",\n" +"    \"width\": 400,\n" +"    \"height\": 300,\n" +"    \"chartConfig\": " + barChartConfigJson + "\n" +"}";JsonNode barChartValueNode = mapper.readTree(barChartValueNodeJson);TableChartUtil.handleChart(barChartParagraph, barChartValueNode, barChartConfig, 96, false, 400, 300);// 添加柱状图说明addChartDescription(barChartCell, "柱状图说明:","1. 本图表展示了2023年和2024年各产品类别的销售对比数据","2. 从数据可以看出,所有产品类别在2024年都有不同程度的增长","3. 食品饮料类别的销售额最高,图书文具类别的增长幅度最大");// 3. 测试饼图System.out.println("\n=== 测试表格内的饼图 ===");XWPFParagraph spacer1 = document.createParagraph();spacer1.createRun().setText("");XWPFTable pieTable = document.createTable(2, 1);pieTable.setWidth("100%");pieTable.setCellMargins(10, 10, 10, 10);pieTable.getRow(0).getCell(0).setText("饼图示例");pieTable.getRow(1).getCell(0).setText("");XWPFTableCell pieChartCell = pieTable.getRow(1).getCell(0);pieChartCell.removeParagraph(0);XWPFParagraph pieChartParagraph = pieChartCell.addParagraph();pieChartParagraph.setAlignment(org.apache.poi.xwpf.usermodel.ParagraphAlignment.CENTER);String pieChartConfigJson = "{\n" +"    \"type\": \"chart_pie\",\n" +"    \"title\": \"市场份额饼图\",\n" +"    \"showTitle\": true,\n" +"    \"showLegend\": true,\n" +"    \"showDataLabel\": true,\n" +"    \"colors\": [\"#5470c6\", \"#91cc75\", \"#fac858\", \"#ee6666\", \"#73c0de\"],\n" +"    \"valueList\": [\n" +"        {\"name\": \"苹果\", \"value\": [35]},\n" +"        {\"name\": \"三星\", \"value\": [25]},\n" +"        {\"name\": \"华为\", \"value\": [20]},\n" +"        {\"name\": \"小米\", \"value\": [15]},\n" +"        {\"name\": \"其他\", \"value\": [5]}\n" +"    ]\n" +"}";JsonNode pieChartConfig = mapper.readTree(pieChartConfigJson);String pieChartValueNodeJson = "{\n" +"    \"type\": \"image\",\n" +"    \"imageType\": \"chart\",\n" +"    \"width\": 400,\n" +"    \"height\": 300,\n" +"    \"chartConfig\": " + pieChartConfigJson + "\n" +"}";JsonNode pieChartValueNode = mapper.readTree(pieChartValueNodeJson);TableChartUtil.handlePieChart(pieChartParagraph, pieChartValueNode, pieChartConfig, 96, false, 400, 300);// 添加饼图说明addChartDescription(pieChartCell, "饼图说明:","1. 本图表展示了智能手机市场的品牌份额分布","2. 苹果以35%的市场份额位居第一","3. 前四大品牌占据了95%的市场份额");// 4. 测试折线图System.out.println("\n=== 测试表格内的折线图 ===");XWPFParagraph spacer2 = document.createParagraph();spacer2.createRun().setText("");XWPFTable lineTable = document.createTable(2, 1);lineTable.setWidth("100%");lineTable.setCellMargins(10, 10, 10, 10);lineTable.getRow(0).getCell(0).setText("折线图示例");lineTable.getRow(1).getCell(0).setText("");XWPFTableCell lineChartCell = lineTable.getRow(1).getCell(0);lineChartCell.removeParagraph(0);XWPFParagraph lineChartParagraph = lineChartCell.addParagraph();lineChartParagraph.setAlignment(org.apache.poi.xwpf.usermodel.ParagraphAlignment.CENTER);String lineChartConfigJson = "{\n" +"    \"type\": \"chart_line\",\n" +"    \"title\": \"销售趋势折线图\",\n" +"    \"xAxisTitle\": \"月份\",\n" +"    \"yAxisTitle\": \"销售额(万元)\",\n" +"    \"colors\": [\n" +"        \"#5470c6\",\n" +"        \"#91cc75\",\n" +"        \"#fac858\"\n" +"    ],\n" +"    \"showTitle\": true,\n" +"    \"showGrid\": true,\n" +"    \"showLegend\": true,\n" +"    \"showDataLabel\": true,\n" +"    \"showAxisLabel\": true,\n" +"    \"showAxis\": true,\n" +"    \"legend\": [\n" +"        \"产品A\",\n" +"        \"产品B\",\n" +"        \"产品C\"\n" +"    ],\n" +"    \"valueList\": [\n" +"        {\n" +"            \"name\": \"1月\",\n" +"            \"value\": [120, 85, 95]\n" +"        },\n" +"        {\n" +"            \"name\": \"2月\",\n" +"            \"value\": [150, 120, 110]\n" +"        },\n" +"        {\n" +"            \"name\": \"3月\",\n" +"            \"value\": [180, 160, 140]\n" +"        },\n" +"        {\n" +"            \"name\": \"4月\",\n" +"            \"value\": [220, 200, 180]\n" +"        },\n" +"        {\n" +"            \"name\": \"5月\",\n" +"            \"value\": [250, 230, 210]\n" +"        },\n" +"        {\n" +"            \"name\": \"6月\",\n" +"            \"value\": [280, 260, 240]\n" +"        }\n" +"    ]\n" +"}";JsonNode lineChartConfig = mapper.readTree(lineChartConfigJson);String lineChartValueNodeJson = "{\n" +"    \"type\": \"image\",\n" +"    \"imageType\": \"chart\",\n" +"    \"width\": 400,\n" +"    \"height\": 300,\n" +"    \"chartConfig\": " + lineChartConfigJson + "\n" +"}";JsonNode lineChartValueNode = mapper.readTree(lineChartValueNodeJson);TableChartUtil.handleChart(lineChartParagraph, lineChartValueNode, lineChartConfig, 96, false, 400, 300);// 添加折线图说明addChartDescription(lineChartCell, "折线图说明:","1. 本图表展示了三个产品在2024年上半年的销售趋势","2. 所有产品都呈现上升趋势,其中产品A增长最快","3. 6月份所有产品的销售额都达到了年度新高");// 5. 输出文档元素信息System.out.println("\n=== 文档元素信息 ===");System.out.println("最终文档元素数量: " + document.getBodyElements().size());System.out.println("文档元素类型:");for (int i = 0; i < document.getBodyElements().size(); i++) {IBodyElement element = document.getBodyElements().get(i);System.out.println("  元素 " + i + ": " + element.getClass().getSimpleName());}// 6. 保存文档String outputPath = "/Users/wtm/Desktop/output/three_charts_test_" + System.currentTimeMillis() + ".docx";try (FileOutputStream out = new FileOutputStream(outputPath)) {document.write(out);}System.out.println("\n✅ 三种图表测试完成:文档已保存到 " + outputPath);System.out.println("请检查文档中是否包含:");System.out.println("1. 柱状图表格(销售数据对比)");System.out.println("2. 饼图表格(市场份额分布)");System.out.println("3. 折线图表格(销售趋势分析)");}/*** 添加图表说明文字*/private static void addChartDescription(XWPFTableCell cell, String title, String... descriptions) {// 添加标题XWPFParagraph titleParagraph = cell.addParagraph();titleParagraph.setAlignment(org.apache.poi.xwpf.usermodel.ParagraphAlignment.LEFT);XWPFRun titleRun = titleParagraph.createRun();titleRun.setText(title);titleRun.setBold(true);titleRun.setFontSize(12);// 添加说明文字for (String description : descriptions) {XWPFParagraph descParagraph = cell.addParagraph();descParagraph.setAlignment(org.apache.poi.xwpf.usermodel.ParagraphAlignment.LEFT);XWPFRun descRun = descParagraph.createRun();descRun.setText(description);descRun.setFontSize(10);}}
}
工具类
TableChartUtil 表格图表工具类:用于在表格单元格中插入图表
package com.gemantic.gpt.util;import java.io.IOException;
import java.util.ArrayList;
import java.util.List;import org.apache.poi.openxml4j.exceptions.InvalidFormatException;
import org.apache.poi.util.Units;
import org.apache.poi.xddf.usermodel.XDDFColor;
import org.apache.poi.xddf.usermodel.XDDFLineProperties;
import org.apache.poi.xddf.usermodel.XDDFShapeProperties;
import org.apache.poi.xddf.usermodel.XDDFSolidFillProperties;
import org.apache.poi.xddf.usermodel.chart.AxisCrossBetween;
import org.apache.poi.xddf.usermodel.chart.AxisCrosses;
import org.apache.poi.xddf.usermodel.chart.AxisPosition;
import org.apache.poi.xddf.usermodel.chart.AxisTickLabelPosition;
import org.apache.poi.xddf.usermodel.chart.AxisTickMark;
import org.apache.poi.xddf.usermodel.chart.BarDirection;
import org.apache.poi.xddf.usermodel.chart.ChartTypes;
import org.apache.poi.xddf.usermodel.chart.LegendPosition;
import org.apache.poi.xddf.usermodel.chart.XDDFBarChartData;
import org.apache.poi.xddf.usermodel.chart.XDDFCategoryAxis;
import org.apache.poi.xddf.usermodel.chart.XDDFCategoryDataSource;
import org.apache.poi.xddf.usermodel.chart.XDDFChartData;
import org.apache.poi.xddf.usermodel.chart.XDDFChartLegend;
import org.apache.poi.xddf.usermodel.chart.XDDFDataSourcesFactory;
import org.apache.poi.xddf.usermodel.chart.XDDFLineChartData;
import org.apache.poi.xddf.usermodel.chart.XDDFNumericalDataSource;
import org.apache.poi.xddf.usermodel.chart.XDDFValueAxis;
import org.apache.poi.xddf.usermodel.chart.XDDFPieChartData;
import org.apache.poi.xwpf.usermodel.XWPFChart;
import org.apache.poi.xwpf.usermodel.XWPFDocument;
import org.apache.poi.xwpf.usermodel.XWPFParagraph;
import org.apache.poi.xwpf.usermodel.XWPFRun;
import org.apache.poi.xwpf.usermodel.XWPFTable;
import org.apache.xmlbeans.XmlToken;
import org.openxmlformats.schemas.drawingml.x2006.chart.CTBarSer;
import org.openxmlformats.schemas.drawingml.x2006.chart.CTDLbls;
import org.openxmlformats.schemas.drawingml.x2006.chart.CTLineSer;
import org.openxmlformats.schemas.drawingml.x2006.main.CTNonVisualDrawingProps;
import org.openxmlformats.schemas.drawingml.x2006.main.CTPositiveSize2D;
import org.openxmlformats.schemas.drawingml.x2006.wordprocessingDrawing.CTInline;
import org.slf4j.Logger;
import org.slf4j.LoggerFactory;import com.fasterxml.jackson.databind.JsonNode;
import org.apache.poi.xwpf.usermodel.IBodyElement;/*** 表格图表工具类:用于在表格单元格中插入图表* 按照ChartInTableExample的正确顺序实现*/
public class TableChartUtil {private static final Logger LOG = LoggerFactory.getLogger(TableChartUtil.class);/*** 处理柱状图和折线图*/public static void handleChart(XWPFParagraph cellParagraph, JsonNode valueNode, JsonNode chartConfig, int dpi, boolean showLock, int width, int height) {try {// 检查是否已经在表格单元格中if (cellParagraph == null) {LOG.warn("单元格段落为空,跳过图表创建");return;}XWPFDocument document = cellParagraph.getDocument();// 记录创建图表前的状态int chartsBefore = document.getCharts().size();LOG.info("创建图表前的图表数量: {}", chartsBefore);XWPFRun run = cellParagraph.createRun();CTInline inline = run.getCTR().addNewDrawing().addNewInline();int widthEMU = (int) (width * Units.EMU_PER_PIXEL);int heightEMU = (int) (height * Units.EMU_PER_PIXEL);// 1. 先创建图表并渲染数据XWPFChart chart = createChartInCell(document, chartConfig, widthEMU, heightEMU);// 记录创建图表后的状态int chartsAfter = document.getCharts().size();LOG.info("创建图表后的图表数量: {}", chartsAfter);// 2. 获取图表关系ID并嵌入inlineString chartRelId = document.getRelationId(chart);String chartXml ="<a:graphic xmlns:a=\"http://schemas.openxmlformats.org/drawingml/2006/main\">" +"<a:graphicData uri=\"http://schemas.openxmlformats.org/drawingml/2006/chart\">" +"<c:chart xmlns:c=\"http://schemas.openxmlformats.org/drawingml/2006/chart\" " +"xmlns:r=\"http://schemas.openxmlformats.org/officeDocument/2006/relationships\" r:id=\"" + chartRelId + "\"/>" +"</a:graphicData>" +"</a:graphic>";XmlToken xmlToken = XmlToken.Factory.parse(chartXml);inline.set(xmlToken);// 3. 最后设置inline属性,确保图表完全限制在单元格内inline.setDistT(0);inline.setDistB(0);inline.setDistL(0);inline.setDistR(0);CTPositiveSize2D extent = inline.addNewExtent();extent.setCx(widthEMU);extent.setCy(heightEMU);CTNonVisualDrawingProps docPr = inline.addNewDocPr();docPr.setId(1);docPr.setName("ChartInTable");// 4. 处理图表的权限标记if (showLock && valueNode.has("unlock") && valueNode.get("unlock").asBoolean()) {// 为图表添加权限保护XWPFParagraph lastParagraph = cellParagraph;if (lastParagraph != null && !lastParagraph.getRuns().isEmpty()) {XWPFRun lastRun = run;SnowflakeIdGenerator generator = new SnowflakeIdGenerator(1);String uniqueId = generator.nextId();WordUtils.insertPermissionNodes(lastParagraph, lastRun, uniqueId);LOG.info("为表格中的饼图添加权限保护,ID: {}", uniqueId);}}// 5. 轻量级清理:只清理表格后的重复空段落,不删除表格前的内容TableChartCleanupUtil.cleanupTableAfterCharts(document);} catch (Exception e) {LOG.error("处理图表时发生错误: " + e.getMessage(), e);}}/*** 处理饼图*/public static void handlePieChart(XWPFParagraph cellParagraph, JsonNode valueNode, JsonNode chartConfig, int dpi, boolean showLock, int width, int height) {try {// 检查是否已经在表格单元格中if (cellParagraph == null) {LOG.warn("单元格段落为空,跳过饼图创建");return;}XWPFDocument document = cellParagraph.getDocument();XWPFRun run = cellParagraph.createRun();CTInline inline = run.getCTR().addNewDrawing().addNewInline();int widthEMU = (int) (width * Units.EMU_PER_PIXEL);int heightEMU = (int) (height * Units.EMU_PER_PIXEL);// 1. 先创建饼图并渲染数据XWPFChart chart = createPieChartInCell(document, chartConfig, widthEMU, heightEMU);// 2. 获取图表关系ID并嵌入inlineString chartRelId = document.getRelationId(chart);String chartXml ="<a:graphic xmlns:a=\"http://schemas.openxmlformats.org/drawingml/2006/main\">" +"<a:graphicData uri=\"http://schemas.openxmlformats.org/drawingml/2006/chart\">" +"<c:chart xmlns:c=\"http://schemas.openxmlformats.org/drawingml/2006/chart\" " +"xmlns:r=\"http://schemas.openxmlformats.org/officeDocument/2006/relationships\" r:id=\"" + chartRelId + "\"/>" +"</a:graphicData>" +"</a:graphic>";XmlToken xmlToken = XmlToken.Factory.parse(chartXml);inline.set(xmlToken);// 3. 最后设置inline属性,确保图表完全限制在单元格内inline.setDistT(0);inline.setDistB(0);inline.setDistL(0);inline.setDistR(0);CTPositiveSize2D extent = inline.addNewExtent();extent.setCx(widthEMU);extent.setCy(heightEMU);CTNonVisualDrawingProps docPr = inline.addNewDocPr();docPr.setId(1);docPr.setName("PieChartInTable");// 4. 处理图表的权限标记if (showLock && valueNode.has("unlock") && valueNode.get("unlock").asBoolean()) {// 为图表添加权限保护XWPFParagraph lastParagraph = cellParagraph;if (lastParagraph != null && !lastParagraph.getRuns().isEmpty()) {XWPFRun lastRun = run;SnowflakeIdGenerator generator = new SnowflakeIdGenerator(1);String uniqueId = generator.nextId();WordUtils.insertPermissionNodes(lastParagraph, lastRun, uniqueId);LOG.info("为表格中的饼图添加权限保护,ID: {}", uniqueId);}}// 5. 轻量级清理:只清理表格后的重复空段落,不删除表格前的内容TableChartCleanupUtil.cleanupTableAfterCharts(document);} catch (Exception e) {LOG.error("处理饼图时发生错误: " + e.getMessage(), e);}}/*** 在单元格中创建并渲染柱状图/折线图*/private static XWPFChart createChartInCell(XWPFDocument document, JsonNode chartConfig, int widthEMU, int heightEMU) throws IOException, InvalidFormatException {// 创建图表XWPFChart chart = document.createChart(widthEMU, heightEMU);// 解析基本配置String chartType = chartConfig.get("type").asText();String title = chartConfig.get("title").asText();String xAxisTitle = chartConfig.has("xAxisTitle") ? chartConfig.get("xAxisTitle").asText() : "";String yAxisTitle = chartConfig.has("yAxisTitle") ? chartConfig.get("yAxisTitle").asText() : "";boolean showTitle = chartConfig.has("showTitle") ? chartConfig.get("showTitle").asBoolean() : true;boolean showGrid = chartConfig.has("showGrid") ? chartConfig.get("showGrid").asBoolean() : true;boolean showLegend = chartConfig.has("showLegend") ? chartConfig.get("showLegend").asBoolean() : true;boolean showDataLabel = chartConfig.has("showDataLabel") ? chartConfig.get("showDataLabel").asBoolean() : false;boolean showAxisLabel = chartConfig.has("showAxisLabel") ? chartConfig.get("showAxisLabel").asBoolean() : true;boolean showAxis = chartConfig.has("showAxis") ? chartConfig.get("showAxis").asBoolean() : true;// 解析图例JsonNode legendNode = chartConfig.get("legend");List<String> legends = new ArrayList<>();for (JsonNode legend : legendNode) {legends.add(legend.asText());}// 解析颜色List<String> colors = new ArrayList<>();JsonNode colorsNode = chartConfig.get("colors");if (colorsNode != null) {for (JsonNode color : colorsNode) {colors.add(color.asText());}}// 解析数据JsonNode valueNode = chartConfig.get("valueList");List<String> categories = new ArrayList<>();List<List<Double>> seriesData = new ArrayList<>();// 初始化系列数据列表for (int i = 0; i < legends.size(); i++) {seriesData.add(new ArrayList<>());}// 解析每个数据点for (JsonNode dataPoint : valueNode) {String name = dataPoint.get("name").asText();categories.add(name);JsonNode values = dataPoint.get("value");for (int i = 0; i < values.size() && i < legends.size(); i++) {seriesData.get(i).add(values.get(i).asDouble());}}// 转换为数组String[] categoryArray = categories.toArray(new String[0]);List<Double[]> seriesArrays = new ArrayList<>();for (List<Double> series : seriesData) {seriesArrays.add(series.toArray(new Double[0]));}// 创建图表ChartTypes poiChartType = "chart_bar".equals(chartType) ? ChartTypes.BAR : ChartTypes.LINE;renderChartData(chart, title, poiChartType, categoryArray, seriesArrays, legends, colors,xAxisTitle, yAxisTitle, "chart_bar".equals(chartType), showGrid, showDataLabel,showTitle, showLegend, showAxis, showAxisLabel);return chart;}/*** 在单元格中创建并渲染饼图*/private static XWPFChart createPieChartInCell(XWPFDocument document, JsonNode chartConfig, int widthEMU, int heightEMU) throws IOException, InvalidFormatException {// 创建图表XWPFChart chart = document.createChart(widthEMU, heightEMU);// 解析基本配置String title = chartConfig.get("title").asText();boolean showTitle = chartConfig.has("showTitle") ? chartConfig.get("showTitle").asBoolean() : true;boolean showLegend = chartConfig.has("showLegend") ? chartConfig.get("showLegend").asBoolean() : true;boolean showDataLabel = chartConfig.has("showDataLabel") ? chartConfig.get("showDataLabel").asBoolean() : false;// 解析颜色配置List<String> colors = new ArrayList<>();JsonNode colorsNode = chartConfig.get("colors");if (colorsNode != null) {for (JsonNode color : colorsNode) {colors.add(color.asText());}}// 解析饼图数据JsonNode valueNode = chartConfig.has("valueList") ? chartConfig.get("valueList") : chartConfig.get("value");List<String> categories = new ArrayList<>();List<Double> values = new ArrayList<>();// 解析每个数据点,如果有多个值则取第一个,过滤掉null或无效值for (JsonNode dataPoint : valueNode) {String name = dataPoint.get("name").asText();JsonNode valueArray = dataPoint.get("value");Double validValue = null;if (valueArray.isArray() && valueArray.size() > 0) {// 遍历值数组,找到第一个有效的非null数值for (int i = 0; i < valueArray.size(); i++) {JsonNode valueNode2 = valueArray.get(i);if (!valueNode2.isNull() && valueNode2.isNumber()) {double val = valueNode2.asDouble();// 只接受大于0的有效值(饼图不能有负值或0值)if (val > 0) {validValue = val;break;}}}}// 只添加有有效值的数据点到饼图中if (validValue != null) {categories.add(name);values.add(validValue);}}// 转换为数组String[] categoryArray = categories.toArray(new String[0]);Double[] valueArray = values.toArray(new Double[0]);// 渲染饼图数据renderPieChartData(chart, title, categoryArray, valueArray, colors,showDataLabel, showTitle, showLegend);return chart;}/*** 渲染柱状图/折线图数据*/private static void renderChartData(XWPFChart chart,String chartTitle,ChartTypes chartType,String[] categories,List<Double[]> seriesDataList,List<String> legends,List<String> colors,String xAxisTitle,String yAxisTitle,boolean isBarChart,boolean showGridlines,boolean showDataLabels,boolean showTitle,boolean showLegend,boolean showAxis,boolean showAxisLabel) throws IOException, InvalidFormatException {// 填充嵌入的Excel数据populateEmbeddedExcelData(chart, categories, seriesDataList, legends);// 设置图表标题if (showTitle) {chart.setTitleText(chartTitle);chart.setTitleOverlay(false);} else {chart.setTitleText("");chart.setTitleOverlay(true);}// 设置图例if (showLegend) {XDDFChartLegend legend = chart.getOrAddLegend();legend.setPosition(LegendPosition.BOTTOM);} else {if (chart.getCTChart().isSetLegend()) {chart.getCTChart().unsetLegend();}}// 设置X轴XDDFCategoryAxis bottomAxis = chart.createCategoryAxis(AxisPosition.BOTTOM);if (showAxisLabel) {bottomAxis.setTitle(xAxisTitle);}if (showAxis) {bottomAxis.setMajorTickMark(AxisTickMark.OUT);} else {bottomAxis.setMajorTickMark(AxisTickMark.NONE);bottomAxis.setVisible(false);}bottomAxis.setTickLabelPosition(AxisTickLabelPosition.LOW);bottomAxis.setMajorUnit(1.0);// 设置Y轴XDDFValueAxis leftAxis = chart.createValueAxis(AxisPosition.LEFT);if (showAxisLabel) {leftAxis.setTitle(yAxisTitle);}if (!showAxis) {leftAxis.setVisible(false);}leftAxis.setCrosses(AxisCrosses.AUTO_ZERO);leftAxis.setMinimum(0.0);try {leftAxis.setCrossBetween(AxisCrossBetween.BETWEEN);} catch (Exception e) {LOG.warn("警告:无法设置Y轴交叉位置:{}", e.getMessage());}// 设置网格线XDDFShapeProperties major = leftAxis.getOrAddMajorGridProperties();XDDFShapeProperties minor = leftAxis.getOrAddMinorGridProperties();if (showGridlines) {major.setLineProperties(new XDDFLineProperties(new XDDFSolidFillProperties(XDDFColor.from(new byte[]{(byte) 200, (byte) 200, (byte) 200}))));minor.setLineProperties(new XDDFLineProperties(new XDDFSolidFillProperties(XDDFColor.from(new byte[]{(byte) 240, (byte) 240, (byte) 240}))));} else {major.setLineProperties(new XDDFLineProperties(new XDDFSolidFillProperties(XDDFColor.from(new byte[]{(byte) 255, (byte) 255, (byte) 255}))));minor.setLineProperties(new XDDFLineProperties(new XDDFSolidFillProperties(XDDFColor.from(new byte[]{(byte) 255, (byte) 255, (byte) 255}))));}// 使用Excel工作表数据作为数据源XDDFCategoryDataSource categoryDataSource = createCategoryDataSourceFromExcel(chart, categories.length);// 构建图表数据XDDFChartData data = chart.createData(chartType, bottomAxis, leftAxis);// 设置柱子方向和间隙(只对柱状图生效)if (isBarChart) {XDDFBarChartData barData = (XDDFBarChartData) data;barData.setBarDirection(BarDirection.COL);barData.setGapWidth(150);barData.setOverlap((byte) -10);}// 动态添加所有系列for (int i = 0; i < seriesDataList.size() && i < legends.size(); i++) {XDDFNumericalDataSource<Double> seriesDataSource = createNumericalDataSourceFromExcel(chart, i + 1, categories.length);XDDFChartData.Series series = data.addSeries(categoryDataSource, seriesDataSource);series.setTitle(legends.get(i), null);setGenericDataLabels(series, chartType, showDataLabels, seriesDataList.get(i));// 设置系列颜色if (colors != null && !colors.isEmpty()) {String color = colors.get(i % colors.size());setSeriesColor(series, chartType, color);}}// 绘制图表chart.plot(data);}/*** 渲染饼图数据*/private static void renderPieChartData(XWPFChart chart,String chartTitle,String[] categories,Double[] values,List<String> colors,boolean showDataLabels,boolean showTitle,boolean showLegend) throws IOException, InvalidFormatException {// 填充嵌入的Excel数据populateEmbeddedExcelDataForPie(chart, categories, values);// 设置图表标题if (showTitle) {chart.setTitleText(chartTitle);chart.setTitleOverlay(false);} else {chart.setTitleText("");chart.setTitleOverlay(true);}// 设置图例if (showLegend) {XDDFChartLegend legend = chart.getOrAddLegend();legend.setPosition(LegendPosition.BOTTOM);} else {if (chart.getCTChart().isSetLegend()) {chart.getCTChart().unsetLegend();}}// 使用Excel工作表数据作为数据源XDDFCategoryDataSource categoryDataSource = createCategoryDataSourceFromExcelForPie(chart, categories.length);XDDFNumericalDataSource<Double> valuesDataSource = createNumericalDataSourceFromExcelForPie(chart, categories.length);// 创建饼图数据XDDFPieChartData data = (XDDFPieChartData) chart.createData(ChartTypes.PIE, null, null);// 添加饼图系列XDDFPieChartData.Series series = (XDDFPieChartData.Series) data.addSeries(categoryDataSource, valuesDataSource);series.setTitle("饼图数据", null);// 设置数据标签setPieDataLabels(series, showDataLabels, values);// 设置饼图扇形颜色setPieSeriesColors(series, colors, categories.length);// 绘制图表chart.plot(data);}// 以下是复用MixedChartRendererUtil和PieChartRendererUtil中的辅助方法private static void populateEmbeddedExcelData(XWPFChart chart, String[] categories, List<Double[]> seriesDataList, List<String> legends) {try {if (chart.getWorkbook() != null) {org.apache.poi.ss.usermodel.Workbook workbook = chart.getWorkbook();org.apache.poi.ss.usermodel.Sheet sheet = workbook.getNumberOfSheets() > 0 ?workbook.getSheetAt(0) : workbook.createSheet("ChartData");if (workbook.getNumberOfSheets() > 0) {workbook.setSheetName(0, "ChartData");}// 清空现有数据for (int i = sheet.getLastRowNum(); i >= 0; i--) {org.apache.poi.ss.usermodel.Row row = sheet.getRow(i);if (row != null) {sheet.removeRow(row);}}// 创建表头行org.apache.poi.ss.usermodel.Row headerRow = sheet.createRow(0);headerRow.createCell(0).setCellValue("");for (int i = 0; i < legends.size() && i < seriesDataList.size(); i++) {headerRow.createCell(i + 1).setCellValue(legends.get(i));}// 填充数据行for (int rowIndex = 0; rowIndex < categories.length; rowIndex++) {org.apache.poi.ss.usermodel.Row dataRow = sheet.createRow(rowIndex + 1);dataRow.createCell(0).setCellValue(categories[rowIndex]);for (int seriesIndex = 0; seriesIndex < seriesDataList.size() && seriesIndex < legends.size(); seriesIndex++) {Double[] seriesData = seriesDataList.get(seriesIndex);if (rowIndex < seriesData.length && seriesData[rowIndex] != null) {dataRow.createCell(seriesIndex + 1).setCellValue(seriesData[rowIndex]);} else {dataRow.createCell(seriesIndex + 1).setCellValue(0.0);}}}// 自动调整列宽for (int i = 0; i <= legends.size(); i++) {sheet.autoSizeColumn(i);}org.apache.poi.ss.usermodel.Name dataRange = workbook.createName();dataRange.setNameName("ChartDataRange");String rangeFormula = "ChartData!$A$1:$" +(char) ('A' + legends.size()) + "$" + (categories.length + 1);dataRange.setRefersToFormula(rangeFormula);}} catch (Exception e) {LOG.warn("警告:填充嵌入Excel数据时出错:{}", e.getMessage());}}private static void populateEmbeddedExcelDataForPie(XWPFChart chart, String[] categories, Double[] values) {try {if (chart.getWorkbook() != null) {org.apache.poi.ss.usermodel.Workbook workbook = chart.getWorkbook();org.apache.poi.ss.usermodel.Sheet sheet = workbook.getNumberOfSheets() > 0 ?workbook.getSheetAt(0) : workbook.createSheet("PieChartData");if (workbook.getNumberOfSheets() > 0) {workbook.setSheetName(0, "PieChartData");}// 清空现有数据for (int i = sheet.getLastRowNum(); i >= 0; i--) {org.apache.poi.ss.usermodel.Row row = sheet.getRow(i);if (row != null) {sheet.removeRow(row);}}// 创建表头行org.apache.poi.ss.usermodel.Row headerRow = sheet.createRow(0);headerRow.createCell(0).setCellValue("分类");headerRow.createCell(1).setCellValue("数值");// 填充数据行for (int i = 0; i < categories.length && i < values.length; i++) {org.apache.poi.ss.usermodel.Row dataRow = sheet.createRow(i + 1);dataRow.createCell(0).setCellValue(categories[i]);dataRow.createCell(1).setCellValue(values[i] != null ? values[i] : 0.0);}// 自动调整列宽sheet.autoSizeColumn(0);sheet.autoSizeColumn(1);org.apache.poi.ss.usermodel.Name dataRange = workbook.createName();dataRange.setNameName("PieChartDataRange");String rangeFormula = "PieChartData!$A$1:$B$" + (categories.length + 1);dataRange.setRefersToFormula(rangeFormula);}} catch (Exception e) {LOG.warn("警告:填充饼图嵌入Excel数据时出错:{}", e.getMessage());}}private static XDDFCategoryDataSource createCategoryDataSourceFromExcel(XWPFChart chart, int categoryCount) {try {return XDDFDataSourcesFactory.fromStringCellRange(chart.getWorkbook().getSheetAt(0),new org.apache.poi.ss.util.CellRangeAddress(1, categoryCount, 0, 0));} catch (Exception e) {LOG.warn("警告:无法创建Excel分类数据源,使用默认数据源:{}", e.getMessage());String[] defaultCategories = new String[categoryCount];for (int i = 0; i < categoryCount; i++) {defaultCategories[i] = "类别" + (i + 1);}return XDDFDataSourcesFactory.fromArray(defaultCategories);}}private static XDDFNumericalDataSource<Double> createNumericalDataSourceFromExcel(XWPFChart chart, int columnIndex, int dataCount) {try {return XDDFDataSourcesFactory.fromNumericCellRange(chart.getWorkbook().getSheetAt(0),new org.apache.poi.ss.util.CellRangeAddress(1, dataCount, columnIndex, columnIndex));} catch (Exception e) {LOG.warn("警告:无法创建Excel数值数据源,使用默认数据源:{}", e.getMessage());Double[] defaultData = new Double[dataCount];for (int i = 0; i < dataCount; i++) {defaultData[i] = (double) (i + 1) * 10;}return XDDFDataSourcesFactory.fromArray(defaultData);}}private static XDDFCategoryDataSource createCategoryDataSourceFromExcelForPie(XWPFChart chart, int categoryCount) {try {return XDDFDataSourcesFactory.fromStringCellRange(chart.getWorkbook().getSheetAt(0),new org.apache.poi.ss.util.CellRangeAddress(1, categoryCount, 0, 0));} catch (Exception e) {LOG.warn("警告:无法创建饼图Excel分类数据源,使用默认数据源:{}", e.getMessage());String[] defaultCategories = new String[categoryCount];for (int i = 0; i < categoryCount; i++) {defaultCategories[i] = "分类" + (i + 1);}return XDDFDataSourcesFactory.fromArray(defaultCategories);}}private static XDDFNumericalDataSource<Double> createNumericalDataSourceFromExcelForPie(XWPFChart chart, int dataCount) {try {return XDDFDataSourcesFactory.fromNumericCellRange(chart.getWorkbook().getSheetAt(0),new org.apache.poi.ss.util.CellRangeAddress(1, dataCount, 1, 1));} catch (Exception e) {LOG.warn("警告:无法创建饼图Excel数值数据源,使用默认数据源:{}", e.getMessage());Double[] defaultData = new Double[dataCount];for (int i = 0; i < dataCount; i++) {defaultData[i] = (double) (i + 1) * 10;}return XDDFDataSourcesFactory.fromArray(defaultData);}}private static void setGenericDataLabels(XDDFChartData.Series series, ChartTypes chartType, boolean showDataLabels, Double[] data) {if (!showDataLabels) {if (chartType == ChartTypes.BAR) {CTBarSer ctSer = ((XDDFBarChartData.Series) series).getCTBarSer();if (ctSer.isSetDLbls()) ctSer.unsetDLbls();} else if (chartType == ChartTypes.LINE) {CTLineSer ctSer = ((XDDFLineChartData.Series) series).getCTLineSer();if (ctSer.isSetDLbls()) ctSer.unsetDLbls();}return;}if (chartType == ChartTypes.BAR) {CTBarSer ctSer = ((XDDFBarChartData.Series) series).getCTBarSer();CTDLbls dLbls = ctSer.isSetDLbls() ? ctSer.getDLbls() : ctSer.addNewDLbls();dLbls.setDLblArray(null);dLbls.addNewShowVal().setVal(true);dLbls.addNewShowLegendKey().setVal(false);dLbls.addNewShowCatName().setVal(false);dLbls.addNewShowSerName().setVal(false);dLbls.addNewShowPercent().setVal(false);dLbls.addNewDLblPos().setVal(org.openxmlformats.schemas.drawingml.x2006.chart.STDLblPos.OUT_END);for (int i = 0; i < data.length; i++) {if (data[i] != null) {org.openxmlformats.schemas.drawingml.x2006.chart.CTDLbl lbl = dLbls.addNewDLbl();lbl.addNewIdx().setVal(i);lbl.addNewShowVal().setVal(true);lbl.addNewShowLegendKey().setVal(false);lbl.addNewShowCatName().setVal(false);lbl.addNewShowSerName().setVal(false);lbl.addNewShowPercent().setVal(false);lbl.addNewDLblPos().setVal(org.openxmlformats.schemas.drawingml.x2006.chart.STDLblPos.OUT_END);}}} else if (chartType == ChartTypes.LINE) {CTLineSer ctSer = ((XDDFLineChartData.Series) series).getCTLineSer();CTDLbls dLbls = ctSer.isSetDLbls() ? ctSer.getDLbls() : ctSer.addNewDLbls();dLbls.setDLblArray(null);dLbls.addNewShowVal().setVal(true);dLbls.addNewShowLegendKey().setVal(false);dLbls.addNewShowCatName().setVal(false);dLbls.addNewShowSerName().setVal(false);dLbls.addNewShowPercent().setVal(false);dLbls.addNewDLblPos().setVal(org.openxmlformats.schemas.drawingml.x2006.chart.STDLblPos.T);for (int i = 0; i < data.length; i++) {if (data[i] != null) {org.openxmlformats.schemas.drawingml.x2006.chart.CTDLbl lbl = dLbls.addNewDLbl();lbl.addNewIdx().setVal(i);lbl.addNewShowVal().setVal(true);lbl.addNewShowLegendKey().setVal(false);lbl.addNewShowCatName().setVal(false);lbl.addNewShowSerName().setVal(false);lbl.addNewShowPercent().setVal(false);lbl.addNewDLblPos().setVal(org.openxmlformats.schemas.drawingml.x2006.chart.STDLblPos.T);}}}}private static void setSeriesColor(XDDFChartData.Series series, ChartTypes chartType, String colorHex) {try {String hex = colorHex.startsWith("#") ? colorHex.substring(1) : colorHex;int r = Integer.parseInt(hex.substring(0, 2), 16);int g = Integer.parseInt(hex.substring(2, 4), 16);int b = Integer.parseInt(hex.substring(4, 6), 16);XDDFColor xddfColor = XDDFColor.from(new byte[]{(byte) r, (byte) g, (byte) b});XDDFSolidFillProperties fillProperties = new XDDFSolidFillProperties(xddfColor);if (chartType == ChartTypes.BAR && series instanceof XDDFBarChartData.Series) {XDDFBarChartData.Series barSeries = (XDDFBarChartData.Series) series;XDDFShapeProperties shapeProperties = new XDDFShapeProperties();shapeProperties.setFillProperties(fillProperties);barSeries.setShapeProperties(shapeProperties);} else if (chartType == ChartTypes.LINE && series instanceof XDDFLineChartData.Series) {XDDFLineChartData.Series lineSeries = (XDDFLineChartData.Series) series;XDDFShapeProperties shapeProperties = new XDDFShapeProperties();XDDFLineProperties lineProperties = new XDDFLineProperties();lineProperties.setFillProperties(fillProperties);shapeProperties.setLineProperties(lineProperties);lineSeries.setShapeProperties(shapeProperties);shapeProperties.setFillProperties(fillProperties);}} catch (Exception e) {LOG.warn("警告:无法解析颜色 {},将使用默认颜色。错误:{}", colorHex, e.getMessage());}}private static void setPieDataLabels(XDDFPieChartData.Series series, boolean showDataLabels, Double[] values) {if (!showDataLabels) {org.openxmlformats.schemas.drawingml.x2006.chart.CTPieSer ctSer = series.getCTPieSer();if (ctSer.isSetDLbls()) {ctSer.unsetDLbls();}return;}try {org.openxmlformats.schemas.drawingml.x2006.chart.CTPieSer ctSer = series.getCTPieSer();CTDLbls dLbls = ctSer.isSetDLbls() ? ctSer.getDLbls() : ctSer.addNewDLbls();dLbls.setDLblArray(null);dLbls.addNewShowVal().setVal(true);dLbls.addNewShowLegendKey().setVal(false);dLbls.addNewShowCatName().setVal(false);dLbls.addNewShowSerName().setVal(false);dLbls.addNewShowPercent().setVal(false);dLbls.addNewShowLeaderLines().setVal(true);for (int i = 0; i < values.length; i++) {if (values[i] != null && values[i] > 0) {org.openxmlformats.schemas.drawingml.x2006.chart.CTDLbl lbl = dLbls.addNewDLbl();lbl.addNewIdx().setVal(i);lbl.addNewShowVal().setVal(true);lbl.addNewShowLegendKey().setVal(false);lbl.addNewShowCatName().setVal(false);lbl.addNewShowSerName().setVal(false);lbl.addNewShowPercent().setVal(false);}}} catch (Exception e) {LOG.warn("警告:设置饼图数据标签时出错:{}", e.getMessage());}}private static void setPieSeriesColors(XDDFPieChartData.Series series, List<String> colors, int pointCount) {if (colors == null || colors.isEmpty()) {LOG.warn("未提供颜色配置,将使用默认颜色");return;}try {for (int i = 0; i < pointCount; i++) {String colorHex = colors.get(i % colors.size());setPieSliceColor(series, i, colorHex);}} catch (Exception e) {LOG.warn("警告:设置饼图颜色时出错:{}", e.getMessage());}}private static void setPieSliceColor(XDDFPieChartData.Series series, int pointIndex, String colorHex) {try {String hex = colorHex.startsWith("#") ? colorHex.substring(1) : colorHex;int r = Integer.parseInt(hex.substring(0, 2), 16);int g = Integer.parseInt(hex.substring(2, 4), 16);int b = Integer.parseInt(hex.substring(4, 6), 16);org.openxmlformats.schemas.drawingml.x2006.chart.CTPieSer ctSer = series.getCTPieSer();if (ctSer.getDPtArray().length <= pointIndex) {while (ctSer.getDPtArray().length <= pointIndex) {org.openxmlformats.schemas.drawingml.x2006.chart.CTDPt dPt = ctSer.addNewDPt();dPt.addNewIdx().setVal(ctSer.getDPtArray().length - 1);}}org.openxmlformats.schemas.drawingml.x2006.chart.CTDPt dPt = ctSer.getDPtArray(pointIndex);if (dPt == null) {dPt = ctSer.addNewDPt();dPt.addNewIdx().setVal(pointIndex);}if (!dPt.isSetSpPr()) {dPt.addNewSpPr();}if (!dPt.getSpPr().isSetSolidFill()) {dPt.getSpPr().addNewSolidFill();}if (!dPt.getSpPr().getSolidFill().isSetSrgbClr()) {dPt.getSpPr().getSolidFill().addNewSrgbClr();}dPt.getSpPr().getSolidFill().getSrgbClr().setVal(new byte[]{(byte) r, (byte) g, (byte) b});} catch (Exception e) {LOG.warn("警告:无法解析颜色 {} 用于数据点 {},将使用默认颜色。错误:{}", colorHex, pointIndex, e.getMessage());}}/*** 轻量级清理:只清理表格后的重复空段落和重复图表,不删除表格前的内容*/private static void cleanupTableAfterEmptyParagraphs(XWPFDocument document) {try {List<IBodyElement> bodyElements = document.getBodyElements();int tableIndex = -1;for (int i = 0; i < bodyElements.size(); i++) {if (bodyElements.get(i) instanceof XWPFTable) {tableIndex = i;break;}}if (tableIndex != -1) {// 从后往前遍历,确保删除表格后的空段落和重复图表for (int i = bodyElements.size() - 1; i > tableIndex; i--) {IBodyElement element = bodyElements.get(i);if (element instanceof XWPFParagraph) {XWPFParagraph p = (XWPFParagraph) element;String text = p.getText().trim();// 检查段落是否包含图表boolean hasChart = false;for (XWPFRun run : p.getRuns()) {if (run.getEmbeddedPictures() != null && !run.getEmbeddedPictures().isEmpty()) {hasChart = true;break;}// 检查是否有图表相关的XML内容if (run.getCTR().getDrawingList() != null && !run.getCTR().getDrawingList().isEmpty()) {hasChart = true;break;}}// 删除条件:// 1. 完全空的段落// 2. 包含图表但文本为空的段落(可能是重复的图表)if ((text.isEmpty() && p.getRuns().isEmpty()) || (hasChart && text.isEmpty())) {LOG.info("删除表格后的段落,索引: {},包含图表: {},文本: '{}'", i, hasChart, text);document.removeBodyElement(i);}}}}} catch (Exception e) {LOG.warn("轻量级清理表格后的空段落时发生错误: " + e.getMessage());}}
}
TableChartCleanupUtil 表格图表清理工具类:专门用于清理表格后的重复图表,而不影响表格外的正常图表
package com.gemantic.gpt.util;import java.util.ArrayList;
import java.util.List;import org.apache.poi.xwpf.usermodel.IBodyElement;
import org.apache.poi.xwpf.usermodel.XWPFDocument;
import org.apache.poi.xwpf.usermodel.XWPFParagraph;
import org.apache.poi.xwpf.usermodel.XWPFRun;
import org.apache.poi.xwpf.usermodel.XWPFTable;
import org.slf4j.Logger;
import org.slf4j.LoggerFactory;/*** 表格图表清理工具类:专门用于清理表格后的重复图表,而不影响表格外的正常图表* * @Description: 解决TableChartUtil中cleanupTableAfterEmptyParagraphs方法过度清理的问题* @Auther: Wangtianming* @Date: 2024/12/19*/
public class TableChartCleanupUtil {private static final Logger LOG = LoggerFactory.getLogger(TableChartCleanupUtil.class);/*** 智能清理表格后的重复图表* 只删除紧跟在表格后面的重复图表,不影响表格外的正常图表* * @param document Word文档对象*/public static void cleanupTableAfterCharts(XWPFDocument document) {try {List<IBodyElement> bodyElements = document.getBodyElements();// 找到所有表格的位置List<Integer> tableIndices = new ArrayList<>();for (int i = 0; i < bodyElements.size(); i++) {if (bodyElements.get(i) instanceof XWPFTable) {tableIndices.add(i);}}if (tableIndices.isEmpty()) {return; // 没有表格,无需清理}// 从后往前遍历,只清理表格后的重复图表for (int i = bodyElements.size() - 1; i >= 0; i--) {IBodyElement element = bodyElements.get(i);// 只处理段落元素if (!(element instanceof XWPFParagraph)) {continue;}XWPFParagraph p = (XWPFParagraph) element;String text = p.getText().trim();// 检查段落是否包含图表boolean hasChart = isParagraphContainsChart(p);// 检查这个段落是否紧跟在表格后面boolean isAfterTable = isParagraphAfterTable(i, tableIndices);// 删除条件:// 1. 段落紧跟在表格后面// 2. 段落包含图表// 3. 段落文本为空// 4. 段落只包含图表,没有其他内容if (isAfterTable && hasChart && text.isEmpty() && isParagraphOnlyContainsChart(p)) {LOG.info("删除表格后的重复图表段落,索引: {},文本: '{}'", i, text);document.removeBodyElement(i);}}} catch (Exception e) {LOG.warn("清理表格后的重复图表时发生错误: " + e.getMessage());}}/*** 检查段落是否包含图表*/private static boolean isParagraphContainsChart(XWPFParagraph paragraph) {if (paragraph == null || paragraph.getRuns().isEmpty()) {return false;}for (XWPFRun run : paragraph.getRuns()) {// 检查是否有嵌入的图片if (run.getEmbeddedPictures() != null && !run.getEmbeddedPictures().isEmpty()) {return true;}// 检查是否有图表相关的XML内容if (run.getCTR().getDrawingList() != null && !run.getCTR().getDrawingList().isEmpty()) {return true;}// 检查是否有图表关系if (run.getCTR().getDrawingList() != null) {for (org.openxmlformats.schemas.wordprocessingml.x2006.main.CTDrawing drawing : run.getCTR().getDrawingList()) {if (drawing.getInlineList() != null && !drawing.getInlineList().isEmpty()) {return true;}}}}return false;}/*** 检查段落是否只包含图表,没有其他文本内容*/private static boolean isParagraphOnlyContainsChart(XWPFParagraph paragraph) {if (paragraph == null) {return false;}String text = paragraph.getText().trim();boolean hasChart = isParagraphContainsChart(paragraph);// 如果段落有图表但没有文本内容,则认为只包含图表return hasChart && text.isEmpty();}/*** 检查段落是否紧跟在表格后面*/private static boolean isParagraphAfterTable(int paragraphIndex, List<Integer> tableIndices) {// 找到段落前面的最近表格int nearestTableIndex = -1;for (int tableIndex : tableIndices) {if (tableIndex < paragraphIndex && tableIndex > nearestTableIndex) {nearestTableIndex = tableIndex;}}// 如果段落紧跟在表格后面(索引相差1),则认为是表格后的段落return nearestTableIndex != -1 && (paragraphIndex - nearestTableIndex) == 1;}
}