Openlayers基础教程|从前端框架到GIS开发系列课程(21)geojson实现线要素和区要素
设置线要素
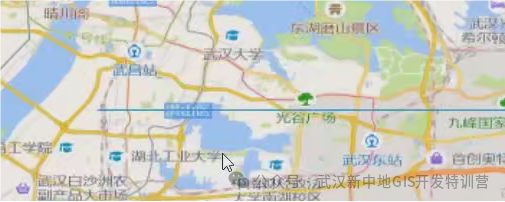
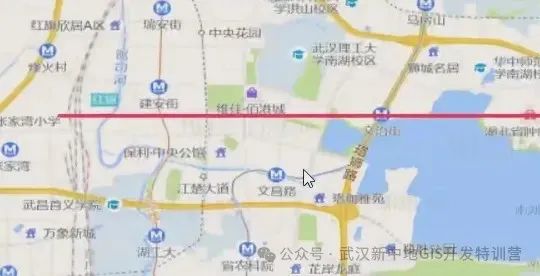
本篇教程我们将学习如何利用geojson实现线要素。实现效果如下图:
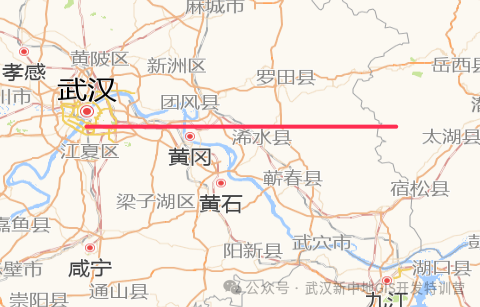
1.1. 实现步骤:
1.1.1. 设置线要素的geojson数据
var data = {type: "FeatureCollection", // 定义这是一个要素集合features: [ // 要素集合中的要素数组{type: "Feature", // 定义这是一个要素geometry: { // 要素的几何属性type: "LineString", // 几何类型是线字符串coordinates: [ // 线字符串的坐标数组[114.30, 30.50], // 第一个坐标点[116, 30.50] // 第二个坐标点
1.1.2. 设置矢量数据源读取数据
let source = new ol.source.Vector({features: new ol.format.GeoJSON().readFeatures(data) // 从GeoJSON数据中读取要素});
1.1.3. 设置矢量图层
let layer = new ol.layer.Vector({source: source // 将之前创建的矢量数据源赋值给图层的source属性});map.addLayer(layer); // 将矢量图层添加到地图上
1.1.4. 添加地图容器
// 设置矢量图层let layer = new ol.layer.Vector({source: source // 这里source应该是之前定义的矢量数据源});// 添加地图容器map.addLayer(layer); // 将创建的矢量图层添加到地图对象中
1.1.5. 给线要素添加样式信息
let style = new ol.style.Style({// stroke线设置样式stroke: new ol.style.Stroke({color: "#ff2d51", // 设置线条颜色为红色(#ff2d51)width: 3 // 设置线条宽度为3像素})});layer.setStyle(style); // 将样式应用到图层上
示例代码
var data = {type: "FeatureCollection",features: [// {// type: "Feature",// geometry: {// type: "Point",// coordinates: [114.30, 30.50]// }// },{type: "Feature",geometry: {type: "LineString",coordinates: [[114.30, 30.50], [116, 30.50]]}}]}// 设置样式const style = new ol.style.Style({// 边线颜色stroke: new ol.style.Stroke({color: '#ff2d51',width: 4})})
设置区要素
下面我们学习如何设置区要素,效果如下图所示:
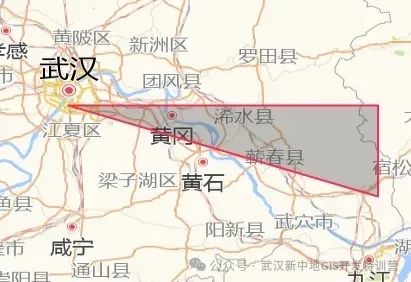
var data = {type: "FeatureCollection",features: [{type: "Feature",geometry: {type: "Polygon",coordinates: [[[114.30, 30.50], [116, 30.50], [116, 30]]] }}]}//设置样式const style = new ol.style.Style({//边线颜色stroke: new ol.style.Stroke({color: '#ff2d51',width: 2}),//设置填充色fill: new ol.style.Fill({color: "rgba(50, 50, 50, 0.3)"})})