Vue接口测试平台十三 —— 测试报告
效果图及说明
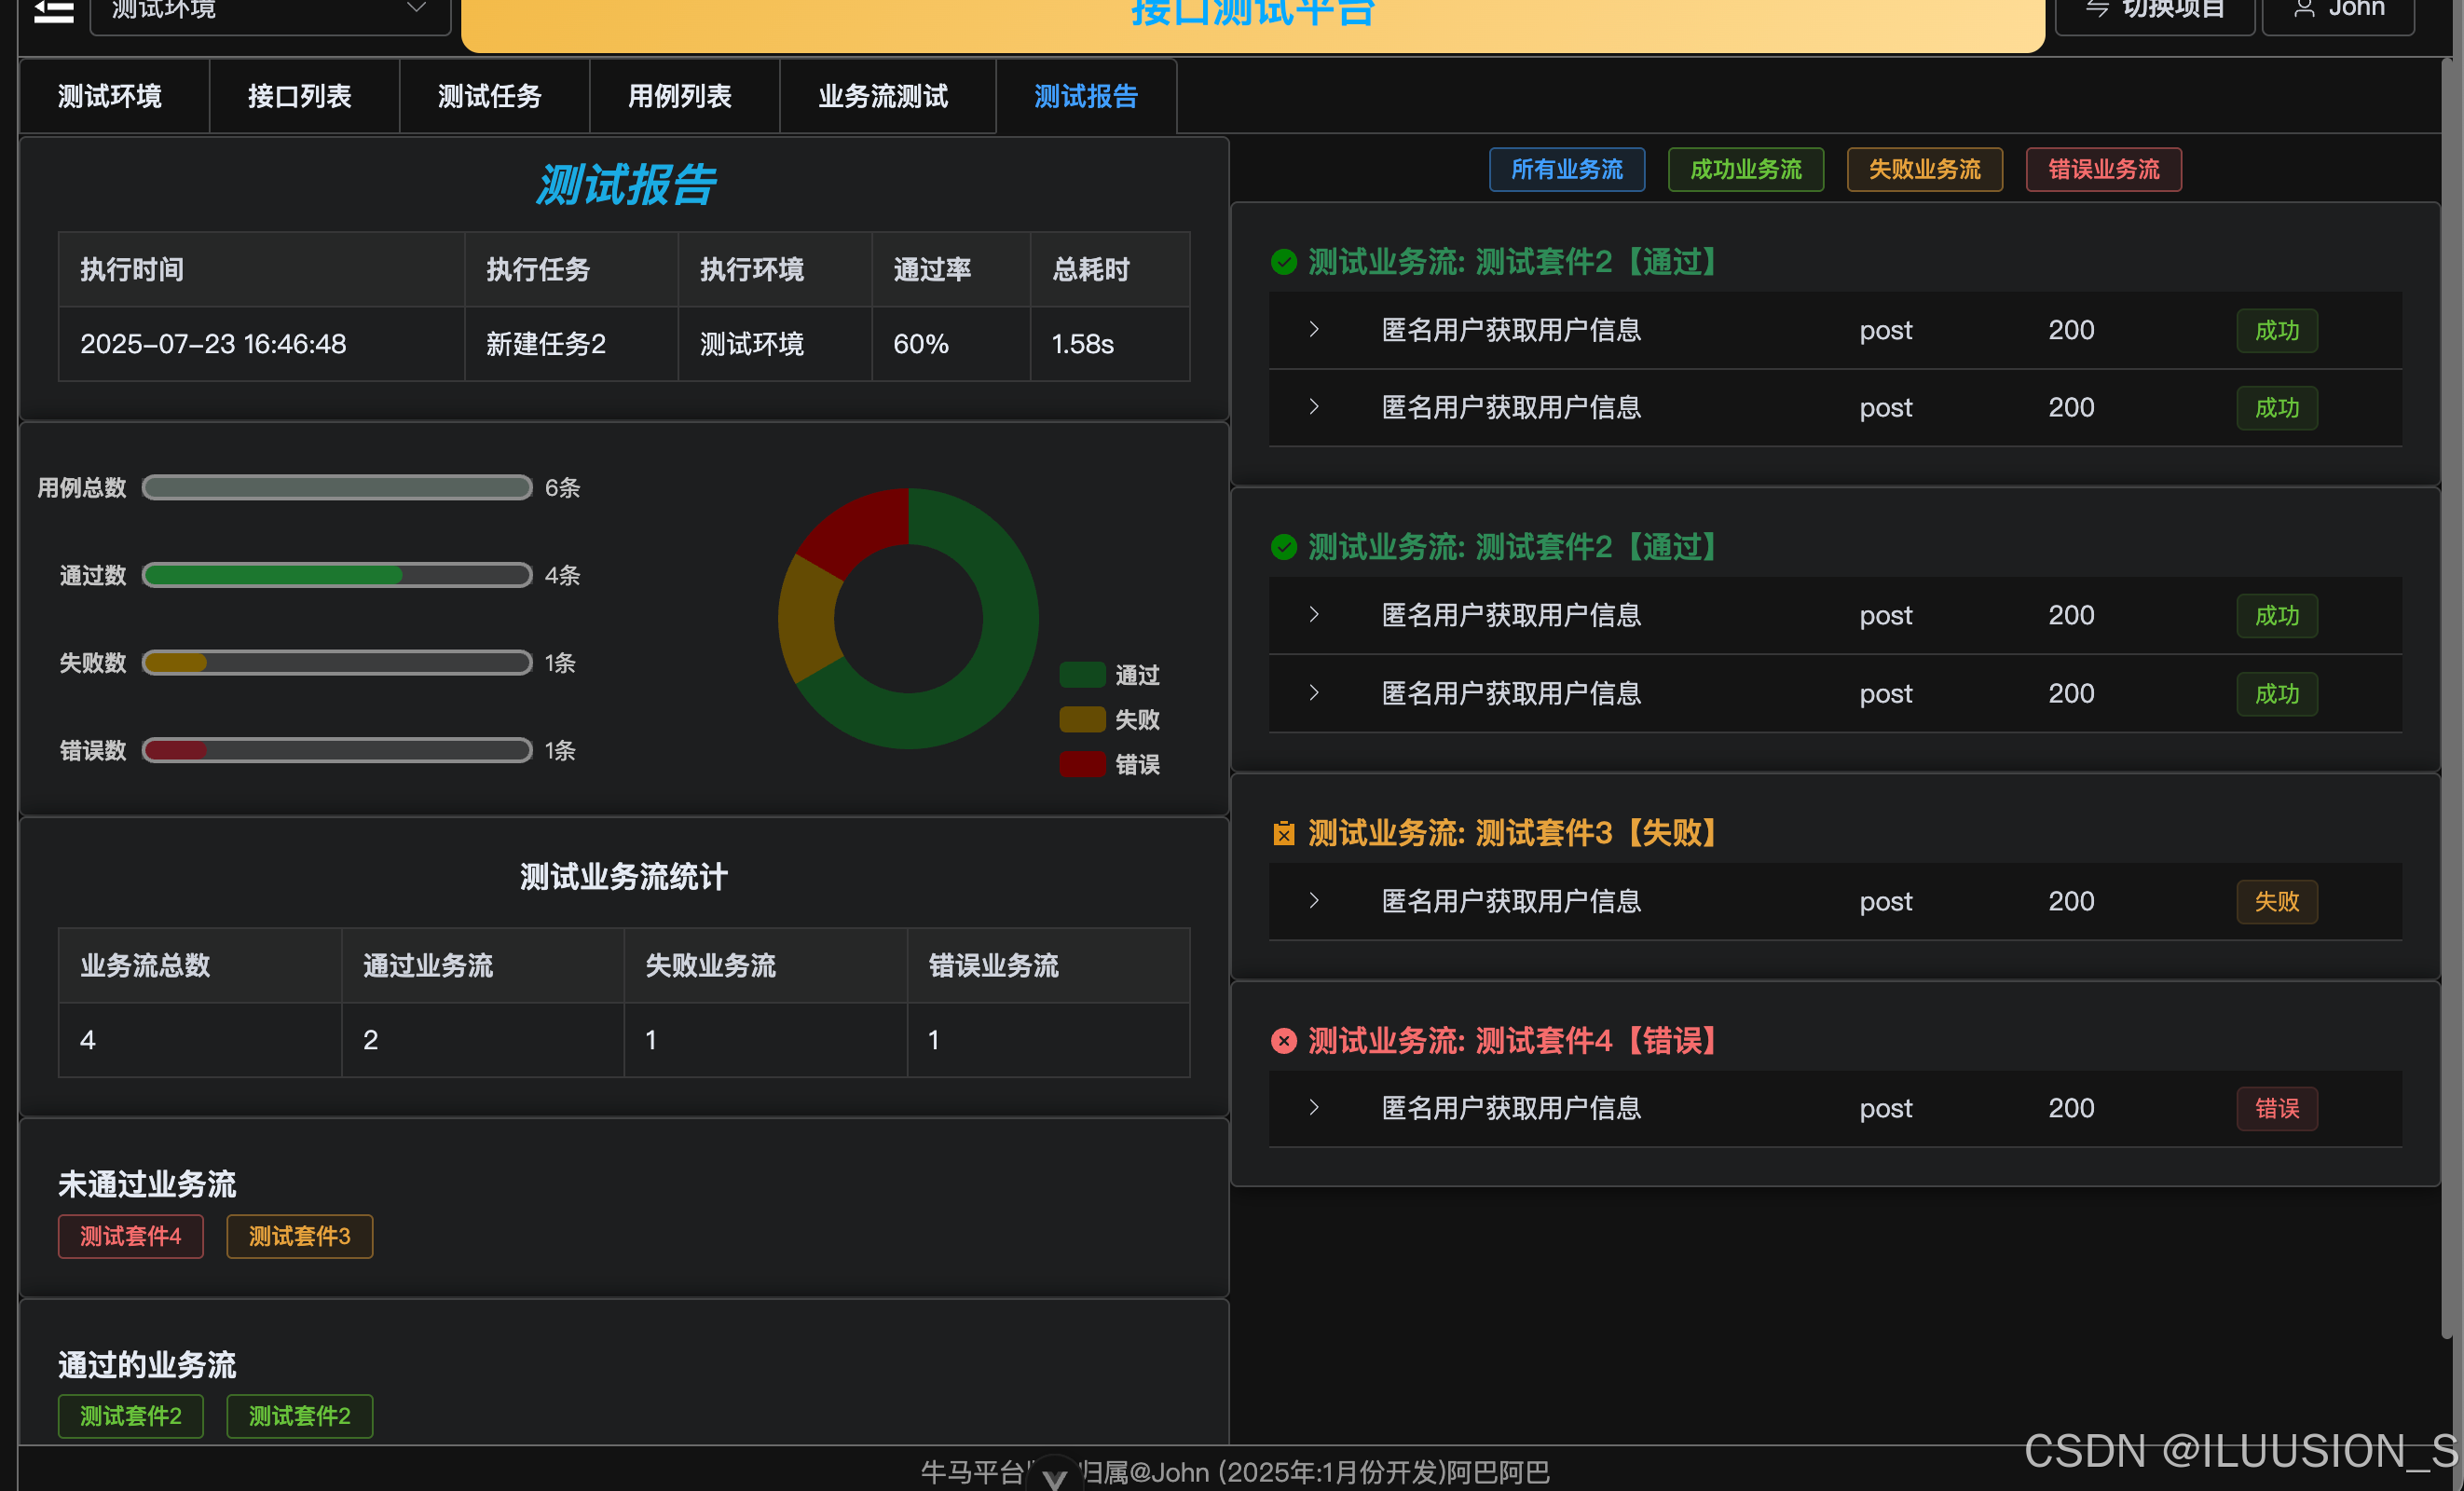
左侧显示一些报告基本信息,然后使用echarts进行数据展示。右侧显示具体的业务流,及业务流里面的用例信息。通过点击筛选查看想要的数据。
内容实现
前置准备
-
新建文件
ReportView.vue
-
路由配置
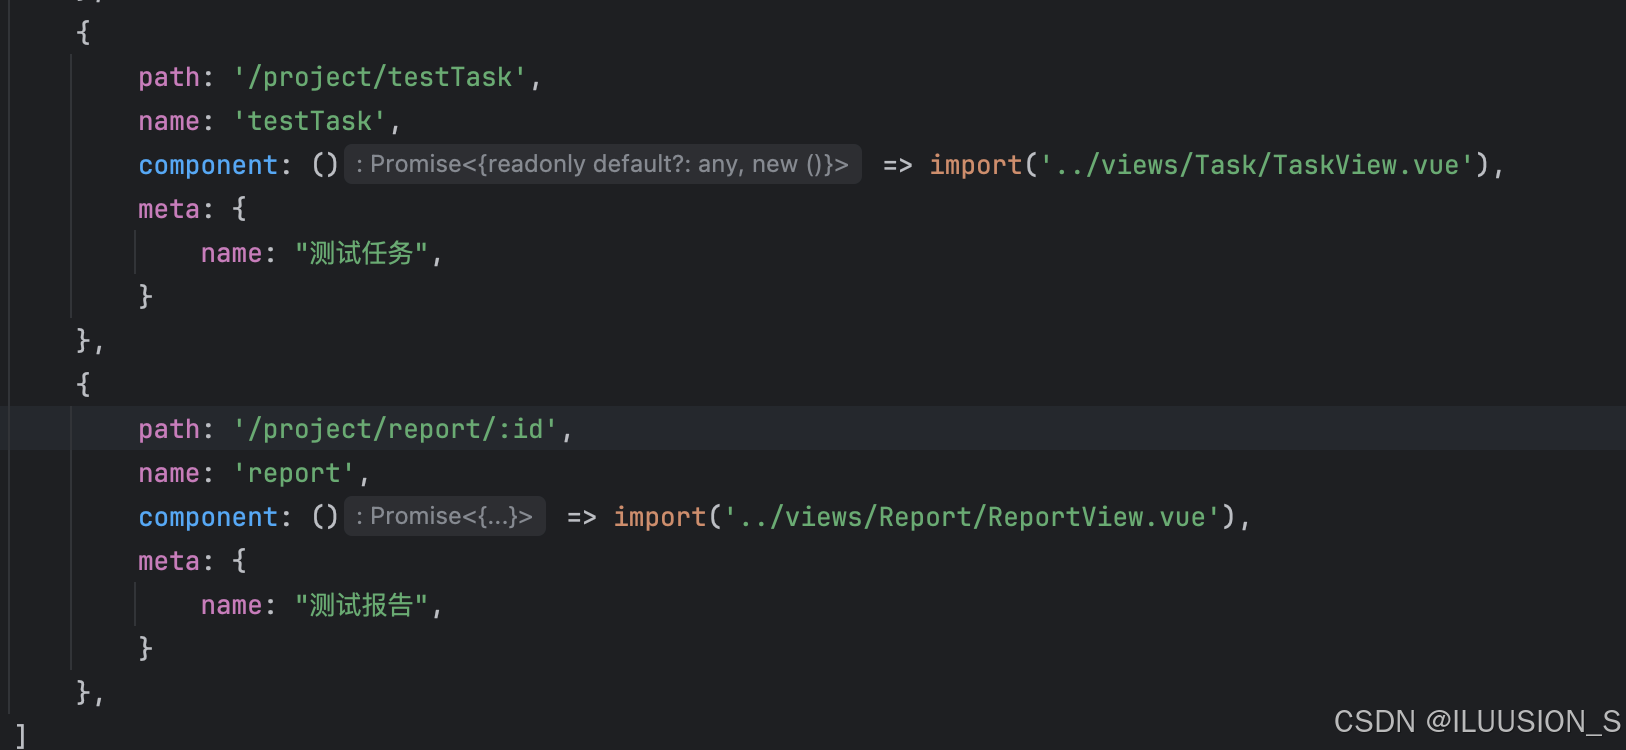
由于这个不需要展示在左侧菜单栏,就不用进行Home菜单栏配置了。整体分成左右两个部分 -
页面数据获取
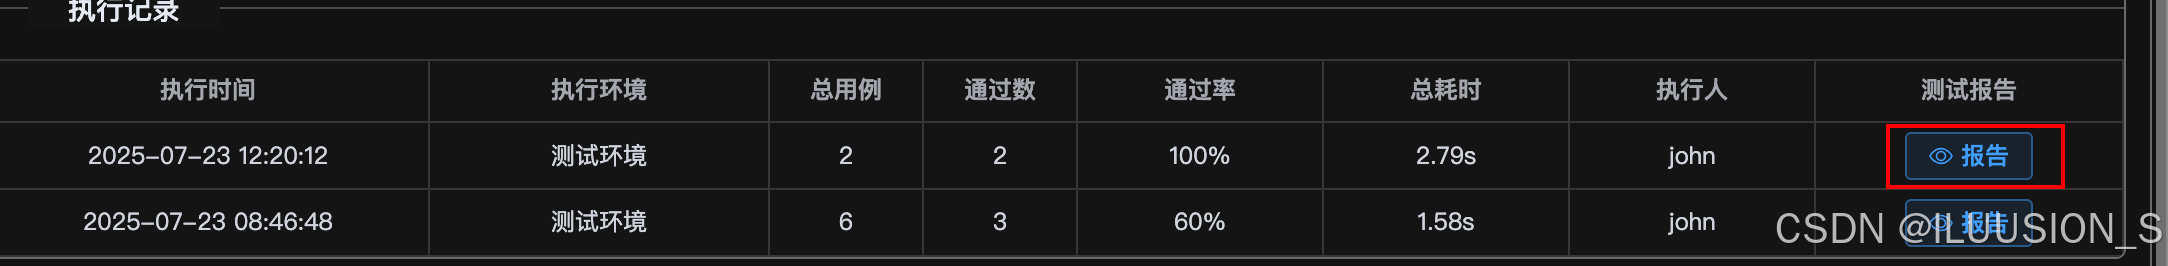
这个页面是从之前测试任务页面点击跳转的。所以点击时携带了任务记录id在url上,通过获取id,再界面组件加载完时获取需要的数据用于渲染。使用useRoute来获取url携带的参数。
例如:http://localhost:5173/project/report/46,获取这个46,再去请求46的数据
import {useRoute} from 'vue-router'
import {onMounted, onUpdated, reactive, computed} from 'vue'
import http from '@/api/index.js'const route = useRoute()
const state = reactive({record: {create_time: '',task: '',env: '',pass_rate: 0,run_time: ''},report: {results: [],all: 0,success: 0,fail: 0,error: 0},FlowDatas: null
})async function getReportInfo(id) {const response = await http.task.getTaskReportApi(id)if (response.status === 200) {state.report = response.data.info;state.FlowDatas = {...state.report.results};}
}async function getRecordInfo(id) {const response = await http.task.getRecordsInfoApi(id)if (response.status === 200) {state.record = response.data}
}onMounted(() => {const rid = route.params.idgetRecordInfo(rid)getReportInfo(rid)
})
获取完内容后,使用v-if,如果有内容再展示页面。整体页面分左右
<el-row v-if="state.report"><el-col :span="12">左侧 </el-col><el-col :span="12"> 右侧</el-col></el-row>
左侧内容实现
每一个部分都是一个单独的card样式
顶部标题+信息展示
<el-scrollbar height="calc(100vh - 65px)"><el-card v-if="state.record" body-style="padding-top:0"><div class="report_title"><i>测试报告</i></div><el-descriptions :column="5" border direction="vertical"><el-descriptions-item label="执行时间">{{ formatDateTime(state.record.create_time) }}</el-descriptions-item><el-descriptions-item label="执行任务">{{ state.record.task }}</el-descriptions-item><el-descriptions-item label="执行环境">{{ state.record.env }}</el-descriptions-item><el-descriptions-item label="通过率">{{ state.record.pass_rate + '%' }}</el-descriptions-item><el-descriptions-item label="总耗时">{{ state.record.run_time }}</el-descriptions-item></el-descriptions></el-card>
</el-scrollbar>......
.report_title {font: bold 24px/50px "微软雅黑";text-align: center;color: #17abe3;vertical-align: top;
}

ps.
这里时间格式最开始是默认格式( 2025-07-23T08:46:48.636913+00:00 ),不便于查看。让AI生成一下代码转换就行。
function formatDateTime(dateString) {if (!dateString) return '';// 创建 Date 对象const date = new Date(dateString);// 获取年月日时分秒const year = date.getFullYear();const month = String(date.getMonth() + 1).padStart(2, '0');const day = String(date.getDate()).padStart(2, '0');const hours = String(date.getHours()).padStart(2, '0');const minutes = String(date.getMinutes()).padStart(2, '0');const seconds = String(date.getSeconds()).padStart(2, '0');// 返回格式化后的字符串return `${year}-${month}-${day} ${hours}:${minutes}:${seconds}`;
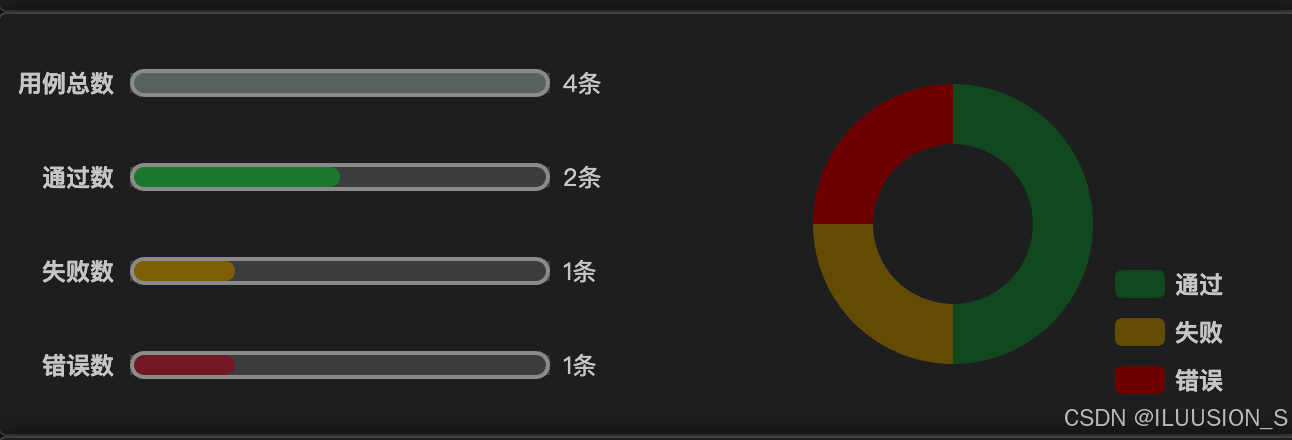
}图表展示
使用echarts展示就行。
https://echarts.apache.org/examples/zh/index.html#chart-type-bar
然后echarts有调试,慢慢调就行
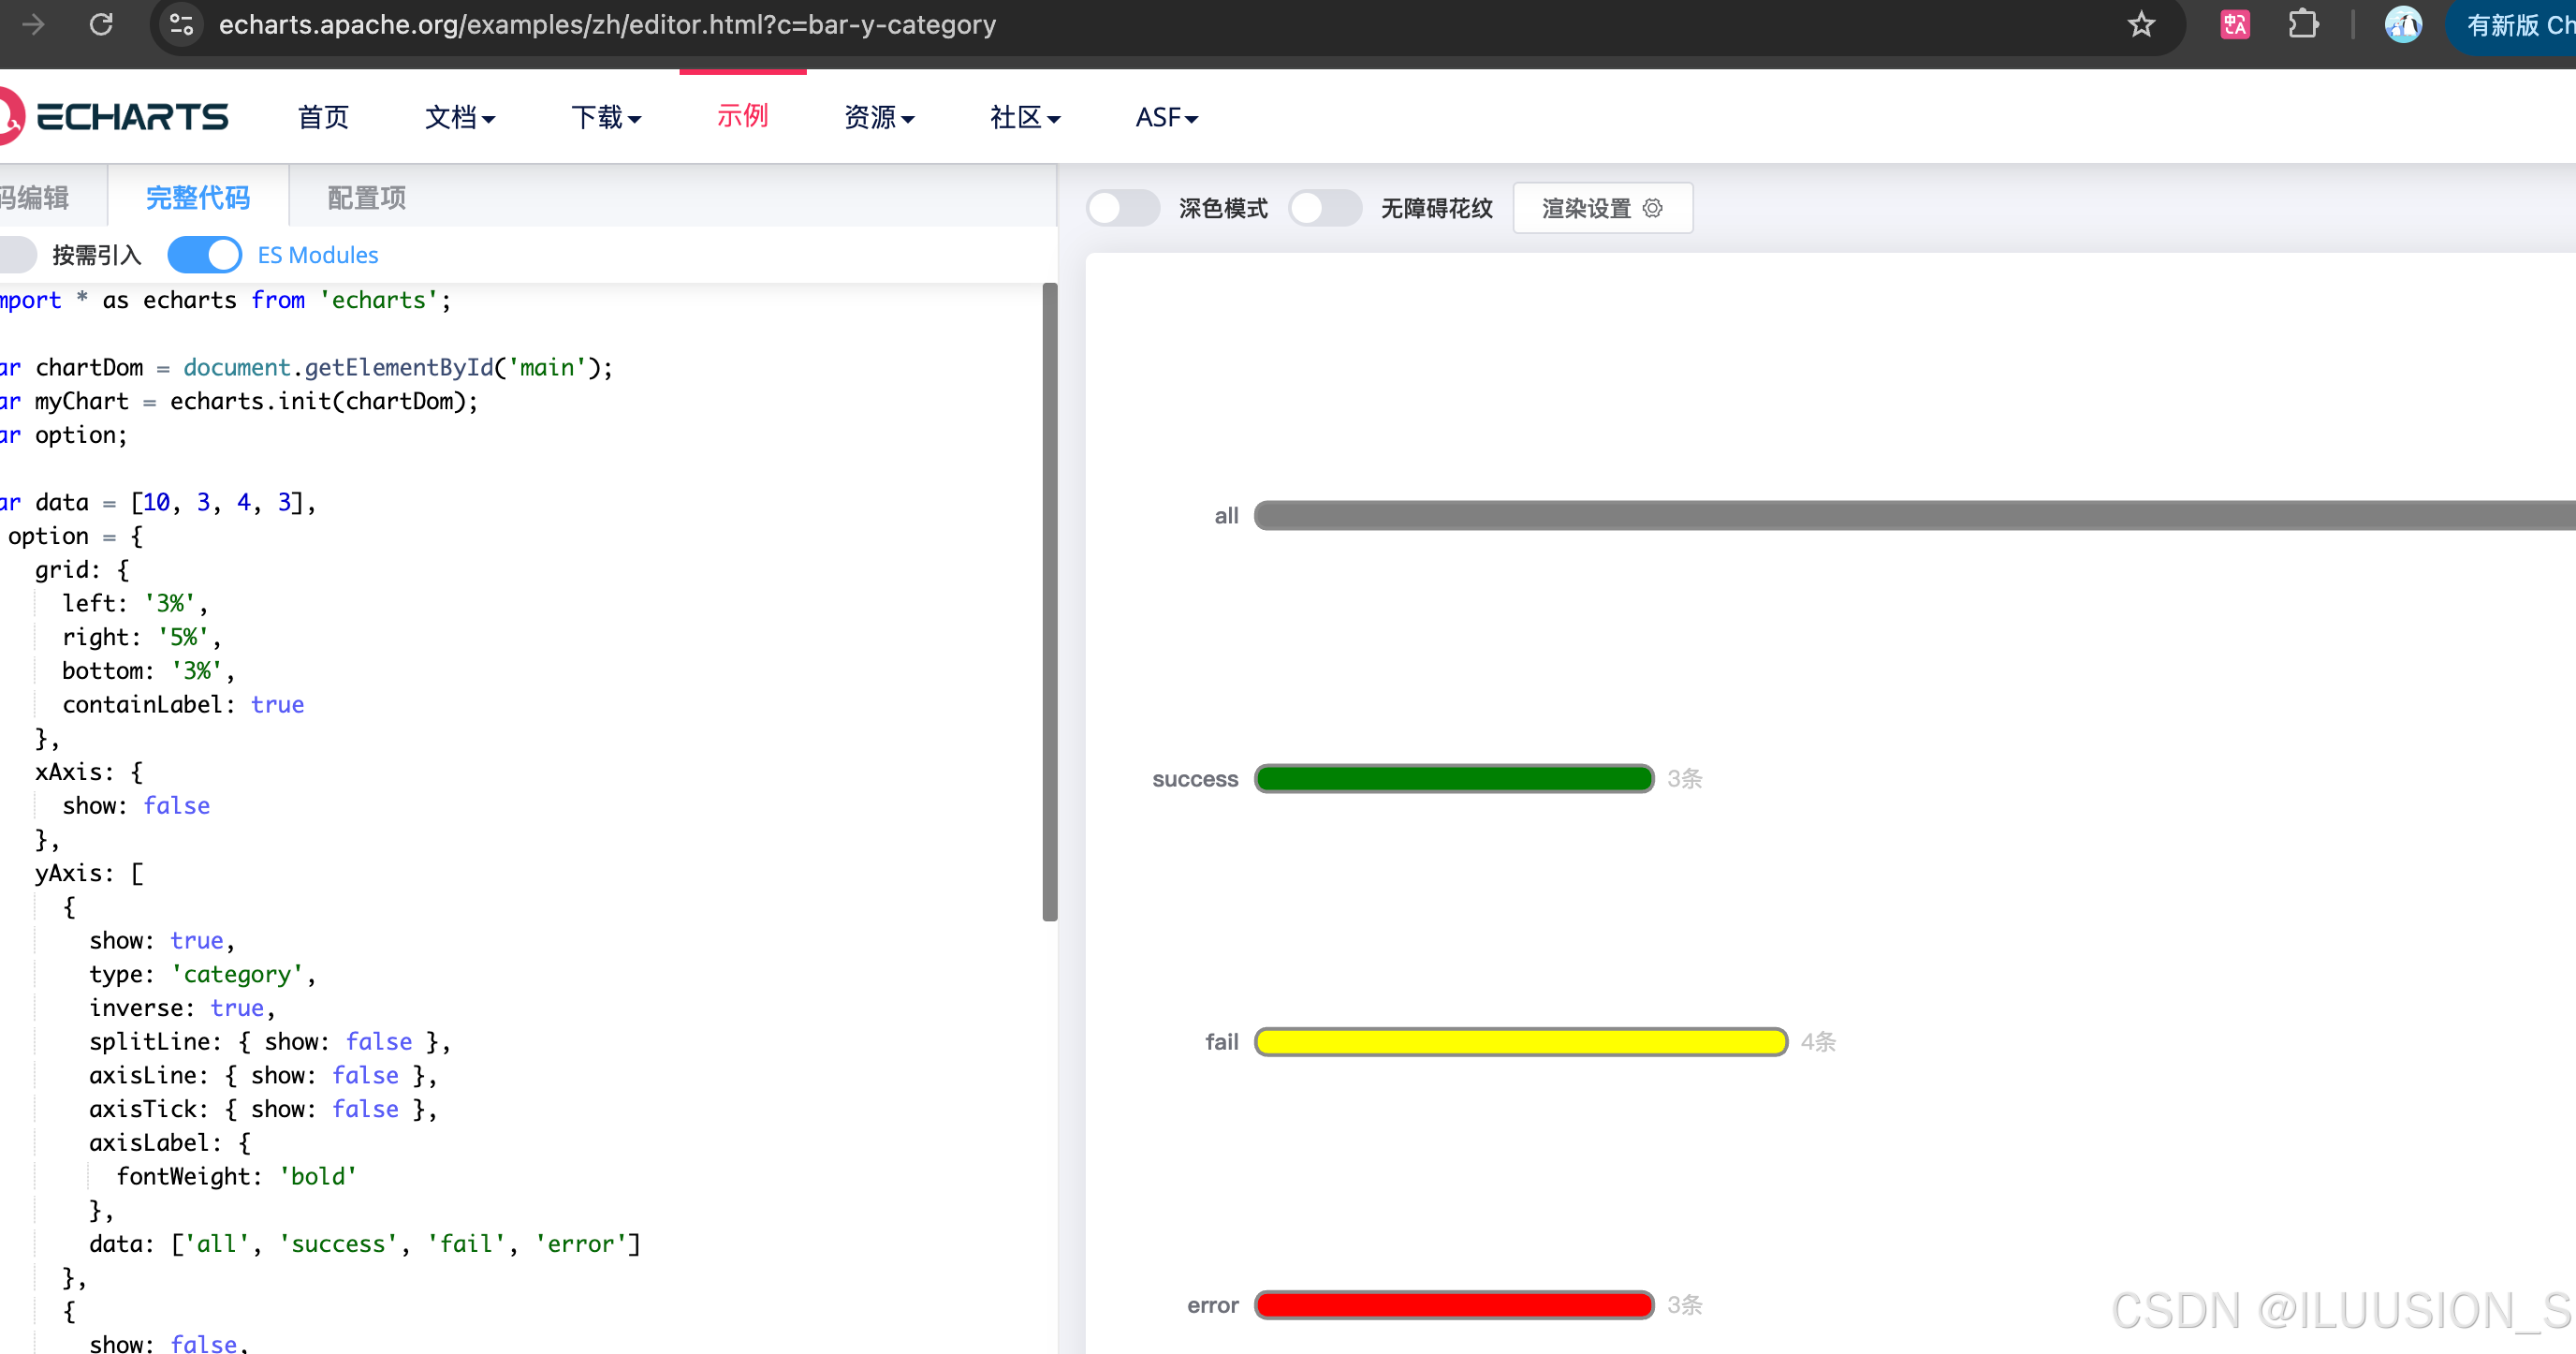
调试完集成到代码中。写成单独js文件(chart.js),再引用。
<el-card body-style="padding:5px"><el-row :gutter="5"><!-- 用例信息图表--><el-col :span="12"><div class="chartBox" id="chart1"></div></el-col><!-- 通过率图表--><el-col :span="12"><div class="chartBox" id="chart2"></div></el-col></el-row></el-card>
import chart from '@/utils/chart.js'function show_chart1() {const value = [state.report.all, state.report.success, state.report.fail, state.report.error]const label = ['用例总数', '通过数', '失败数', '错误数']const ele = document.querySelector('#chart1')chart.chart1(ele, value, label)
}function show_chart2() {const datas = [{value: state.report.success, name: '通过'}, {value: state.report.fail, name: '失败'},{value: state.report.error, name: '错误'}];const ele = document.querySelector('#chart2')chart.chart2(ele, datas)
}
//数据刷新时重新渲染
onUpdated(() => {if (document.querySelector('#chart1')) {show_chart1()}if (document.querySelector('#chart2')) {show_chart2()}
})
chart1(ele, data, dataLabel) {//1.初始化chart01const chart1 = echarts.init(ele);let barLengths = []data.forEach((item) => {barLengths.push(data[0])})//2.配置数据const myColor = ['#57625c', '#1c762f', '#7d5e03','#701a23', '#1f4d7c', '#267065'];const option = {//图标位置grid: {top: '3%',left: '20%',bottom: '3%'},xAxis: {show: false},yAxis: [{show: true,data: dataLabel,inverse: true,axisLine: {show: false},splitLine: {show: false},axisTick: {show: false},axisLabel: {color: '#c5c5c5',fontWeight: 'bold'}},{show: false,inverse: true,data: data,axisLabel: {fontSize: 12,color: '#c5c5c5',},axisTick: {show: false},axisLine: {show: false}}],series: [{type: 'bar',yAxisIndex: 0,data: data,barCategoryGap: 50,barWidth: 10,showBackground: true,itemStyle: {borderRadius: 6,color: function (params) {var num = myColor.length;return myColor[params.dataIndex % num];}}},{type: 'bar',yAxisIndex: 1,barCategoryGap: 50,data: barLengths,barWidth: 14,itemStyle: {color: 'none',borderColor: '#8b8b8b',borderWidth: 2,borderRadius: 6},label: {show: true,position: 'right',formatter: '{b}条',color: '#c5c5c5',}}]};// 渲染图表。chart1.setOption(option);return chart1},
// 用例通过率图表(饼图)chart2(ele, datas) {//1.初始化chart2const chart2 = echarts.init(ele);//2 图表样式配置const option = {color: ['#11481d', '#644b02', '#6d0000', '#1e4c7a', '#297a6e'],tooltip: {trigger: 'item',formatter: '{d}%【{c}条】',backgroundColor: 'rgba(43, 43, 43, 0.6)',borderColor: '#00aaff',textStyle: {color: '#00aaff',fontSize: '16',fontWeight: 'bold'}},legend: {orient: 'vertical',right: 10,bottom: 10,textStyle: {color: '#c5c5c5',fontWeight: 'bold'}},series: [{type: 'pie',radius: ['40%', '70%'],avoidLabelOverlap: false,label: {show: false,position: 'center'},emphasis: {label: {show: true,fontSize: '16',fontWeight: 'bold',color: '#c5c5c5',}},labelLine: {show: false,color: '#55aaff'},data: datas}]};//3、渲染图表。chart2.setOption(option);return chart2}
任务中业务流统计
 <el-card><el-descriptions :column="4" border title="测试业务流统计" direction="vertical"><el-descriptions-item label="业务流总数" >{{ state.report.results.length }}</el-descriptions-item><el-descriptions-item label="通过业务流">{{ successFlow.length }}</el-descriptions-item><el-descriptions-item label="失败业务流">{{ failFlow.length }}</el-descriptions-item><el-descriptions-item label="错误业务流">{{ errorFlow.length }}</el-descriptions-item></el-descriptions></el-card>...css:deep(.el-descriptions__header) {font: bold 24px "微软雅黑";text-align: center;justify-content: center;
}

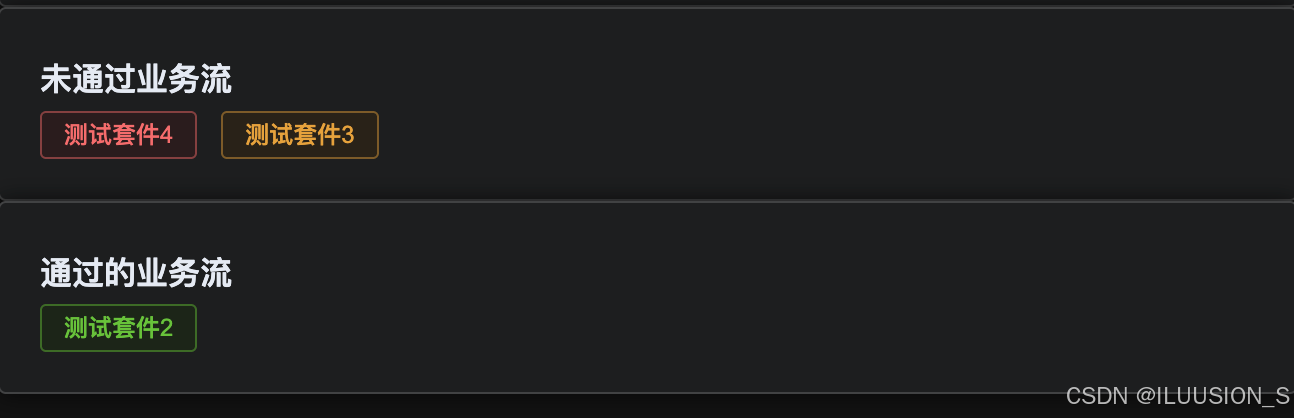
未通过的业务流以及通过的
未通过的包含失败和错误的
<el-card><b style="line-height: 30px"> 未通过业务流 </b><div><el-button plain size="small" @click="state.FlowDatas = [su]" type="danger"v-for="su in errorFlow">{{ su.name }}</el-button><el-button plain size="small" @click="state.FlowDatas = [su]" type="warning"v-for="su in failFlow"  >{{ su.name }}</el-button></div>
</el-card><el-card><b style="line-height: 30px"> 通过的业务流 </b><div><el-button plain size="small" @click="state.FlowDatas = [su]" type="success"v-for="su in successFlow">{{ su.name }}</el-button></div>
</el-card>
state.FlowDatas = [su] 会将 state.FlowDatas 设置为只包含当前点击项的数组,而不是显示所有项目。方便右侧展示对应点击项。
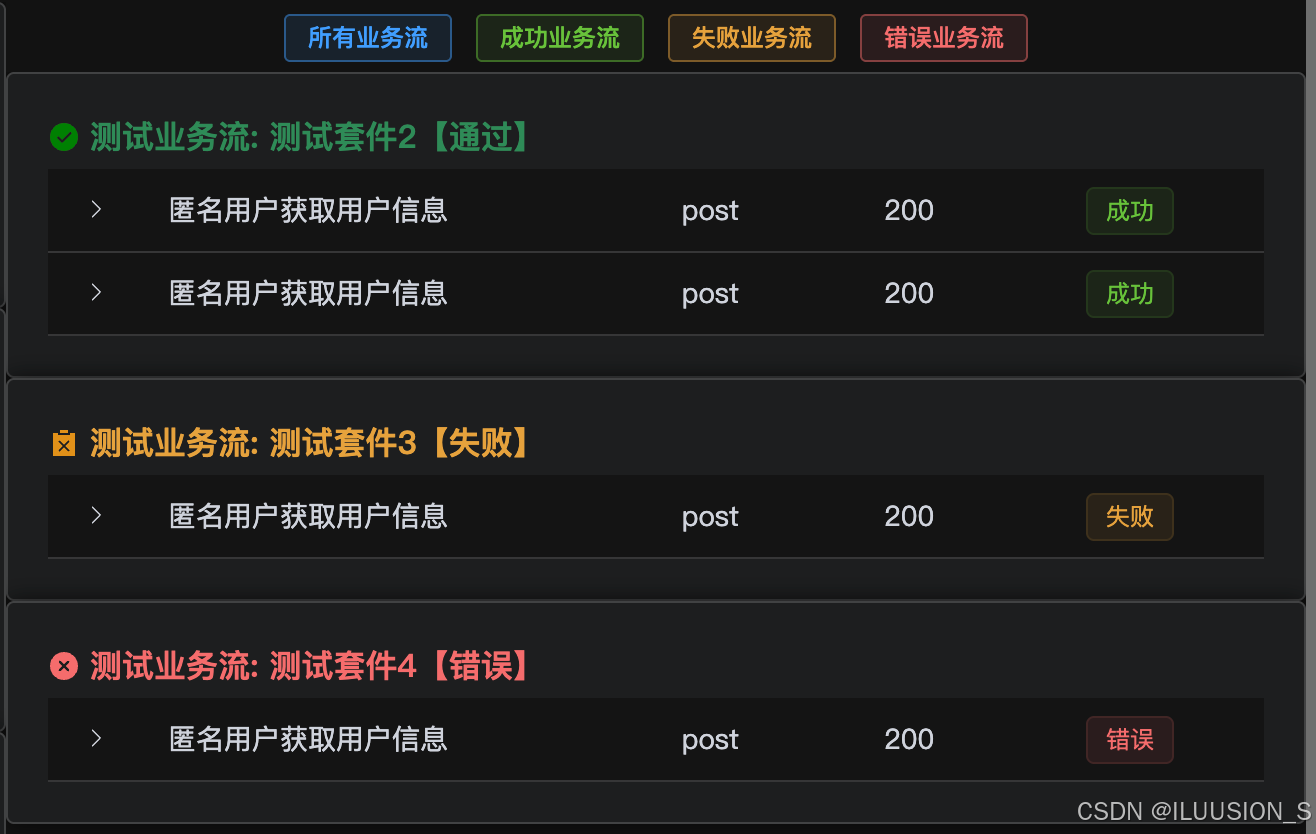
右侧
筛选按钮
<div><div style="margin: 5px;text-align: center"><el-button size="small" plain type="primary" @click="state.FlowDatas = {...state.report.results}">所有业务流</el-button><el-button size="small" plain type="success" @click="state.FlowDatas = successFlow">成功业务流</el-button><el-button size="small" plain type="warning" @click="state.FlowDatas = failFlow">失败业务流</el-button><el-button size="small" plain type="danger" @click="state.FlowDatas = errorFlow">错误业务流</el-button></div>const successFlow = computed(() => {return state.report.results.filter(item => item.status === '成功')
})const failFlow = computed(() => {return state.report.results.filter(item => item.status === '失败')
})const errorFlow = computed(() => {return state.report.results.filter(item => item.status === '错误')
})

业务流数据展示
<el-scrollbar height="calc(100vh - 117px)"><div class="right_box"><el-card v-for="(flow,index) in state.FlowDatas" :key="index"><div class="title" v-if="flow.status==='成功'"><div><el-icon color="green"><SuccessFilled/></el-icon></div><div style="color:seagreen;font-weight: bold;margin-left: 5px;margin-bottom: 5px"> {{'测试业务流: ' + flow.name + '【通过】'}}</div></div><div class="title" v-else-if="flow.status==='失败'"><div><el-icon color='#e19118'><Failed/></el-icon></div><div style="color:#e6a23c;font-weight: bold;margin-left: 5px;margin-bottom: 5px"> {{'测试业务流: ' + flow.name + '【失败】'}}</div></div><div class="title" v-else><div><el-icon color='#f56c6c'><CircleCloseFilled/></el-icon></div><div style="color:#f56c6c;font-weight: bold;margin-left: 5px;margin-bottom: 5px"> {{'测试业务流: ' + flow.name + '【错误】'}}</div></div><el-table :data="flow.cases" style="width: 100%" class="result" :show-header="false"><el-table-column type="expand"><template #default="scope"><Result :result='scope.row'></Result></template></el-table-column><el-table-column :show-overflow-tooltip="true" label="用例名称" prop="name"min-width="100px"></el-table-column><el-table-column label="请求方法" prop="method"min-width="40px"></el-table-column><el-table-column label="状态码" prop="status_code"min-width="40px"></el-table-column><el-table-column label="断言结果" prop="state"min-width="40px"><template #default="scope"><el-tag v-if="scope.row.status === '成功'" type="success">成功</el-tag><el-tag v-else-if="scope.row.status === '失败'" type="warning">失败</el-tag><el-tag v-else type="danger">错误</el-tag></template></el-table-column></el-table></el-card></div></el-scrollbar>
每块内容 图标 + 名字 flex布局。
下面展示一些基本信息,点击展开result结果。使用之前的Result组件
总结
主要用了vue的计算属性 computed
还有vue-router 获取链接中参数。
还有echarts图的一些内容。