API征服者:Python抓取星链卫星实时轨迹
API征服者:Python抓取星链卫星实时轨迹
从基础调用到工业级卫星追踪系统实战指南
一、太空数据时代:星链卫星的全球覆盖
星链卫星网络规模:
- 已发射卫星数量:4,000+
- 目标卫星总数:42,000
- 轨道高度:340km - 1,200km
- 覆盖范围:全球98%有人居住区
- 数据传输延迟:25-50ms
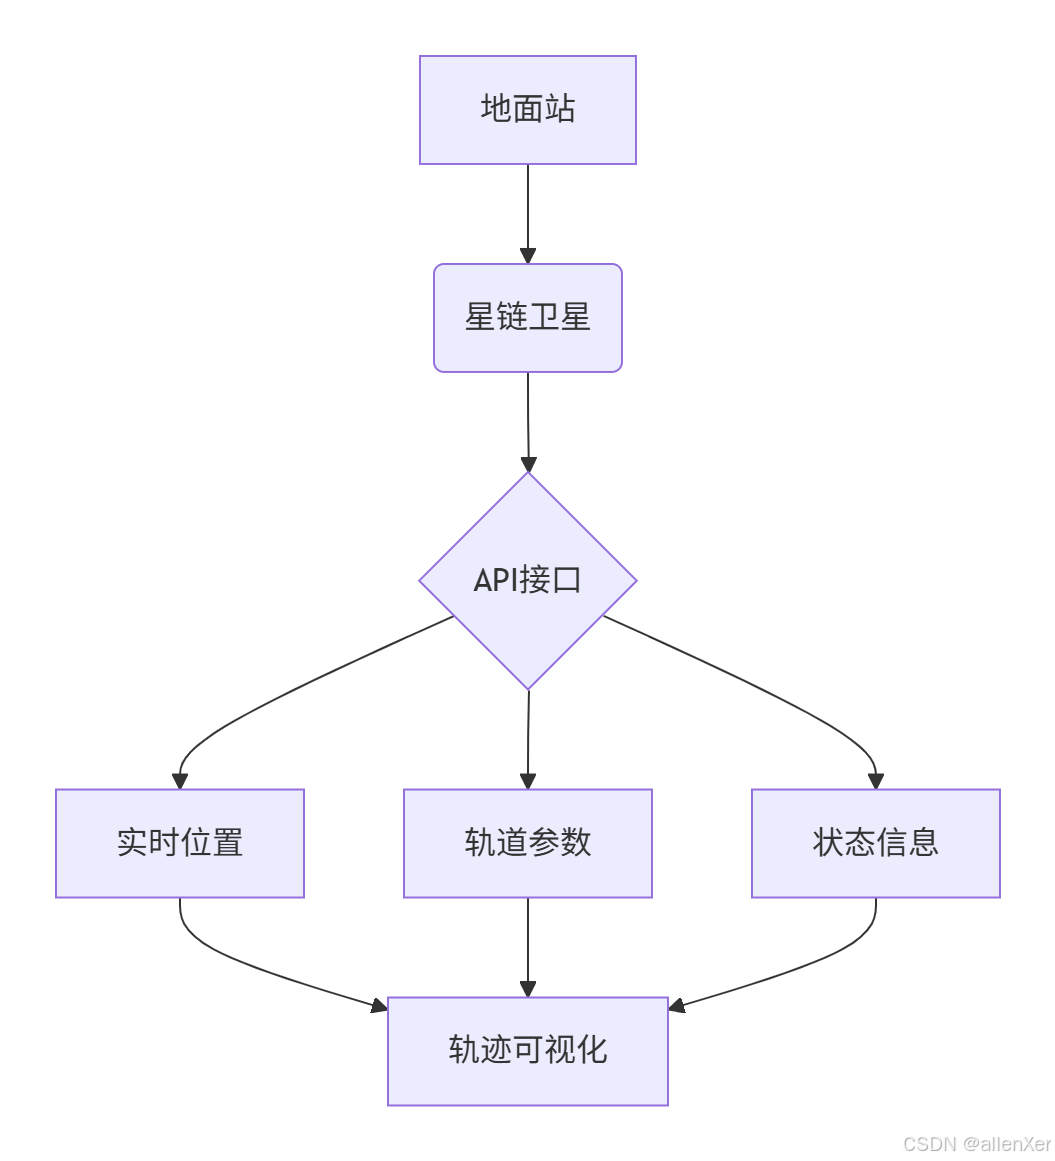
二、SpaceX API:太空数据的入口
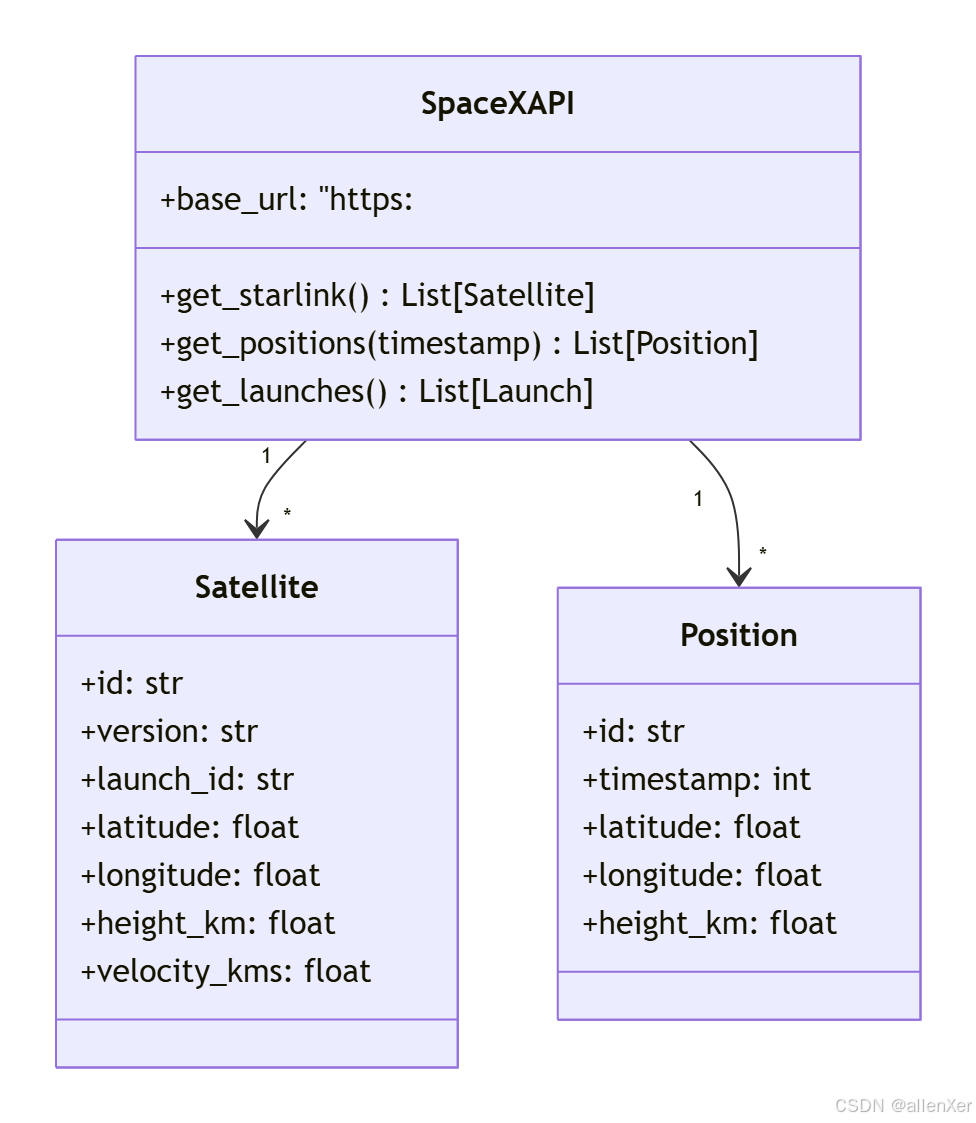
1. API接口解析
2. 免费API密钥获取
# 无需API密钥即可访问
import requestsdef get_starlink_satellites():"""获取所有星链卫星信息"""url = "https://api.spacexdata.com/v4/starlink"response = requests.get(url)return response.json()# 示例
satellites = get_starlink_satellites()
print(f"获取到{len(satellites)}颗卫星数据")
三、基础实现:卫星轨迹可视化
1. 获取实时卫星位置
import requests
import pandas as pd
import timedef get_realtime_positions():"""获取所有卫星实时位置"""url = "https://api.spacexdata.com/v4/starlink"response = requests.get(url)satellites = response.json()positions = []for sat in satellites:positions.append({'id': sat['id'],'name': sat['spaceTrack']['OBJECT_NAME'],'latitude': sat['latitude'],'longitude': sat['longitude'],'height_km': sat['height_km'],'velocity_kms': sat['velocity_kms'],'timestamp': sat['spaceTrack']['EPOCH']})return pd.DataFrame(positions)# 获取数据
df = get_realtime_positions()
print(df.head())
2. 3D地球可视化
import plotly.express as px
import plotly.graph_objects as godef plot_3d_earth(satellites):"""在3D地球上绘制卫星位置"""# 创建地球earth = go.Figure(go.Scattergeo())# 添加卫星fig = px.scatter_geo(satellites,lat='latitude',lon='longitude',size='height_km',color='velocity_kms',hover_name='name',projection='orthographic',title='星链卫星实时位置')# 更新布局fig.update_layout(geo=dict(showland=True,landcolor="rgb(212, 212, 212)",subunitcolor="rgb(255, 255, 255)",countrycolor="rgb(255, 255, 255)",showlakes=True,lakecolor="rgb(127, 205, 255)",showsubunits=True,showcountries=True,resolution=50,projection=dict(type='orthographic',rotation=dict(lon=0, lat=0, roll=0)),lonaxis=dict(showgrid=True,gridwidth=0.5,range=[-180, 180],dtick=10),lataxis=dict(showgrid=True,gridwidth=0.5,range=[-90, 90],dtick=10)))fig.show()# 可视化
plot_3d_earth(df)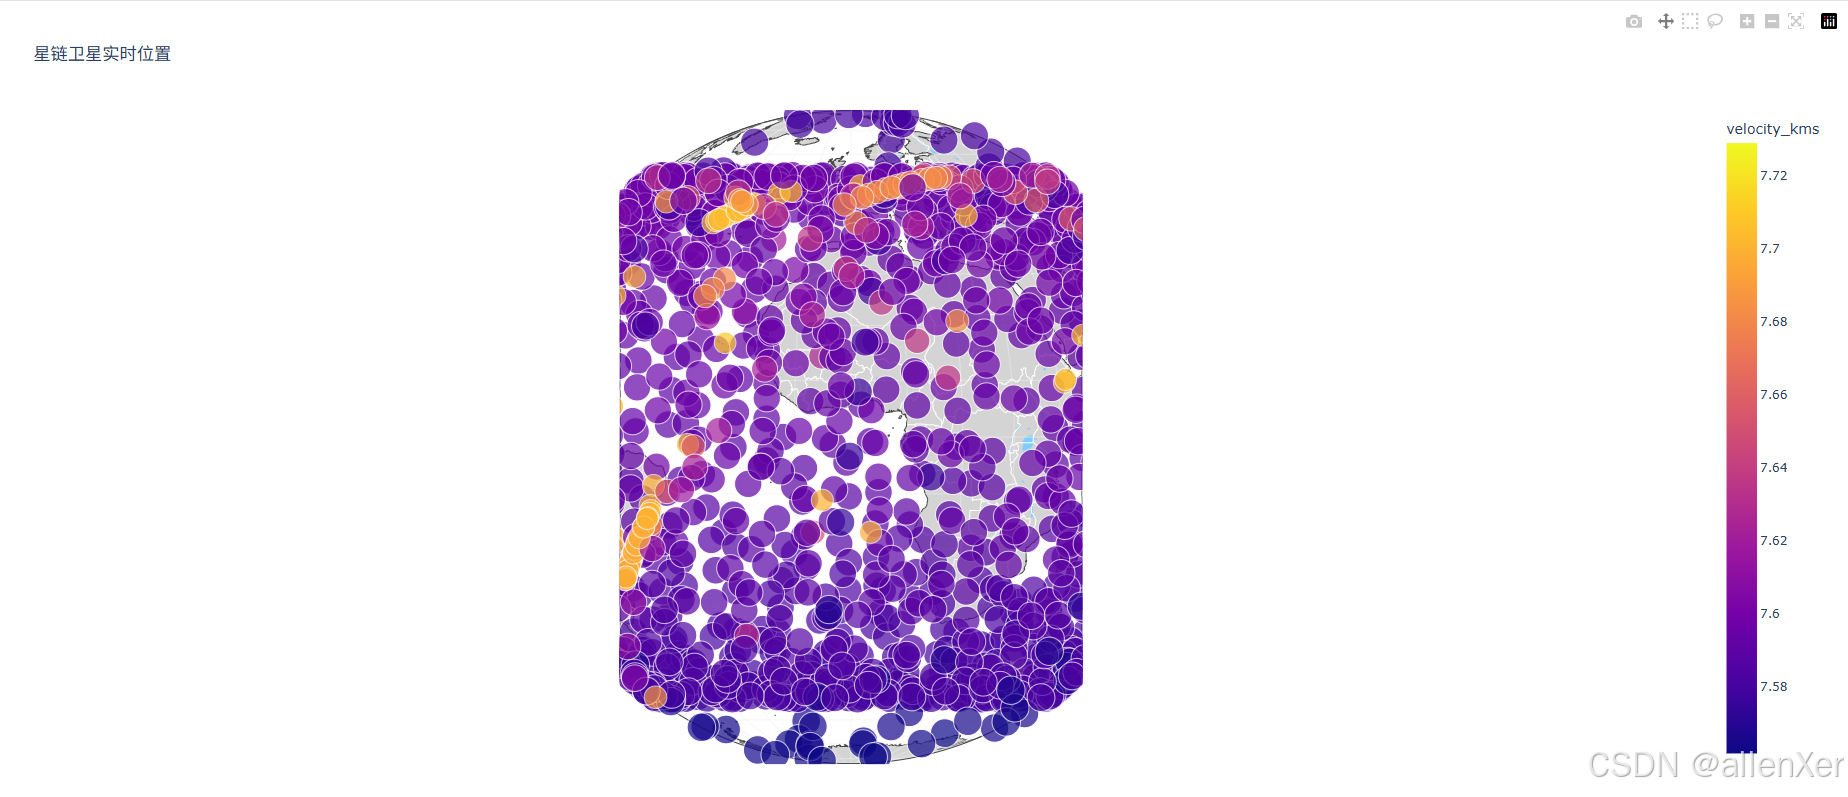
3. 实时轨迹动画
def animate_satellite_movement(satellite_id):"""绘制卫星轨迹动画"""# 获取历史位置url = f"https://api.spacexdata.com/v4/starlink/{satellite_id}/positions"response = requests.get(url)positions = response.json()# 创建动画fig = px.scatter_geo(pd.DataFrame(positions),lat='latitude',lon='longitude',animation_frame='timestamp',projection='natural earth',title=f'卫星{satellite_id}轨迹动画')fig.update_layout(geo=dict(showland=True,landcolor="rgb(212, 212, 212)",showocean=True,oceancolor="rgb(127, 205, 255)"))fig.show()# 示例:绘制单个卫星轨迹
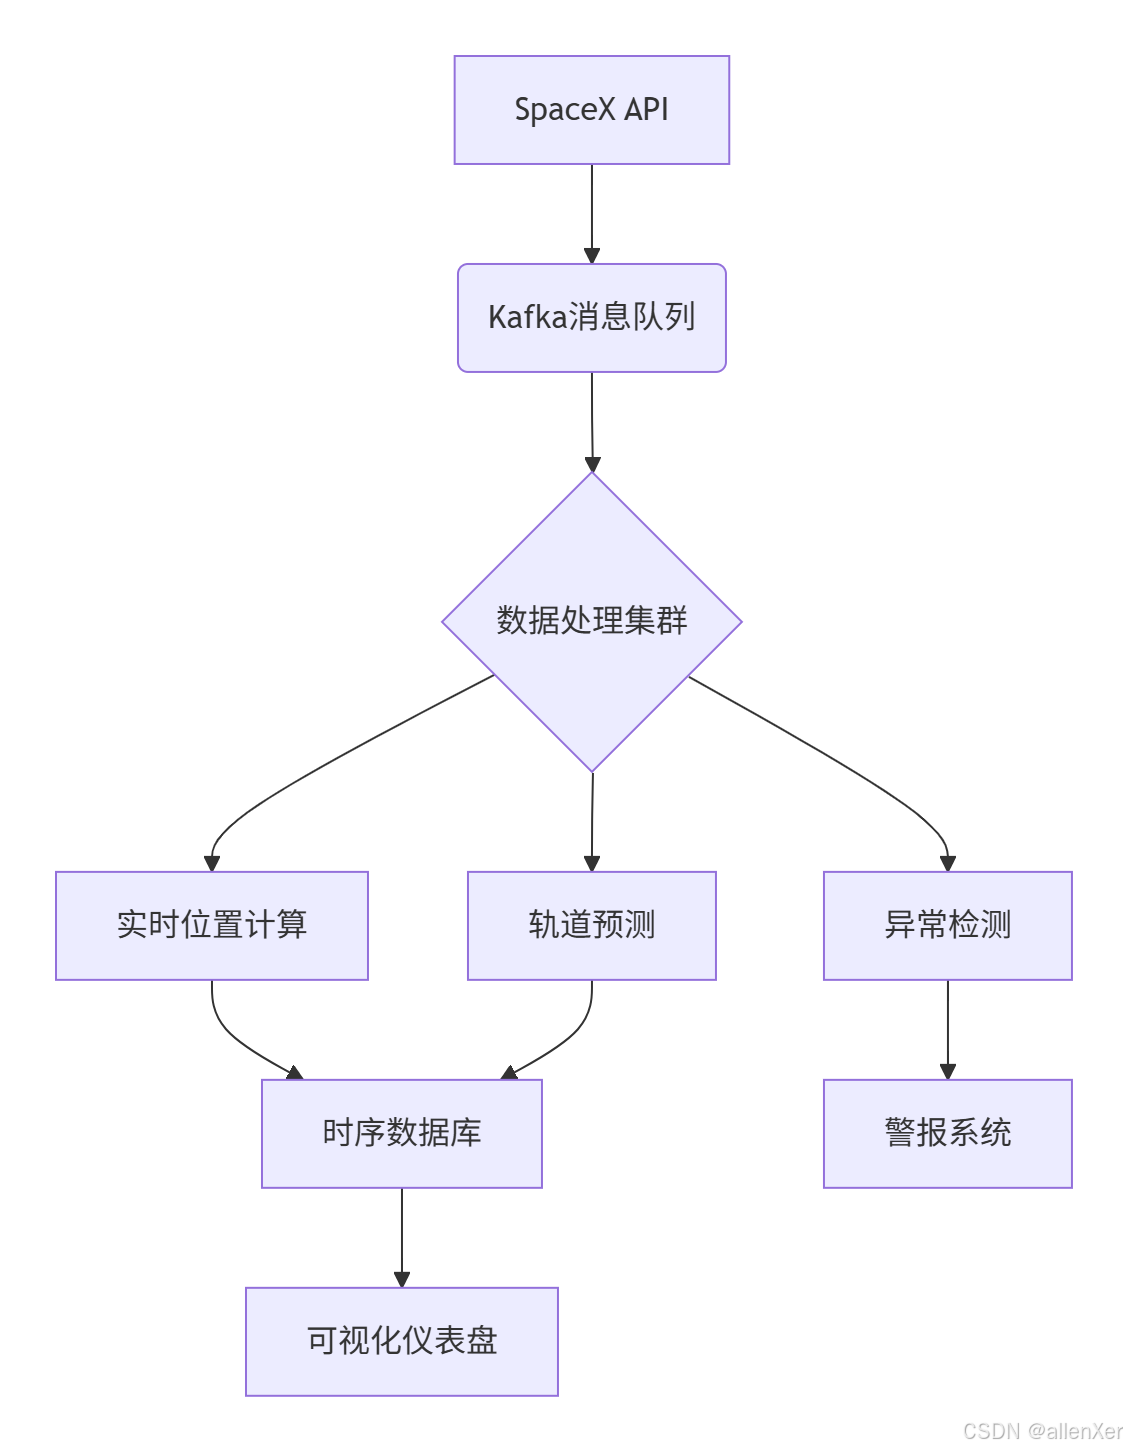
animate_satellite_movement('5eed770f096e59000698560d')四、工业级优化:高性能卫星追踪系统
1. 系统架构设计
2. 分布式数据采集
import requests
from kafka import KafkaProducer
import json
import timedef produce_satellite_data():"""将卫星数据发送到Kafka"""producer = KafkaProducer(bootstrap_servers='localhost:9092',value_serializer=lambda v: json.dumps(v).encode('utf-8'))while True:try:# 获取卫星数据url = "https://api.spacexdata.com/v4/starlink"response = requests.get(url)satellites = response.json()# 发送到Kafkafor sat in satellites:producer.send('satellite-positions', sat)print(f"发送{len(satellites)}条卫星数据")time.sleep(60)  # 每分钟更新except Exception as e:print(f"数据采集失败: {str(e)}")time.sleep(300)  # 5分钟后重试# 启动数据采集
# produce_satellite_data()
3. 使用时序数据库存储
from influxdb_client import InfluxDBClient, Point
from influxdb_client.client.write_api import SYNCHRONOUSdef save_to_influxdb(satellite):"""将卫星数据保存到InfluxDB"""client = InfluxDBClient(url="http://localhost:8086", token="my-token", org="my-org")write_api = client.write_api(write_options=SYNCHRONOUS)point = Point("satellite_position") \.tag("satellite_id", satellite['id']) \.tag("name", satellite['spaceTrack']['OBJECT_NAME']) \.field("latitude", satellite['latitude']) \.field("longitude", satellite['longitude']) \.field("height_km", satellite['height_km']) \.field("velocity_kms", satellite['velocity_kms']) \.time(satellite['spaceTrack']['EPOCH'])write_api.write(bucket="satellite_data", record=point)client.close()
4. 轨道预测算法
import numpy as np
from scipy.integrate import odeintdef satellite_orbit(satellite, hours=24):"""预测卫星未来轨道"""# 初始状态r0 = [satellite['latitude'], satellite['longitude'], satellite['height_km']]v0 = [satellite['velocity_kms'], 0, 0]  # 简化模型# 时间点t = np.linspace(0, hours*3600, 100)# 微分方程def model(state, t):x, y, z, vx, vy, vz = state# 地球引力常数mu = 3.986004418e5  # km^3/s^2r = np.sqrt(x**2 + y**2 + z**2)ax = -mu * x / r**3ay = -mu * y / r**3az = -mu * z / r**3return [vx, vy, vz, ax, ay, az]# 求解轨道solution = odeint(model, [*r0, *v0], t)return solution[:, 0], solution[:, 1], solution[:, 2]
五、实时监控仪表盘
1. 使用Dash创建卫星追踪器
import dash
from dash import dcc, html
from dash.dependencies import Input, Output
import plotly.graph_objects as go
import requests
import pandas as pd
import numpy as npapp = dash.Dash(__name__)app.layout = html.Div([html.H1("星链卫星实时追踪系统"),dcc.Dropdown(id='satellite-selector',options=[],value=None,multi=True),dcc.Graph(id='live-globe'),dcc.Graph(id='orbit-prediction'),dcc.Interval(id='interval-component',interval=10 * 1000,  # 10秒更新n_intervals=0)
])@app.callback(Output('satellite-selector', 'options'),Input('interval-component', 'n_intervals')
)
def update_satellite_list(n):"""更新卫星列表"""url = "https://api.spacexdata.com/v4/starlink"response = requests.get(url)satellites = response.json()options = [{'label': sat['spaceTrack']['OBJECT_NAME'], 'value': sat['id']} for sat in satellites]return options@app.callback([Output('live-globe', 'figure'),Output('orbit-prediction', 'figure')],[Input('satellite-selector', 'value'),Input('interval-component', 'n_intervals')]
)
def update_plots(selected_ids, n):"""更新图表"""# 获取所有卫星数据url = "https://api.spacexdata.com/v4/starlink"response = requests.get(url)satellites = response.json()# 创建地球globe_fig = create_globe_figure(satellites, selected_ids)# 创建轨道预测orbit_fig = create_orbit_figure(satellites, selected_ids)return globe_fig, orbit_figdef create_globe_figure(satellites, selected_ids):"""创建3D地球图"""# 创建地球fig = go.Figure(go.Scattergeo())# 添加所有卫星all_lats = [sat['latitude'] for sat in satellites]all_lons = [sat['longitude'] for sat in satellites]all_names = [sat['spaceTrack']['OBJECT_NAME'] for sat in satellites]fig.add_trace(go.Scattergeo(lon=all_lons,lat=all_lats,text=all_names,mode='markers',marker=dict(size=4,color='blue',opacity=0.5),name='所有卫星'))# 添加选中的卫星if selected_ids:selected_sats = [sat for sat in satellites if sat['id'] in selected_ids]sel_lats = [sat['latitude'] for sat in selected_sats]sel_lons = [sat['longitude'] for sat in selected_sats]sel_names = [sat['spaceTrack']['OBJECT_NAME'] for sat in selected_sats]fig.add_trace(go.Scattergeo(lon=sel_lons,lat=sel_lats,text=sel_names,mode='markers',marker=dict(size=8,color='red'),name='选中卫星'))# 更新布局fig.update_layout(title='星链卫星实时位置',geo=dict(projection_type='orthographic',showland=True,landcolor="rgb(212, 212, 212)",showocean=True,oceancolor="rgb(127, 205, 255)",showcountries=True))return figdef create_orbit_figure(satellites, selected_ids):"""创建轨道预测图"""fig = go.Figure()if selected_ids:for sat_id in selected_ids:satellite = next((sat for sat in satellites if sat['id'] == sat_id), None)if satellite:# 预测轨道lats, lons, heights = satellite_orbit(satellite)# 添加轨道fig.add_trace(go.Scatter3d(x=lons,y=lats,z=heights,mode='lines',name=f"{satellite['spaceTrack']['OBJECT_NAME']}轨道"))# 添加当前位置fig.add_trace(go.Scatter3d(x=[satellite['longitude']],y=[satellite['latitude']],z=[satellite['height_km']],mode='markers',marker=dict(size=5, color='red'),name=f"{satellite['spaceTrack']['OBJECT_NAME']}当前位置"))# 更新布局fig.update_layout(title='卫星轨道预测',scene=dict(xaxis_title='经度',yaxis_title='纬度',zaxis_title='高度 (km)',camera=dict(eye=dict(x=1.5, y=1.5, z=0.1))),height=600)return figif __name__ == '__main__':app.run_server(debug=True)
六、避坑指南:卫星数据获取常见错误
1. 错误案例:频繁请求导致API限制
# 反例:高频请求
while True:data = requests.get(api_url)# 处理数据time.sleep(0.1)  # 每秒10次请求# 结果:IP被封锁# 正解:遵守API限制
import time
while True:data = requests.get(api_url)# 处理数据time.sleep(60)  # 每分钟1次请求
2. 错误案例:忽略数据时效性
# 反例:使用过期数据
data = get_satellite_data()
# 1小时后仍然使用同一数据# 正解:检查时间戳
def is_data_fresh(data, max_age=300):"""检查数据是否新鲜"""latest_timestamp = max(sat['spaceTrack']['EPOCH'] for sat in data)current_time = time.time()return (current_time - latest_timestamp) < max_age
3. 错误案例:坐标转换错误
# 反例:直接使用经纬度绘制3D位置
x = longitude
y = latitude
z = height_km# 正解:转换为笛卡尔坐标
def spherical_to_cartesian(lat, lon, height):"""球坐标转笛卡尔坐标"""# 地球半径R = 6371  # km# 转换为弧度lat_rad = np.radians(lat)lon_rad = np.radians(lon)# 计算笛卡尔坐标x = (R + height) * np.cos(lat_rad) * np.cos(lon_rad)y = (R + height) * np.cos(lat_rad) * np.sin(lon_rad)z = (R + height) * np.sin(lat_rad)return x, y, z
七、工业级应用:卫星通信模拟系统
1. 卫星覆盖范围计算
def calculate_coverage(satellite, ground_point):"""计算卫星对地面点的覆盖情况"""# 卫星位置sat_pos = spherical_to_cartesian(satellite['latitude'],satellite['longitude'],satellite['height_km'])# 地面点位置ground_pos = spherical_to_cartesian(ground_point['lat'],ground_point['lon'],0)# 计算距离distance = np.linalg.norm(np.array(sat_pos) - np.array(ground_pos))# 计算仰角elevation = np.degrees(np.arcsin((np.dot(sat_pos, ground_pos)) / (distance * np.linalg.norm(ground_pos))))# 判断是否可见return elevation > 5 # 仰角大于5度可见2. 全球覆盖可视化
def plot_global_coverage(satellites):"""可视化全球覆盖情况"""# 创建网格lats = np.arange(-90, 90, 1)lons = np.arange(-180, 180, 1)# 计算覆盖矩阵coverage = np.zeros((len(lats), len(lons)))for i, lat in enumerate(lats):for j, lon in enumerate(lons):covered = Falsefor sat in satellites:if calculate_coverage(sat, {'lat': lat, 'lon': lon}):covered = Truebreakcoverage[i, j] = 1 if covered else 0# 创建热力图fig = go.Figure(go.Heatmap(x=lons,y=lats,z=coverage,colorscale=[[0, 'gray'], [1, 'green']],showscale=False))fig.update_layout(title='星链全球覆盖图',xaxis_title='经度',yaxis_title='纬度',height=600)fig.show()3. 延迟计算模型
def calculate_latency(satellite, ground_point1, ground_point2):"""计算两点间通过卫星的通信延迟"""# 计算距离sat_pos = spherical_to_cartesian(satellite['latitude'],satellite['longitude'],satellite['height_km'])point1_pos = spherical_to_cartesian(ground_point1['lat'],ground_point1['lon'],0)point2_pos = spherical_to_cartesian(ground_point2['lat'],ground_point2['lon'],0)dist1 = np.linalg.norm(np.array(sat_pos) - np.array(point1_pos))dist2 = np.linalg.norm(np.array(sat_pos) - np.array(point2_pos))# 计算延迟(光速:299792 km/s)latency = (dist1 + dist2) / 299792 * 1000 # 毫秒return latency结语:成为太空数据征服者
通过本指南,您已掌握:
- 🛰️ SpaceX API调用技巧
- 📡 卫星数据获取与解析
- 🌍 3D地球可视化技术
- 🚀 轨道预测算法
- ⚡ 实时监控系统开发
- 📶 通信延迟计算
下一步行动:
- 部署你的卫星追踪系统
- 添加更多卫星数据源
- 开发通信优化算法
- 构建预测模型
- 分享你的太空发现