鸿蒙开发中 渲染范围的控制
鸿蒙(HarmonyOS)应用开发中,渲染范围控制是提升UI性能的核心,通过精准控制组件的更新范围,避免不必要的重绘,从而显著提升帧率(FPS)和响应速度。
一、渲染范围控制的核心原理
1. 鸿蒙的渲染流程
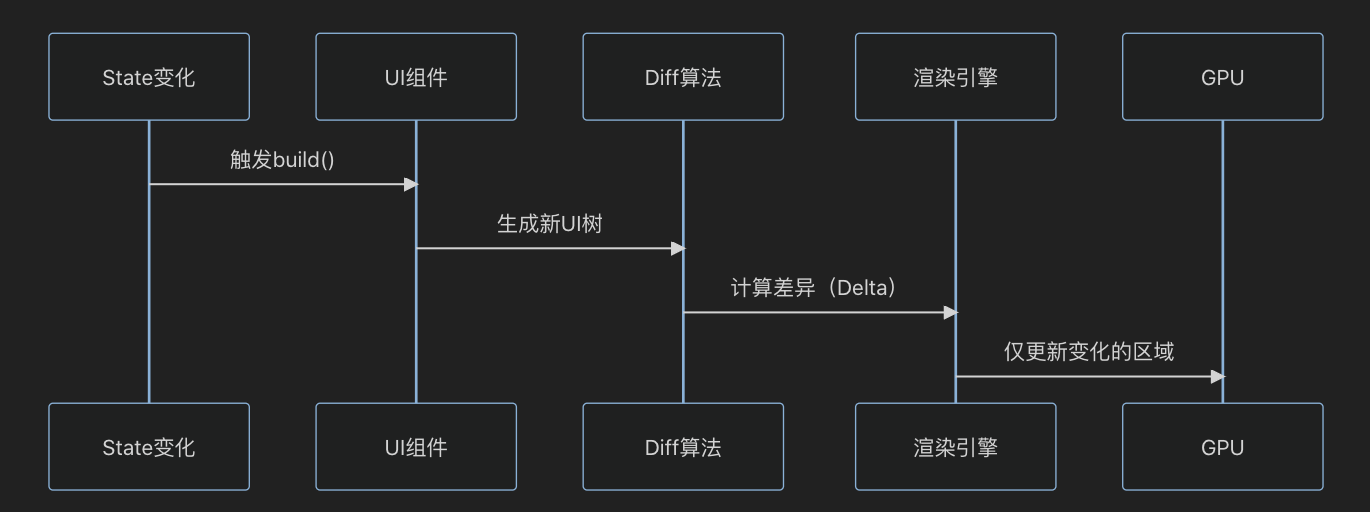
2. 关键优化点
- 减少Diff计算量:缩小需要对比的UI树范围。
- 避免过度渲染:跳过未变化的子树。
二、基础篇:状态管理与局部更新
1. 最小化状态更新范围
@Entry
@Component
struct OptimizedCounter {@State private count: number = 0;  // 仅count变化时重绘build() {Column() {// 只有这个Text会更新Text(`Count: ${this.count}`).fontSize(20)Button('Add').onClick(() => {this.count += 1;  // 修改状态触发精准更新}).margin(10)// 静态组件不会重绘Text('Static Content').fontColor(Color.Gray)}}
}
2. @Prop 与 @Link 的对比
| 装饰器 | 数据流 | 更新范围 | 适用场景 |
|---|---|---|---|
@Prop | 父→子单向 | 子组件及其后代 | 数据只读传递 |
@Link | 父↔子双向 | 父子组件及关联子树 | 表单双向绑定 |
示例:@Prop 传递数据
@Entry
@Component
struct Parent {@State message: string = 'Hello';build() {Column() {Child({ msg: this.message }) // 父组件状态变化时,Child及其子组件更新}}
}@Component
struct Child {@Prop msg: string; // 单向接收build() {Text(this.msg)}
}
三、中级优化:条件渲染
1. 动态组件卸载
@Entry
@Component
struct SmartToggle {@State showDetail: boolean = false;build() {Column() {if (this.showDetail) {HeavyComponent()  // 完全卸载避免内存占用}Button(this.showDetail ? 'Hide' : 'Show').onClick(() => this.showDetail = !this.showDetail)}}
}@Component
struct HeavyComponent {build() {// 复杂子组件List({ space: 20 }) {ForEach(new Array(100), (_, index) => {ListItem() {Text(`Item ${index}`).height(100)}})}}
}
2. ForEach 列表渲染优化
问题:全量更新列表导致性能下降。
优化方案:使用 LazyForEach + cachedCount 复用组件。
@Entry
@Component
struct OptimizedList {@State data: string[] = Array(1000).fill('').map((_,i) => `Item ${i}`);build() {List({ space: 5 }) {LazyForEach(this.data, (item) => {ListItem() {ListItemContent({ text: item })  // 提取子组件}}, item => item)  // 关键:设置唯一key}.cachedCount(15)    // 预渲染数量.edgeEffect(EdgeEffect.None)  // 禁用过度效果}
}@Component
struct ListItemContent {@Prop text: string;build() {Text(this.text).height(80).width('90%').backgroundColor('#FFF')}
}四、高级篇:自定义渲染控制
1. 精准属性更新
场景:仅更新对象的特定属性,避免整个组件重绘。
@Observed
class UserModel {@Track name: string = '';  // 仅跟踪必要属性@Track age: number = 0;address: string = '';      // 非响应式属性constructor(name: string, age: number) {this.name = name;this.age = age;}
}@Entry
@Component
struct UserProfile {@State user: UserModel = new UserModel('Alice', 25);build() {Column() {UserInfo({ user: this.user })Button('Change Age').onClick(() => {this.user.age += 1;  // 仅触发age相关更新})}}
}@Component
struct UserInfo {@ObjectLink user: UserModel;build() {Column() {Text(`Name: ${this.user.name}`).fontSize(18)Text(`Age: ${this.user.age}`).fontColor('#FF0000')}}
}更新范围:仅Age文本组件重绘。
2. 手动控制更新:markNeedUpdate
适用场景:需要绕过自动Diff的极端性能优化。
@Component
struct ManualRenderControl {private dirtyFlag: boolean = false;private renderCount: number = 0;aboutToRender() {if (!this.dirtyFlag) {return false;  // 阻止本次渲染}this.dirtyFlag = false;return true;}forceUpdate() {this.dirtyFlag = true;this.markNeedUpdate();  // 手动触发}build() {Column() {Text(`RenderCount: ${this.renderCount++}`)Button('Force Update').onClick(() => this.forceUpdate())}}
}适用场景:高频数据更新时的节流控制。
五、性能分析工具链
1. 工具组合方案
| 工具 | 功能 | 使用命令 |
|---|---|---|
| DevEco Profiler | 组件级渲染耗时分析 | 内置可视化工具 |
| SmartPerf | 系统级帧率监控 | adb shell smartperf start |
| HiTrace | 跨组件调用链路追踪 | hiTraceMeter.startTrace() |
2. 性能问题定位流程
- 使用UI Inspector发现无效重绘
- 通过CPU Profiler定位耗时函数
- 用Memory Profiler检查内存泄漏
- Systrace分析系统级阻塞
六、案例:电商首页优化
优化前问题
- 首屏加载耗时1200ms
- 滚动卡顿(FPS 28)
- 内存峰值380MB
优化措施
- 组件拆分:将大页面拆分为12个LazyLoad组件
- 列表优化:
LazyForEach(data, item => {ProductItem({ data: item }) // 复用组件}, item => item.id) // 关键key.cachedCount(8)3. 图片加载
Image(item.img).syncLoad(true) // 同步加载.priority(ImagePriority.High)七、总结
状态管理黄金法则:
- 最小化
@State使用范围 - 优先使用
@Prop单向传递 - 复杂对象用
@Observed+@ObjectLink
- 最小化
列表渲染必做项:
LazyForEach + cachedCount + key