R语言绘图 | 使用scplotter包绘制细胞间通信图
原文教程:R语言绘图 | 使用scplotter包绘制细胞间通信图
前言
关于scplotter包,在前面的教程分享过。但是,绝大部分同学,也许就一带而过(PS:包括自己)。其实,很多时候,我们会收藏很多的教程,推文等,但绝大多数都是在“吃灰”。
此教程,我们分享使用scplotter包中<font style="color:rgb(53, 148, 247);">CCCPlot()</font>函数绘制<font style="color:rgb(53, 148, 247);">Cell-Cell Communication Plot</font>。
教程网址:
https://pwwang.github.io/scplotter/reference/CCCPlot.html
code
##'@安装R包remotes::install_github(“pwwang/scplotter”)# ordevtools::install_github(“pwwang/scplotter”)# or using conda#$ conda install pwwang::r-scplotter
1. Usage
CCCPlot( data, plot_type = c(“dot”, “network”, “chord”, “circos”, “heatmap”, “sankey”, “alluvial”), method = c(“aggregation”, “interaction”), magnitude = waiver(), specificity = waiver(), weighted = TRUE, meta_specificity = “sumlog”, split_by = NULL, x_text_angle = 90, link_curvature = 0.2, link_alpha = 0.6, facet_by = NULL, show_row_names = TRUE, show_column_names = TRUE,…)
2. Examples
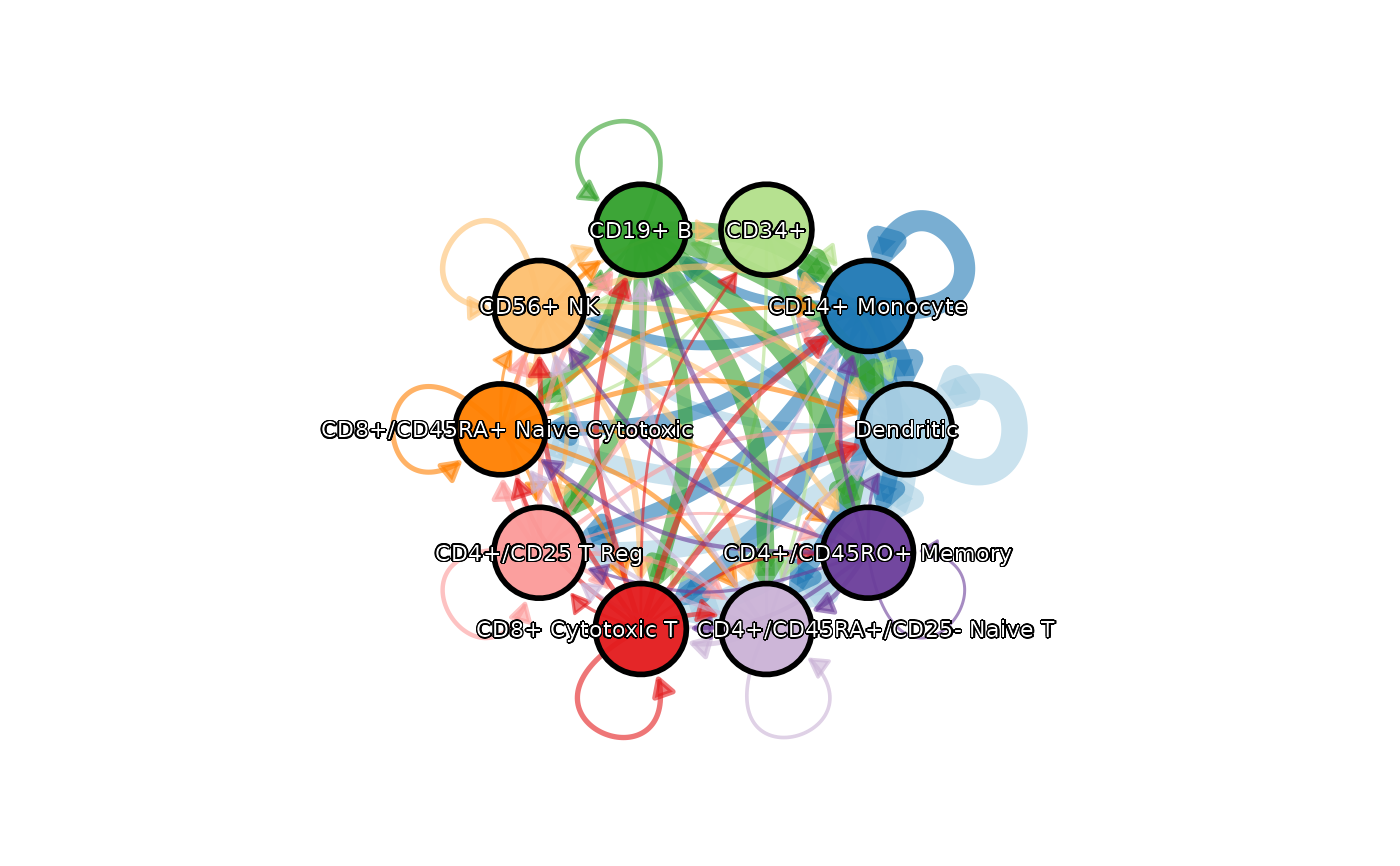
set.seed(8525)data(cellphonedb_res)CCCPlot(data = cellphonedb_res, plot_type = “network”, legend.position = “none”, theme = “theme_blank”, theme_args = list(add_coord = FALSE))
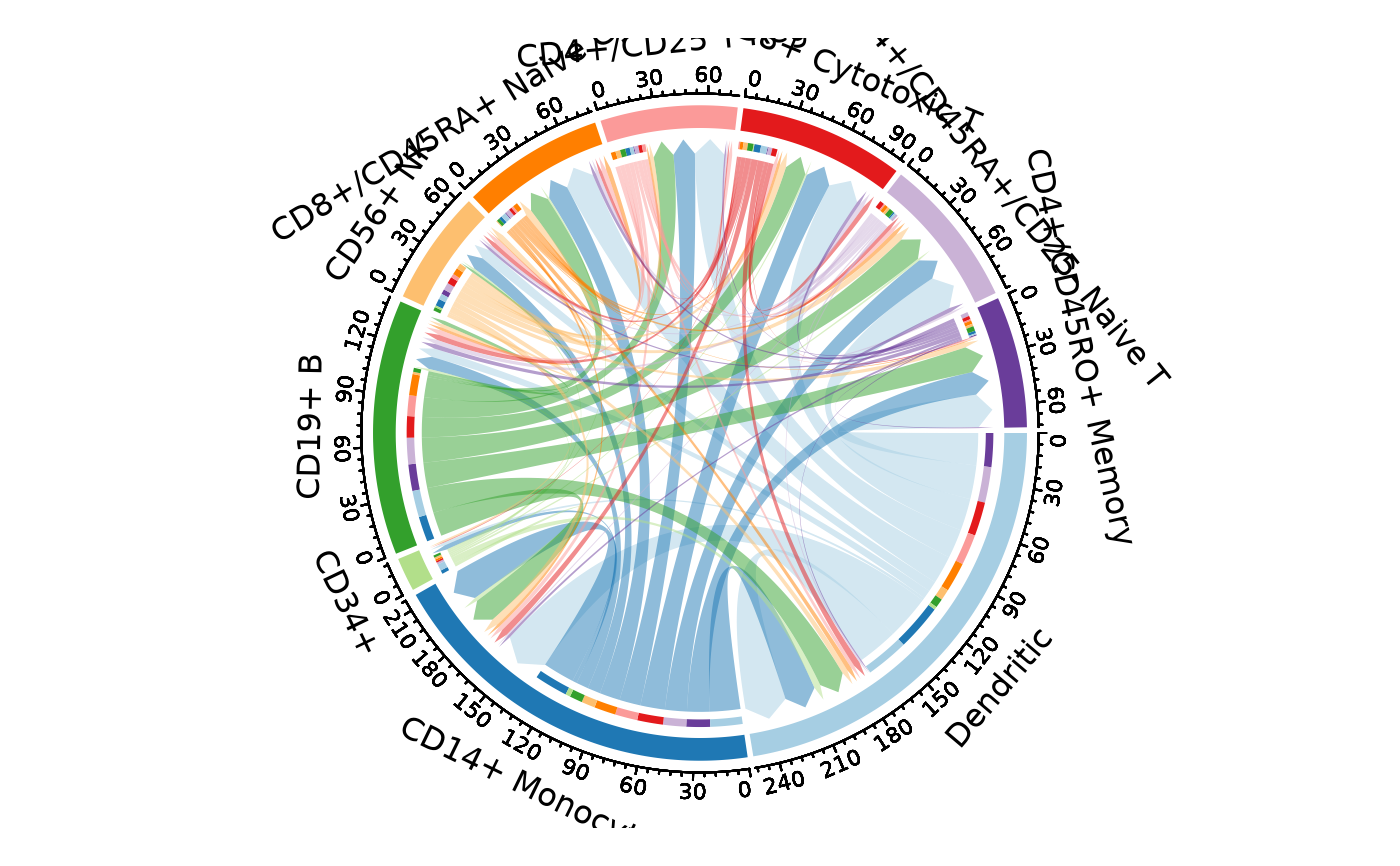
CCCPlot(cellphonedb_res, plot_type = “chord”)
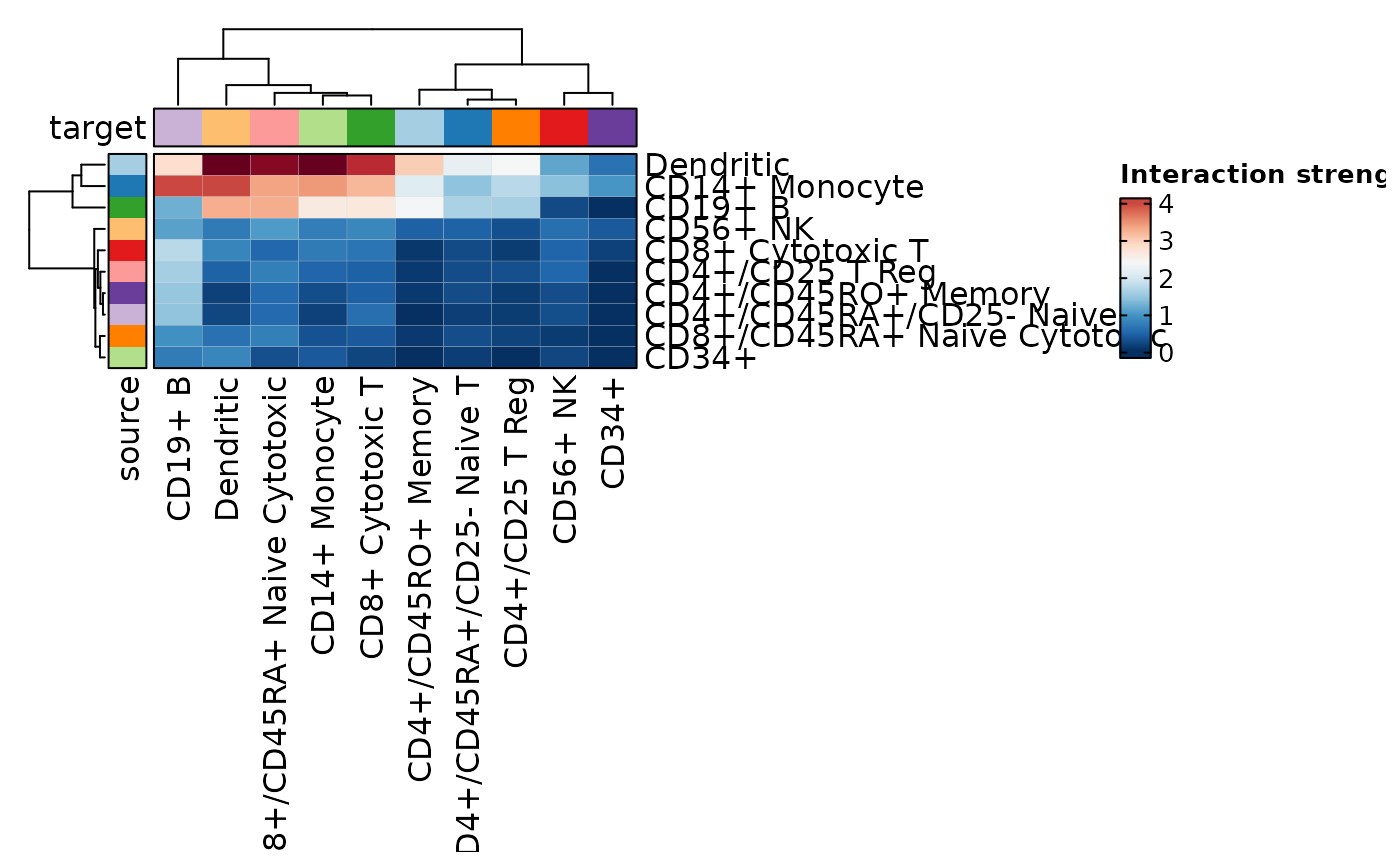
CCCPlot(cellphonedb_res, plot_type = “heatmap”)
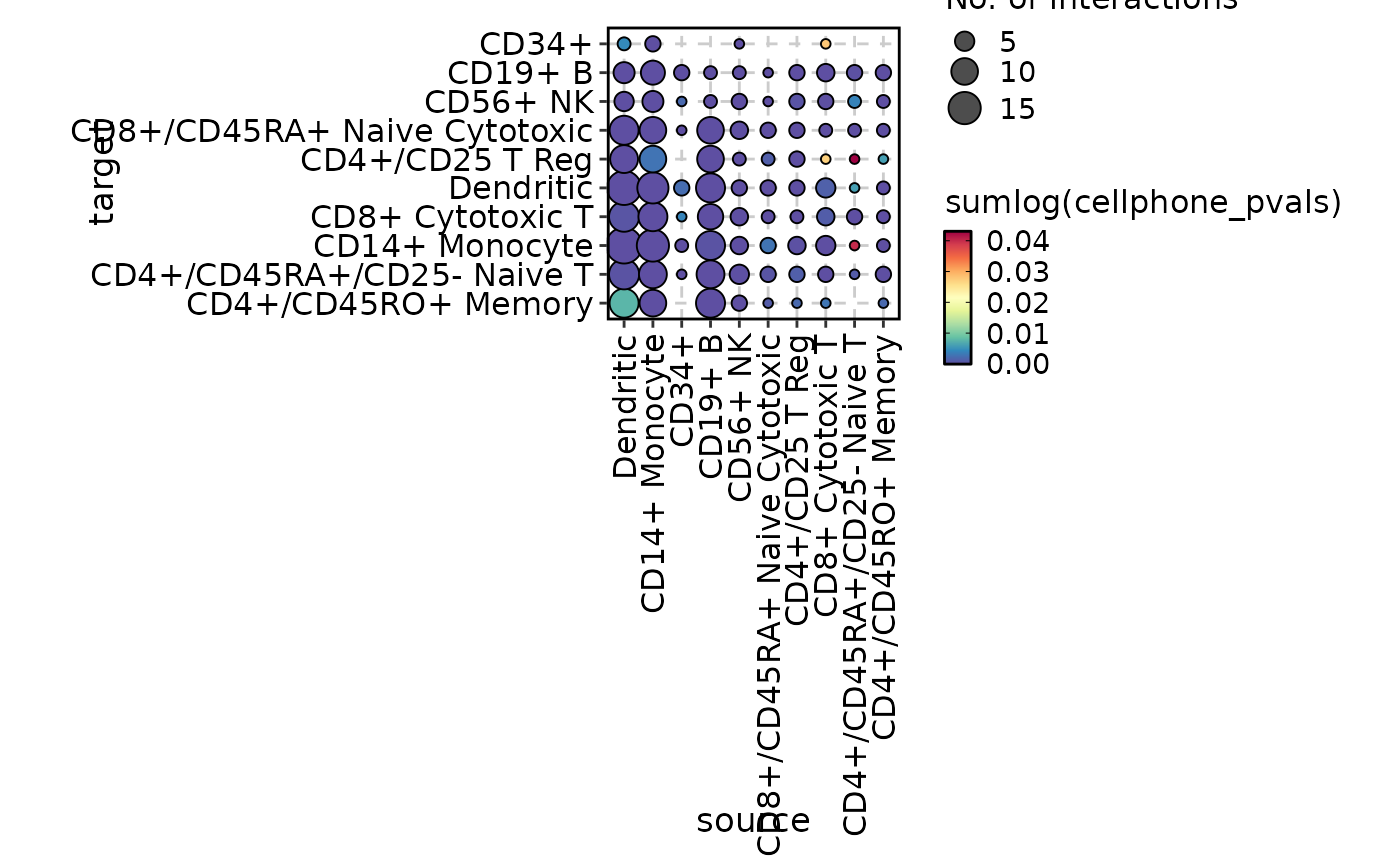
CCCPlot(cellphonedb_res, plot_type = “dot”, weighted = FALSE)
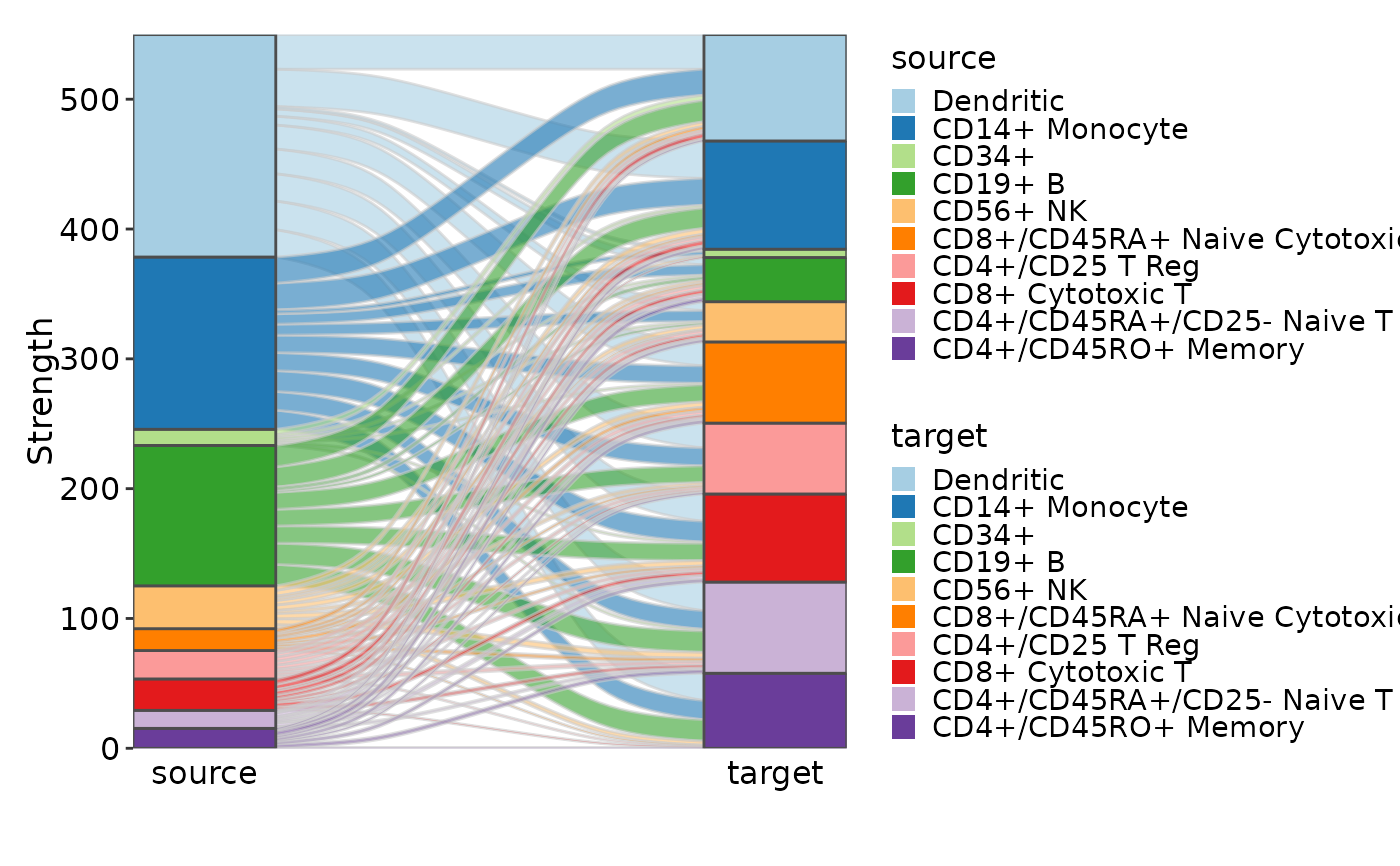
CCCPlot(cellphonedb_res, plot_type = “sankey”)
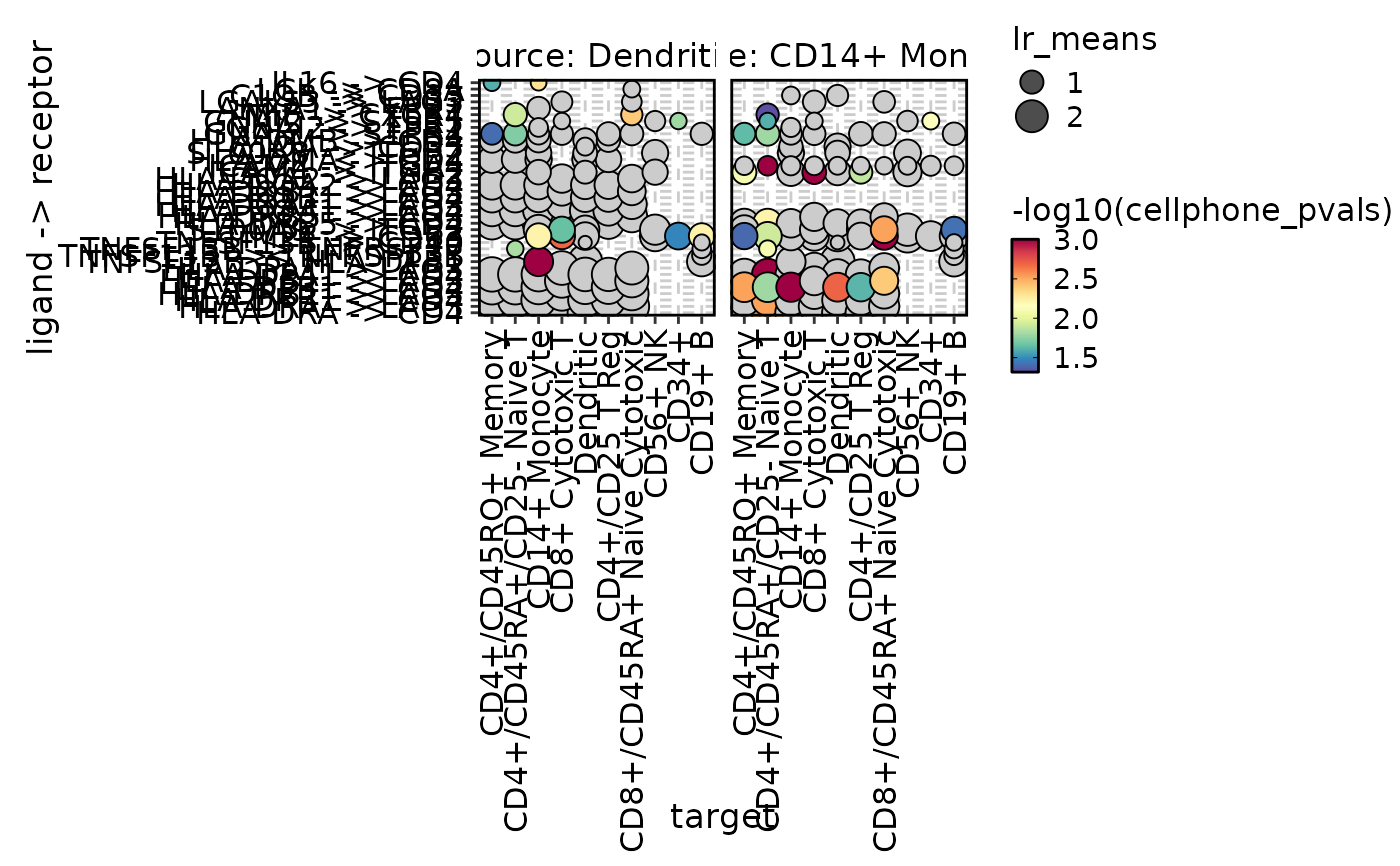
cellphonedb_res_sub <- cellphonedb_res[ cellphonedb_res$source %in% c(“Dendritic”, “CD14+ Monocyte”),]CCCPlot(cellphonedb_res_sub, plot_type = “dot”, method = “interaction”)
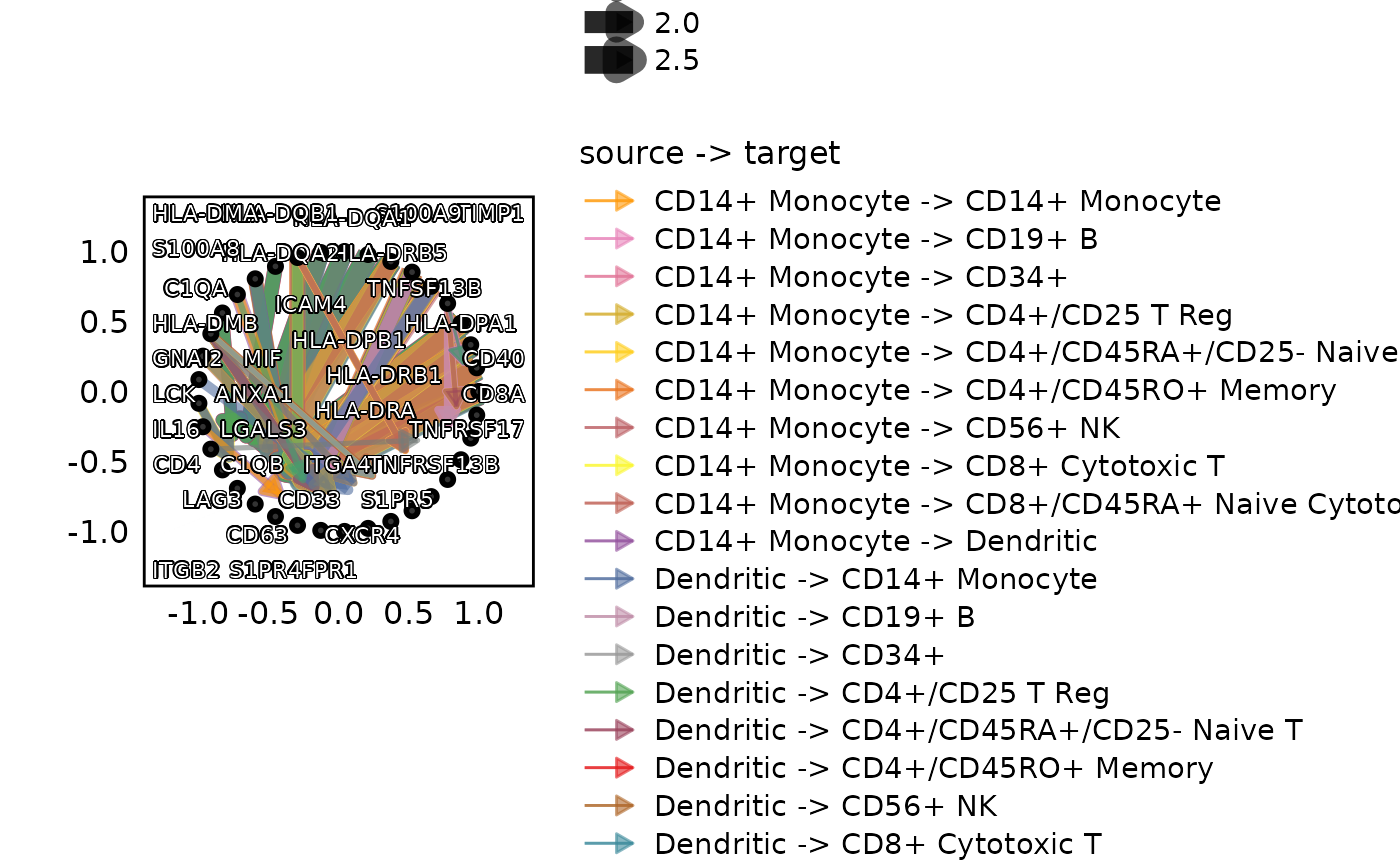
CCCPlot(cellphonedb_res_sub, plot_type = “network”, method = “interaction”, node_size_by = 1)
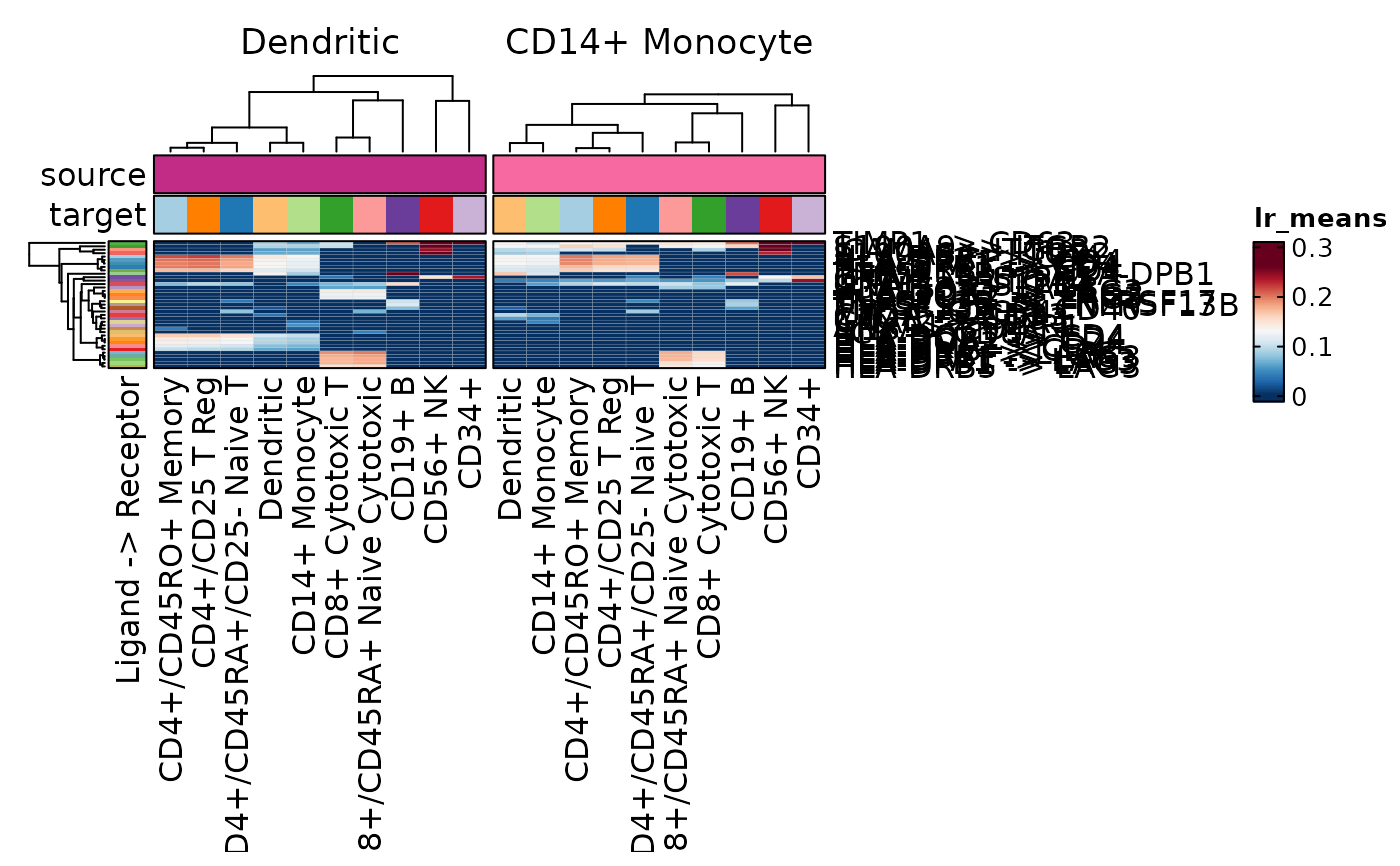
CCCPlot(cellphonedb_res_sub, plot_type = “heatmap”, method = “interaction”)
教程网址:
https://pwwang.github.io/scplotter/reference/CCCPlot.html
往期部分文章
1. 最全WGCNA教程(替换数据即可出全部结果与图形)
- WGCNA分析代码六
推荐大家购买最新的教程,若是已经购买以前WGNCA教程的同学,可以在对应教程留言,即可获得最新的教程。(注:此教程也仅基于自己理解,不仅局限于此,难免有不恰当地方,请结合自己需求,进行改动。)
2. 精美图形绘制教程
- 精美图形绘制教程
- 《R语言绘图专栏–50+图形绘制教程》
3. 转录组分析教程
- 转录组上游分析教程[零基础]
- 一个转录组上游分析流程 | Hisat2-Stringtie
- Samll RNA上游分析
4. 转录组下游分析
- 批量做差异分析及图形绘制 | 基于DESeq2差异分析
- GO和KEGG富集分析
- 单基因GSEA富集分析
- 全基因集GSEA富集分析
小杜的生信筆記 ,主要发表或收录生物信息学教程,以及基于R分析和可视化(包括数据分析,图形绘制等);分享感兴趣的文献和学习资料!!