行星际激波特征分析及其在太阳风激波自动检测算法开发与优化中的应用
Characterizing interplanetary shocks for development and optimization of an automated solar wind shock detection algorithm
Abstract
Human evaluation of solar wind data for interplanetary (IP) shock identification relies on both heuristics and pattern recognition, with the former lending itself to algorithmic representation and automation. Such detection algorithms can potentially alert forecasters of approaching shocks, providing increased warning of subsequent geomagnetic storms. However, capturing shocks with an algorithmic treatment alone is challenging, as past and present work demonstrates. We present a statistical analysis of 209 IP shocks observed at L1, and we use this information to optimize a set of shock identification criteria for use with an automated solar wind shock detection algorithm. In order to specify ranges for the threshold values used in our algorithm, we quantify discontinuities in the solar wind density, velocity, temperature, and magnetic field magnitude by analyzing 8 years of IP shocks detected by the SWEPAM and MAG instruments aboard the ACE spacecraft. Although automatic shock detection algorithms have previously been developed, in this paper we conduct a methodical optimization to refine shock identification criteria and present the optimal performance of this and similar approaches. We compute forecast skill scores for over 10,000 permutations of our shock detection criteria in order to identify the set of threshold values that yield optimal forecast skill scores. We then compare our results to previous automatic shock detection algorithms using a standard data set, and our optimized algorithm shows improvements in the reliability of automated shock detection.
Key Points
- Statistical analysis of interplanetary shocks in 8 years of ACE data
- Development of automated interplanetary shock detection algorithm
- Use of forecast skill scores to evaluate four IP shock detection algorithms
对人类评估太阳风数据以识别行星际(IP)激波的研究依赖于启发式方法和模式识别,其中前者更易于算法表示和自动化。此类检测算法可提前预警即将到来的激波,从而为后续地磁风暴提供更长的预警时间【意义】。然而,如过去和当前研究表明,仅通过算法处理捕获激波具有挑战性【问题】。本文对L1点观测到的209个IP激波进行了统计分析,并利用这些信息优化了一套用于自动化太阳风激波检测算法的激波识别标准。为了确定算法中阈值范围,本文通过分析ACE航天器上SWEPAM和MAG仪器8年的IP激波数据,量化了太阳风密度、速度、温度和磁场强度的不连续性。尽管此前已有自动激波检测算法被开发,但本文通过系统化优化改进识别标准,并展示了此类方法的最优性能。本文计算了超过10,000种激波检测标准组合的预报技能评分,以确定能产生最优评分的最佳阈值组合。随后,本文使用标准数据集将优化后的算法与既往算法对比,结果显示其在自动化激波检测可靠性上有所提升。
关键点
- 基于ACE数据8年IP激波的统计分析
- 开发自动化行星际激波检测算法
- 利用预报技能评分评估四种IP激波检测算法
Introduction
Interplanetary (IP) shocks are traveling shocks in which plasma moves across the boundary but the density, velocity, and temperature are discontinuous across the boundary [Baumjohann and Treumann, 1997]. IP shocks are often associated with space weather phenomena such as Interplanetary Coronal Mass Ejections (ICMEs) and Co-rotating Interaction Regions (CIRs). Interplanetary shocks accompanying ICMEs are followed by a driver gas and often contain a magnetic flux rope that can have a strong southward IMF component and, consequently, produce significant geomagnetic storms [Burlaga, 1995; Webb, 2004; Kappenman, 2005]. Echer and Gonzalez [2004] argue that 22% of all IP shocks are intensely geoeffective while 35% are moderately geoeffective. When acting in concert with magnetic clouds, those numbers become 43% and 38%, respectively. It is also known that faster ejecta are more likely to drive shocks and to have a higher potential for generating geoeffective events. Thus, from a space weather perspective, the ability to quickly and accurately identify IP shocks is critical, allowing for improvements in the speed and reliability with which space weather warnings and alerts are issued.
Several previous studies have developed algorithms to automatically identify IP shocks using in situ data [Neugebauer et al., 2003; Vorotnikov et al., 2008, 2011; Kruparova et al., 2013]. Vorotnikov et al. [2008] sought to develop a practical space weather tool that could provide useful shock information, without operator intervention, within 1 min of having the necessary data. Threshold values for the percentage jump in velocity, temperature, and proton density were empirically selected based on the weakest shocks in their 1999 data set, and these were set to 1.5%, 15%, and 20%, respectively. Satisfying these threshold conditions, along with exceeding a combined threshold of 68% (summing the percentage jump of all three parameters), comprises the first two steps in Vorotnikov's seven-step process designed to automatically detect (steps 1 and 2) and then analyze (steps 3–7) IP shocks in solar wind data. Testing their algorithm on 4 years of ACE Level-2 data from 1999 to 2002, they find 42% of all shocks previously identified by the ACE MAG/SWEPAM team, with a false positive rate of 23%.
行星际(IP)激波是等离子体穿越边界时密度、速度和温度出现不连续性的传播激波。这类激波常与行星际日冕物质抛射(ICMEs)和共转相互作用区(CIRs)等空间天气现象相关。伴随ICMEs的IP激波后方通常存在驱动气体,且往往包含具有强南向IMF分量的磁通量绳,从而引发显著地磁风暴。Echer和Gonzalez[2004]研究表明,22%的IP激波具有强地磁效应,35%为中等效应;若与磁云共同作用,比例分别升至43%和38%。此外,高速抛射物质更易驱动激波并产生强地磁事件。因此,从空间天气预警角度看,快速准确识别IP激波对提升预警时效性和可靠性至关重要。
先前研究已开发多种基于原位数据的自动IP激波识别算法。Vorotnikov等[2008]开发的空间天气工具可在数据获取后1分钟内无需人工干预提供激波信息。其算法基于1999年数据集中最弱激波经验设定了速度、温度和质子密度的跳跃阈值(分别为1.5%、15%和20%),并需满足三参数总跳跃阈值68%。该七步流程的前两步用于自动检测激波,后五步用于分析。在1999-2002年ACE二级数据测试中,算法成功识别ACE团队已标注激波的42%,假阳性率为23%。
Work by Neugebauer et al. [2003] and Kruparova et al. [2013] focused on developing autonomous on-spacecraft IP shock detection algorithms for the Genesis and Solar Orbiter missions, respectively. The Genesis solar wind sample return mission [Burnett et al., 2003] included an onboard solar wind regime identification algorithm, which used a logic-based Boolean decision tree to arrive at a solar wind regime classification and included, as part of this algorithm, criteria to determine whether or not a forward shock had recently passed the spacecraft [Neugebauer et al., 2003]. Shock passage was deemed to have occurred when three conditions were met: velocity increased by 40 km/s, the ratio of the density upstream to downstream of the shock was greater than 1.4, and the ratio of the temperature upstream to downstream of the shock was greater than 1.5. These values were chosen to identify strong shocks with a low rate of false positives. Detailed validation and verification analysis of this shock identification scheme was not presented as part of their published results; however, the efficacy of this approach is quantified in section 4 of this paper.
More recently, Kruparova et al. [2013] reported on the development of an IP shock detection algorithm to be used onboard the upcoming Solar Orbiter mission [Müller et al., 2013]. Their algorithm uses a two-step method to identify IP shocks in a real-time data stream regardless of the shock type. In the first step, a quality factor is assigned to the shock candidate based on jumps in the moving averages of the density, velocity, and magnetic field magnitude, along with weighting factors for each parameter. The sum of the products of the weighting factors with the percentage difference of each parameter forms the quality factor, which is then compared against a specified threshold value to determine whether a shock is observed. This differs from the approach taken in previous studies in which threshold values for each parameter are set individually and each threshold must be met in order for the observed discontinuity to be classified as a shock. In the second step of Kruparova's algorithm, additional constraints on the individual parameters are applied to the candidate shocks in order to reduce the number of false positives. The algorithm was validated using 8 years of Wind data, and they obtained a final detection rate, defined as the number of “real” shocks divided by the total number of shock candidates, that ranged from 29% to 64% depending on the value used for the threshold of the quality factor.
Neugebauer等人[2003]和Kruparova等人[2013]的工作分别专注于为Genesis和Solar Orbiter任务开发星载自主IP激波检测算法。Genesis太阳风样本返回任务包含一个机载太阳风状态识别算法,该算法采用基于逻辑的布尔决策树进行太阳风状态分类,并在此算法中设置了判断前向激波是否近期通过航天器的标准。激波通过的判定需满足三个条件:速度增加40 km/s、激波上下游密度比大于1.4、激波上下游温度比大于1.5。这些阈值旨在识别强激波并降低误报率。该激波识别方案的详细验证分析未在其发表成果中体现,但本文第4节量化了该方法的有效性。
Kruparova等人[2013]近期报道了为即将开展的Solar Orbiter任务开发的IP激波检测算法。他们的算法采用两步法实时识别各类IP激波:第一步根据密度、速度和磁场强度移动平均值的跃变及参数权重因子,为候选激波分配质量因子。权重因子与各参数百分比差异的乘积之和构成质量因子,通过与设定阈值比较判断激波是否存在。此方法不同于以往研究(需单独满足各参数阈值)。第二步对候选激波施加额外参数约束以减少误报。该算法使用8年Wind数据验证,最终检测率(定义为“真实”激波数与候选总数之比)根据质量因子阈值取值介于29%至64%。
Most of the previous work has focused on detecting the greatest number of real shocks while minimizing the number of false positives. However, the use of different data sets and different measures of success makes it difficult to compare the skill of the above algorithms for a given set of standardized criteria.
In this paper, we present the following:
- A statistical analysis of discontinuities associated with IP shocks in 8 years of ACE solar wind data to provide context and insight into threshold values for automated detection algorithms.
- A methodical optimization approach to identify the set of threshold values that yield optimal forecast skill scores.
- Traditional measures of forecast skill used by the meteorological community applied to several IP shock detection algorithms in order to quantify the strengths and weaknesses of the various shock detection approaches.
- A unified metric by which past, present, and future algorithms with variable inputs can be compared.
既往研究大多关注最大化真实激波检测率同时最小化误报,但数据集和成功标准的差异导致难以在统一标准下比较算法性能。
本文贡献如下:
- 对ACE太阳风数据中8年IP激波间断性的统计分析,为自动检测算法阈值提供依据;
- 系统优化方法确定可产生最优预报技能评分的阈值组合;
- 采用气象学界传统预报技能指标量化不同激波检测算法的优劣;
- 建立统一评估标准,用于比较过去、现在及未来可变输入的算法。
Our goal is to optimize IP shock identification criteria for an automated shock detection algorithm fed by real-time solar wind data from the Deep Space Climate Observatory (DSCOVR) spacecraft. DSCOVR will serve as an operational follow-on mission to NASA's Advanced Composition Explorer (ACE), providing real-time 1 s magnetometer (B_mag) measurements and 3 s proton density, velocity, and temperature (n, V, T) measurements. Absent from DSCOVR is an instrument capable of measuring velocity dispersion, such as the Electron, Proton, and Alpha Monitor (EPAM) detector aboard ACE. This lack of an EPAM-type instrument rules out some traditional approaches to shock detection which rely on energetic particle flux measurements.
We describe efforts to develop an algorithm that can automatically identify potential shocks within in situ solar wind measurements from a real-time solar wind monitor upstream of the Earth. In section 2, we present a statistical analysis of 209 interplanetary shocks identified by the ACE Science Center or on Richardson and Cane's list of Near-Earth ICMEs. From our analysis, we derive initial criteria for identifying IP shocks within our algorithm. Section 3 discusses the specifics of the automatic shock detection algorithm. In section 4, we discuss the forecast skill measures which are used to optimize and evaluate the shock detection algorithm. Section 5 presents our methodical optimization approach in which we arrive at the optimal threshold parameters based on forecast skill scores, and in section 6, we compare our results to those of other shock detection algorithms. Section 7 presents an analysis of the results as well as a discussion of the false positives and overall objectives of the algorithm. The conclusions and future work are given in section 8.
本研究目标是为基于DSCOVR航天器实时太阳风数据的自动激波检测算法优化IP激波识别标准。DSCOVR将接替NASA的ACE卫星,提供1秒分辨率磁强计(B_mag)数据和3秒分辨率质子密度、速度及温度(n, V, T)数据。但DSCOVR缺乏ACE搭载的EPAM探测器等速度色散测量设备,这排除了依赖高能粒子通量测量的传统激波检测方法。
我们致力于开发一种算法,能够从地球上游实时太阳风监测数据中自动识别潜在激波。第2节分析了ACE科学中心或Richardson与Cane近地ICME列表确认的209个行星际激波,据此制定算法初始识别标准;第3节阐述自动激波检测算法的具体实现;第4节讨论用于算法优化与评估的预报技能指标;第5节提出基于预报技能评分的系统阈值优化方法;第6节与其他激波检测算法结果对比;第7节分析结果并讨论误报问题及算法整体目标;第8节总结结论与未来工作。
2 Statistical Analysis of Interplanetary Shock Data
The first step in developing an empirical algorithm to automatically detect IP shocks within real-time solar wind data is to characterize the behaviors of previously observed shocks in order to define a range of typical shock parameters. For this statistical analysis, we use 8 years of ACE data from 1998 to 2006. During this 8 year period, only half of the data is used to build shock statistics, while the other half of the data is reserved for testing and validating the algorithm. In this way, the same data is not used to build the shock statistics and to validate the results, thus preventing over specifying the data set. In order to include data from all portions of the solar cycle in both the training and the validation data sets, odd numbered months were used for training the algorithm and building shock statistics, while even numbered months were reserved for validation purposes. While care was taken to ensure that we obtained as unbiased results as possible, individual shock lists are created with somewhat different methodologies (thus two shock lists from the same spacecraft during the same time period are generally not identical). For this reason, we note that our algorithm has a slight advantage, given that it was trained using the same shock lists (though not the same portion of the shock lists) that each of the algorithms are tested on.
开发一种基于经验算法的自动IP激波实时检测方法,第一步需通过分析历史激波数据表征典型激波参数范围。本次统计分析使用1998至2006年共8年的ACE数据,其中半数数据用于构建激波统计特征,另一半保留用于算法测试与验证,从而避免数据过拟合。为确保训练集与验证集均覆盖太阳活动周期所有阶段,奇数月份数据用于算法训练与统计构建,偶数月份数据专用于验证。尽管本文力求获得无偏差结果,但不同激波列表因方法论差异(同一时段同一航天器的两份列表通常不完全一致)存在区别。因此需说明:本算法具有轻微优势,因其训练使用的激波列表(虽非相同部分)与测试算法所用的列表一致。
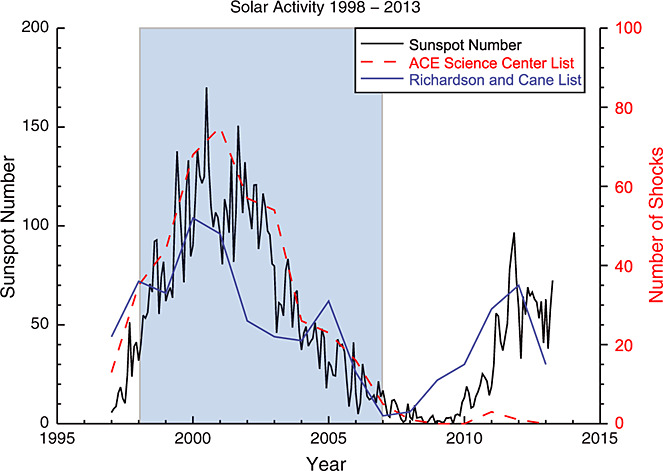
Figure 1 shows a plot of the solar activity in terms of both sunspot numbers and the number of shocks per year. In general, the number of IP shocks per year follows the sunspot number, which is often used as a proxy for solar activity. Sunspot numbers were obtained from the National Geophysical Data Center's website (Sunspot Number Data | NCEI) and are plotted in black. The number of IP shocks per year was obtained from two different sources: the red dashed line shows shock data from the ACE Science Center's List of Disturbances and Transients (ACE Lists of Disturbances and Transients), while the blue solid line shows data obtained from Richardson and Cane's list of Near-Earth ICMEs (List of Richardson/Cane ICMEs Since January1996). The years of data highlighted in blue are used for this study, with the odd numbered months used for building IP shock statistics and the even numbered months used for validation and testing. We limit our sample size to shocks occurring before 2007 because these years have the greatest number of interactive shock analyses against which to test the performance of an automated algorithm. Note that the ACE Science Center's List of Disturbances and Transients contains a more complete list of IP shocks before 2007. After 2007, the ACE Science Center list does not designate as many solar wind discontinuities as the Richardson and Cane list. However, it is important to note that the Richardson and Cane list is a list of geomagnetic disturbances, many of which are the result of CME-driven shocks. All forward shocks and disturbances identified on both lists were considered. A full discussion of the way in which the data was handled follows below.
图1展示了以太阳黑子数和年激波数量衡量的太阳活动周期。总体而言,IP激波年数量与常作为太阳活动替代指标的黑子数趋势一致。黑子数数据来自美国国家地球物理数据中心网站(以黑线绘制),年激波数则源自两个渠道:红色虚线表示ACE科学中心扰动与瞬变事件列表的数据,蓝色实线为Richardson与Cane近地ICME列表的数据。蓝色高亮部分(1998–2006年)为本研究采用的数据,其中奇数月份用于构建IP激波统计,偶数月份用于验证测试。本文将样本限制在2007年之前的激波,因这些年份拥有最丰富的人工交互式激波分析结果,可用于检验自动化算法性能。需注意:2007年前的ACE科学中心列表包含更完整的IP激波记录,而此后其标注的太阳风间断性事件少于Richardson与Cane列表。但需强调,Richardson与Cane列表实为地磁扰动列表,其中许多事件由CME驱动激波引发。研究涵盖两份列表中所有前向激波与扰动,具体数据处理方式详见下文。
Figure 1 The solar cycle shown both in terms of the sunspot number (black line) and the number of shocks per year (red and blue lines). Shocks per year are obtained from the ACE Science Center's List of Disturbances and Transients (red dashed line) and the Richardson and Cane list of Near-Earth Interplanetary Coronal Mass Ejections (ICMEs) (blue line). The years of data (1998–2006) used in the shock statistics are shown highlighted in blue. Odd numbered months from this period were used for building shock statistics, and even numbered months were used for testing and validation purposes.
图1 以太阳黑子数(黑线)和年激波数量(红蓝线)展示的太阳活动周期。年激波数分别取自ACE科学中心扰动与瞬变列表(红色虚线)与Richardson与Cane近地ICME列表(蓝线)。蓝色高亮部分(1998–2006年)为激波统计所用数据,其中奇数月份用于构建统计,偶数月份用于测试验证。
For the first part of this study the 278 shocks and solar wind disturbances identified on one or both of the above-mentioned shock lists were examined and the overall change, as well as the percentage change, in the proton density, proton speed, temperature, and magnetic field magnitude of each of the discontinuities were evaluated. Out of the 278 events in this sample, 42 were reverse shocks and were not included in the statistics. For the remaining 236 events, the statistics-building routine was not able to detect clearly discernable and simultaneous jumps in the plasma parameters near the listed time for 27 of the specified shocks. Of the 27 events for which a clear discontinuity was not observed, in 26 of these only the time of the associated geomagnetic storm sudden commencement was listed on the Richardson and Cane ICME list. Events for which only a geomagnetic disturbance time was listed were manually inspected and, if a discontinuity was observed, the time was recorded; otherwise, these events were not included in the shocks statistics. After excluding reverse shocks and cases for which no clear discontinuity in the solar wind parameters was observed, we are left with 209 events which comprise the sample size in our statistical analysis.
Of these 209 events included in this statistical analysis:
- 70 events are listed on both the ACE Science Center list and Richardson and Cane list
- 96 events are listed only on the ACE Science Center list and not on the Richardson and Cane list
- 43 events are listed on the Richardson and Cane list while not on the ACE Science Center list
本研究第一阶段对上述激波列表中278个激波与太阳风扰动事件进行了分析,评估了每个间断点处质子密度、质子速度、温度及磁场强度的绝对变化与百分比变化。样本中42个反向激波被排除统计,剩余236个事件中有27个在列表标注时间附近未检测到等离子体参数的清晰同步跃变。在这27个事件中,26个仅在Richardson与Cane的ICME列表中标注了伴随的地磁暴急始时间。此类仅标注地磁扰动时间的事件经人工核查后,若观察到间断性则记录时间,否则排除统计。最终剔除反向激波和无明确参数跃变的案例后,209个事件构成统计分析的有效样本。
这209个事件的分布如下:
- 70个事件同时出现在ACE科学中心列表和Richardson与Cane列表
- 96个事件仅见于ACE科学中心列表
- 43个事件仅见于Richardson与Cane列表
For each shock event considered, SWEPAM 64 s data and MAG 16 s data are used to quantify the shock discontinuity in terms of the jump in density, velocity, temperature, and magnetic field magnitude. Data upstream Xu(t) and downstream Xd(t) of the discontinuity are averaged in 5 min averages according to:
where X(l) represents the solar wind parameter, X, at time l, and m = 5 for the 64 s cadence SWEPAM data while m = 20 for the 16 s cadence MAG data, resulting in a 5 min mean both upstream and downstream of the discontinuity for all parameters of interest. X^d(t) is the downstream 5 min average at a time t for parameter X, while X^u(t) is the upstream 5 min average at a time t for parameter X. Four solar wind parameters were examined: the magnetic field magnitude, the proton density, proton speed, and proton temperature. Comparison between the upstream and downstream mean values is used to identify the overall change, ΔX(t), and the percentage change, %ΔX(t), in the solar wind parameters of interest. Comparison of two running averages is done as the characteristic signal of interest is a step function. For each of the above listed parameters, the percentage change was computed according to
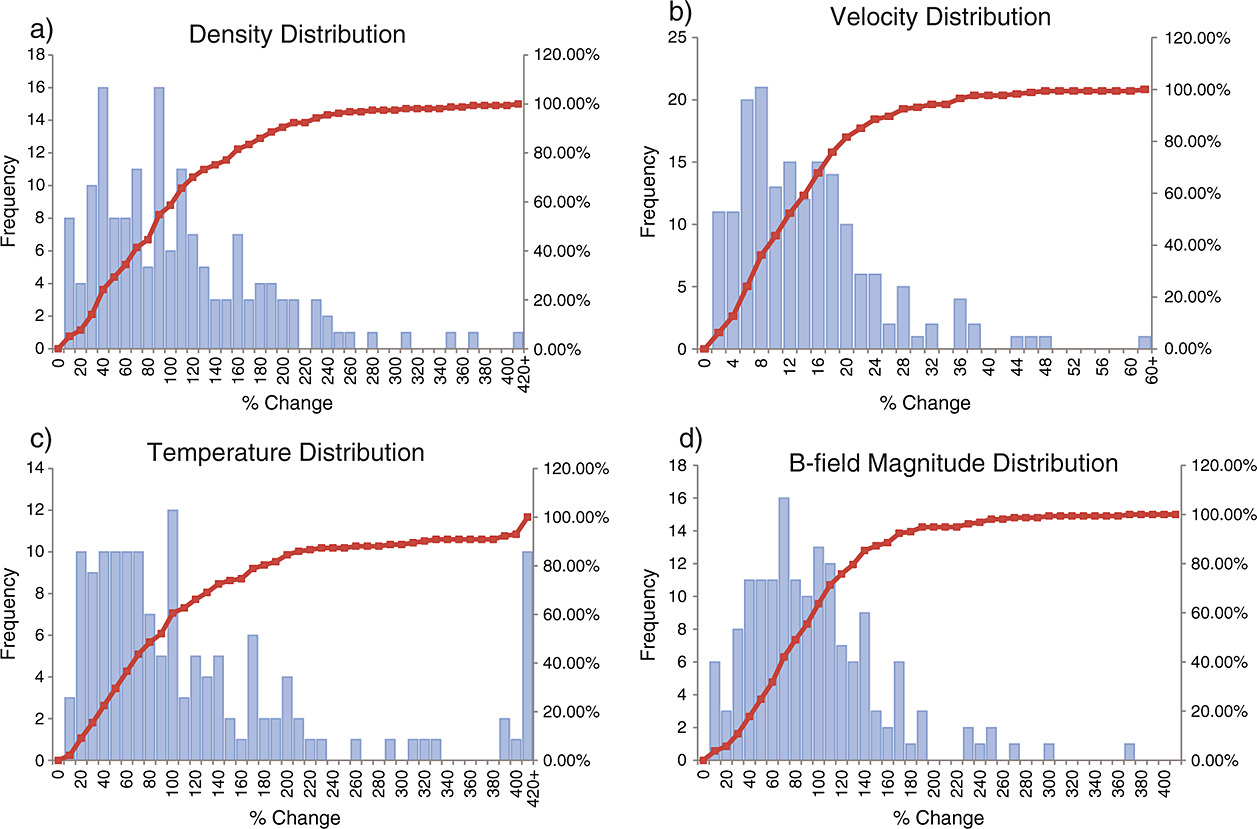
The statistics-building routine looks at 10 min on either side of the specified shock time for the maximum jump in each of the four solar wind parameters of interest. The time of the maximum %ΔX(t) is recorded. If the maximum jump for two or more parameters occurs at the same time (defined as within one data point or 64 s of each other), or if the jump in the B_mag is greater than 10% when only MAG data is available, then the values for the jump in those solar wind parameters are recorded and incorporated into the shock statistics. If the maximum jumps observed for all four solar wind parameters occur at different times, the shock is not recorded and not included in the set of shock statistics. The shock statistics given here represent a sample of 209 events where the shock boundary is clearly discernable in at least two solar wind parameters. Table 1 gives a summary of statistics for the sample of shocks and distribution plots of the data are presented in Figure 2. In the distribution plots, the blue bars represent the number of shocks for which a given %ΔX(t) was observed for the parameter of interest. The red line shows the cumulative percentage of shocks with a %ΔX(t) at or less than the given value.
对于每个研究的激波事件,使用SWEPAM 64秒分辨率数据和MAG 16秒分辨率数据,通过密度、速度、温度及磁场强度的跃变来量化激波间断性。间断点上游X^u(t)与下游X^d(t)的数据按以下公式计算5分钟平均值:
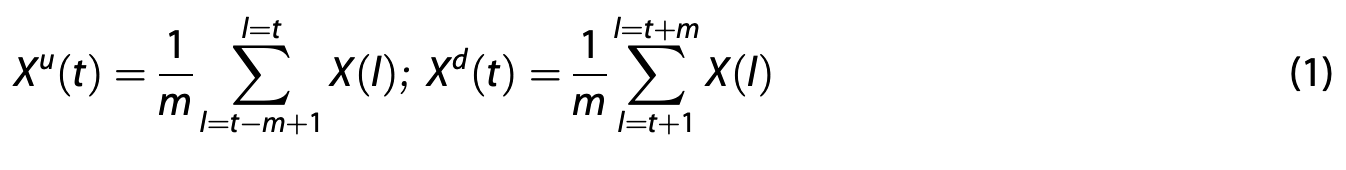
其中X(l)表示时间l处的太阳风参数X,对于64秒采样的SWEPAM数据取m=5,对于16秒采样的MAG数据取m=20,最终得到所有目标参数在间断点两侧的5分钟均值。X^d(t)为参数X在时间t处的下游5分钟均值,X^u(t)为对应上游5分钟均值。分析的四个太阳风参数包括:磁场强度、质子密度、质子速度和质子温度。通过比较上下游均值,确定目标参数的绝对变化ΔX(t)与百分比变化%ΔX(t)。采用滑动平均比较法是因为目标信号特征为阶跃函数。各参数的百分比变化按下式计算:
![]()
统计构建程序在标注激波时间点的前后10分钟区间内,寻找上述四个参数的最大跃变值,并记录最大%ΔX(t)对应的时间。若两个及以上参数的最大跃变发生在同一时间(定义为间隔不超过一个数据点或64秒),或仅MAG数据可用时B_mag跃变超过10%,则记录这些参数的跃变值并纳入激波统计。若所有四个参数的最大跃变出现于不同时间,则该激波不予记录且不包含在统计集中。本文的激波统计基于209个事件样本,这些事件的激波边界至少在两个太阳风参数中清晰可辨。表1汇总了激波样本的统计特征,图2展示了参数的分布直方图。直方图中蓝色柱状图表示观测到特定%ΔX(t)的激波数量,红色曲线显示%ΔX(t)小于或等于给定值的累积百分比。
Table 1. Mean and Standard Deviation of %ΔX(t) for the Given Solar Wind Parameters Across 209 Shocks Observed From 1998 to 2006
| Parameter | Mean | Standard Deviation | Minimum | Maximum |
|---|---|---|---|---|
| Density | 100% | 74% | 2% | 403% |
| Velocity | 14% | 11% | 0.4% | 83% |
| Temperature | 135% | 175% | 0.3% | 1447% |
| Magnetic field | 91% | 59% | 0.5% | 365% |
| Sum of B, D, V, T [a] | 136% | 239% | 38% | 1760% |
- [a] For shocks with data available for all four solar wind parameters.
Figure 2 Distribution plots of the solar wind parameters. (a) Density, (b) velocity, (c) temperature, and (d) magnitude of the magnetic field. A total of 209 shocks from 1998 to 2006 are included in the sample size. The blue bars represent the number of times a given percentage change was observed for the parameter of interest. The red line shows the cumulative percentage of shocks with a percentage change in the given parameter that is at or below the given value.
图2 太阳风参数分布直方图。(a)密度,(b)速度,(c)温度,(d)磁场强度。样本包含1998至2006年的209个激波。蓝色柱状图表示各参数特定百分比变化对应的激波出现次数,红色曲线表示该参数百分比变化≤给定值的累积百分比。
In their recent paper, Kruparova et al. [2013] plot histograms of the changes in the density, velocity, and magnetic field magnitude near each shock for 266 shocks observed with the Wind spacecraft and recorded on Justin Kasper's shock list (CfA Interplanetary Shock Database). In their paper, they obtain mean values for the difference in density (51%), velocity (10%), and magnetic field (47%), respectively. Overall, these values are smaller than those found in our study, and this is due to a difference in the way in which the %ΔX(t) is computed in each paper. Kruparova et al. [2013] compute the change in each parameter by taking the absolute value of the change |Xd(t) − Xu(t)| and dividing it by the average value over the discontinuity. This gives the percentage difference, while we compute the percentage change from the pre-shock value. This difference in method for calculating the change in the pre- and post-shock values accounts for observed differences between the Kruparova et al. [2013] results and those presented here. While both methods are valid, we opted to compute the percentage change due to the nature of the system being flow driven, and the observer witnessing a change from pre- to post-shock values.
We also compare our values to the typical shock compression ratios stated by Kallenrode [2001], who reported a characteristic density compression ratio of 2.0 and a typical magnetic compression ratio of 1.9. Converting our values from a mean percentage change into a compression ratio gives a density compression ratio of 2.00 and a magnetic compression ratio of 1.91. These results are in good agreement with those stated by Kallenrode [2001].
Kruparova等人[2013]近期论文中绘制了Wind航天器观测的266个激波(源自Justin Kasper激波数据库)附近密度、速度及磁场强度变化的直方图。其研究得出这些参数的平均变化值分别为密度(51%)、速度(10%)和磁场(47%)。总体而言,这些数值小于本研究结果,原因在于两篇论文中%ΔX(t)的计算方法不同。Kruparova等人[2013]通过计算变化绝对值 |X^d(t)−X^u(t)| 除以间断点两侧平均值得到百分比差异,而本研究采用相对于激波前值的百分比变化。这种计算方法差异解释了双方结果的差别。尽管两种方法均有效,本文选择百分比变化计算,因系统本质为流动驱动,且观测者关注的是激波前后值的变化。
本文还与Kallenrode[2001]提出的典型激波压缩比进行对比。该文献指出特征密度压缩比为2.0,典型磁场压缩比为1.9。将本研究的平均百分比变化转换为压缩比后,得到密度压缩比2.00和磁场压缩比1.91,与Kallenrode[2001]的结果高度一致。
3 Shock Detection Algorithm
The numerical algorithm developed here to automatically detect IP shocks reads in ACE SWEPAM and MAG data at a 64 s and 16 s cadence, respectively. The data is averaged in 5 min backward-moving boxcar averages, and for each time step, the difference between upstream and downstream 5 min averages is computed (equation 1). Next, the percentage change is calculated according to equation 2 and compared to pre-specified threshold values. Interpolation is used to fill in data gaps, and the algorithm looks for simultaneous jumps within the proton density, proton speed, temperature, and magnetic field magnitude. When the percentage change meets or exceeds the threshold values for three or four of the plasma parameters, the algorithm then checks if a combined threshold has also been met before classifying the observed discontinuity as a shock.
To account for missing data and maximize shock detection, two combined thresholds are specified:
- A threshold requiring all four solar wind parameters meet or exceed their individual thresholds
- A second threshold for cases where only three out of four parameters exceed their thresholds
Additionally, for cases where only magnetic field data is available, a stand-alone B_mag threshold is defined. If %ΔB exceeds this threshold, the discontinuity is classified as a shock regardless of other parameters. A summary of the algorithm is shown in Figure 3.
Figure 3 Logical flow chart of the shock detection algorithm showing the criteria required for the algorithm to classify a discontinuity as a potential shock.
图3 展示了激波检测算法的逻辑流程图,标明了分类不连续性为潜在激波所需的条件。
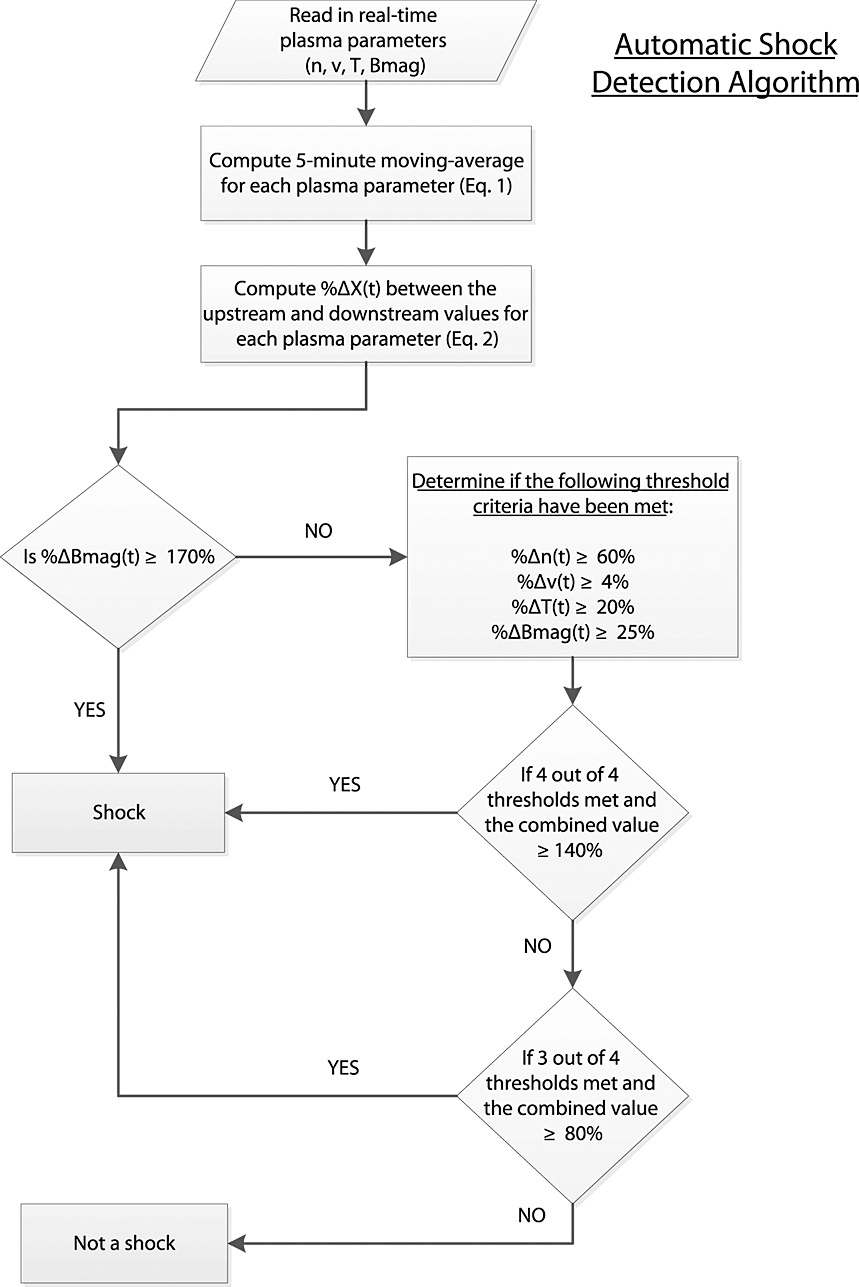
The concurrency requirement helps to reduce false positives by requiring that discontinuities in at least three of the solar wind parameters are observed at the same time or that the jump in the magnitude of the magnetic field is quite large. Using a combined threshold further reduces false positives by requiring that each parameter is not only above the threshold value, but that at least one or more of the parameters demonstrate a significant jump in the plasma or magnetic field parameters, indicating that significant discontinuities are present in the solar wind data at the given time.
此处开发的数值算法用于自动检测IP激波,其读取ACE卫星的SWEPAM和MAG数据,时间分辨率分别为64秒和16秒。数据通过5分钟向后移动的箱式平均进行平滑处理,并在每个时间步计算上游与下游5分钟平均值之间的差异(公式1)。接着,根据公式2计算百分比变化,并与预设阈值进行比较。算法使用插值填补数据缺口,并检测质子密度、质子速度、温度及磁场强度中是否出现同步跃变。当百分比变化达到或超过三个或四个等离子体参数的阈值时,算法会进一步检查组合阈值是否满足,最终将观测到的不连续性分类为激波。
为处理数据缺失并最大化激波检测,算法定义两种组合阈值:
- 要求所有四个太阳风参数均达到或超过各自独立阈值的阈值
- 针对仅三个参数超过阈值的情况设定的第二阈值
此外,若仅磁场数据可用,则定义独立的磁场阈值(B_mag阈值)。若磁场百分比变化(%ΔB)超过该阈值,无论其他参数如何,该不连续性均被分类为激波。算法流程总结见图3。
并发性要求通过以下方式减少误报:要求至少三个太阳风参数的不连续性在同一时间被观测到,或磁场强度跃变幅度足够大。组合阈值进一步降低误报率,其不仅要求各参数超过阈值,还需至少一个或多个参数在等离子体或磁场中表现出显著跃变,从而表明太阳风数据在对应时间存在显著不连续性。
4 Forecast Skill Measures
In order to evaluate the success of a given set of threshold parameters, we apply traditional measures of forecast skill used by the meteorological community [Wilks, 2006]. Such standardized forecast skill scores have several benefits. First, they provide an objective evaluation of forecast quality. The use of standard skill measures offers a way of directly comparing various algorithms and prediction methods and allows for tracking forecast performance through time. Second, forecast skill measures can be used as a diagnostic to provide insight into identifying the specific strengths and weaknesses of a given forecast system, thus allowing for necessary improvements to be made, if possible. And third, the use of standardized skill scores highlights the usefulness of a given forecast system and quantifies the errors and uncertainties inherent in the method. Forecast skill scores are the industry-accepted way of evaluating the performance of forecasting models in terrestrial weather, and they capture all of the primary considerations of forecasting: false positives, false negatives, and hits.
为评估阈值参数集的性能,本文采用气象学领域的传统预报技能指标。此类标准化技能评分具有多重优势:首先,提供客观的预报质量评估。标准技能指标可直接比较不同算法与预测方法,并支持长期跟踪预报表现。其次,技能指标可作为诊断工具,揭示特定预报系统的优势与缺陷,从而指导改进。第三,标准化评分凸显预报系统的实用性,并量化方法中固有的误差与不确定性。预报技能评分是陆地天气领域评估模型的行业标准,其涵盖预报的所有核心要素:误报(false positives)、漏报(false negatives)和命中(hits)。
Recently, the technique of quantifying forecast performance using a variety of skill score metrics based on those used by the terrestrial meteorological community has been applied to the evaluation of several space weather forecast models [Mozer and Briggs, 2003; Smith et al., 2009; Crown, 2012; Owens et al., 2013]. This shift represents a necessary and positive move for the space physics community toward adopting a standard set of forecast skill measures to allow for easy comparison between various algorithms and prediction methods.
To further encourage this trend, we use the forecast skill measures discussed by Mozer and Briggs [2003] in evaluating the skill of our automatic shock detection algorithm. The goal of this work is focused on obtaining the greatest number of matches with the least number of false positives, and hence we do not calculate the cost of forecast error to the user since this algorithm is meant as a tool for space weather forecasters and not as a replacement for them. Space weather forecasters will ultimately make the call regarding benefits and costs of issuing a warning. Our goal is to provide the forecasters with the necessary information to assist them in issuing timely and accurate space weather alerts and warnings.
近期,基于陆地气象学界使用的多种技能评分指标来量化预报性能的技术,已被应用于评估多个空间天气预报模型。这一转变代表了空间物理学界朝着采用标准化的预报技能评估体系迈出了必要且积极的步伐,以便轻松比较不同算法和预测方法。
为推进这一趋势,本文采用Mozer和Briggs[2003]讨论的预报技能指标来评估自动激波检测算法的性能。本工作的核心目标是实现最高匹配数量与最少误报数量的平衡,因此本文未计算预报误差对用户的成本,因为该算法旨在作为空间天气预报员的辅助工具而非替代品。空间天气预报员将最终权衡发布预警的收益与成本。本文的目标是为预报员提供必要信息,以协助其发布及时且准确的空间天气警报。
Mozer and Briggs [2003] explain that for the case where there is a dichotomous “yes/no” forecast, as is the case with identifying interplanetary shocks, such events lend themselves to a description in the form of a 2 × 2 contingency table. A basic 2 × 2 contingency table, shown in Table 2, relates the events that are predicted or identified by the model to those that are observed or verified by other means. The first quadrant gives the total number of cases where an event was both identified by the model and verified by other means (NHIT). The second quadrant represents the number of times where the shock was identified by the shock detection algorithm but was not listed on the either the ACE Science Center list or the Richardson and Cane list, a false positive (NFALSE). The third quadrant contains the number of events that were identified by one or both lists but were not detected by the algorithm, false negative (NMISS). The fourth quadrant is the number of times that the event was neither observed nor forecasted. For this work, the value in the fourth quadrant of not observed/not forecasted events is left blank since the occurrence of the event is much less frequent than the non-occurrence rate (case where no shock is observed). The vast majority of cases would fall into the fourth quadrant, and this number would not add to the value of forecasting an event.
Mozer和Briggs[2003]指出,对于二元"是/否"预报(如行星际激波识别),此类事件适合用2×2列联表描述。如表2所示,基础列联表将模型预测或识别的事件与其他手段观测或验证的事件关联。第一象限统计模型识别且被验证的事件数量(NHIT);第二象限为算法识别但未被ACE科学中心列表或Richardson与Cane列表收录的激波数量(NFALSE,即误报);第三象限包含被列表识别但未被算法检测到的事件数量(NMISS,即漏报);第四象限为既未观测也未预报的事件数量。本研究未填写第四象限的未观测/未预报事件值,因为事件发生率远低于无激波发生的情况。绝大多数案例会落入第四象限,此数值对事件预报价值无贡献。
Table 2. Two-By-Two Basic Contingency Table [a]
| Event Observed/Verified | |||
|---|---|---|---|
| Yes | No | ||
| Event Forecasted/Algorithm Identified | Yes | N_HIT | N_FALSE |
| No | N_MISS | ||
- [a] Defined values are used to compute forecast skill measures.
With automated IP shock detection algorithms, the goal is to maximize the number of forecasted hits (NHIT) and to minimize the number of forecasted misses (NMISS) and false positives (NFALSE). Using the values defined in the contingency table, five additional skill metrics can be defined. The below nomenclature is similar to that found in Owens et al. [2013] in their discussion of quantifying forecast skill.
The first forecast skill score is the Threat Score (TS) which is also known as the Critical Success Index (CSI). This is the ratio of the events correctly forecasted to those that were either forecasted or observed. A threat score of 1 represents a perfect system, and the worst threat score would be a score of 0.
Another way of looking at the data is to calculate the Probability of Detection (POD), which is the ratio of the number of times that an event occurs to the number of times that it was forecasted,
Again a perfect score is represented by a 1 and 0 is the worst score. Two other skill scores that can be used in evaluating automatic shock detecting algorithms are the False Alarm Rate (FAR) and the Bias (B):
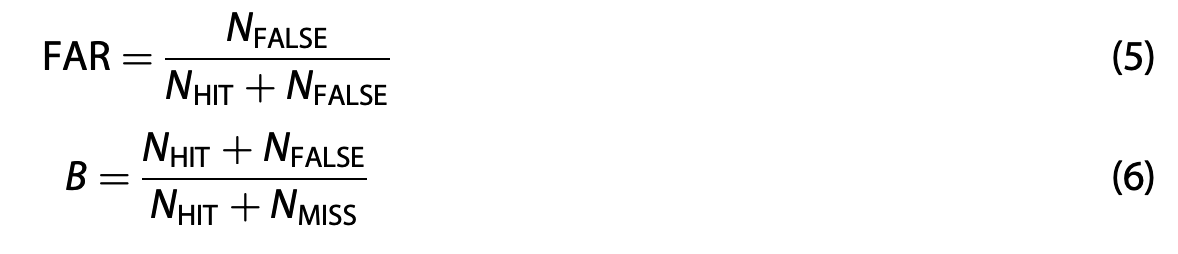
The false alarm rate is a measure of the forecasted events that are not observed, i.e., false positives. For the false alarm rate, 0 is the best possible score, and 1 is the worse score. The bias is a global measure of the forecast system and is simply the ratio of the total number of “yes” forecasts to the total number of “yes” observations. The bias is used to determine if a system is consistently over or under predicting events. A bias value of 1 is the ideal whereas a bias of <1 suggests that the system is under-predicting, and a bias of >1 suggests that the system is over-predicting the number of IP shocks.
We use these various skill measures to optimize our shock detection algorithm. Instead of limiting ourselves to optimizing a single one of the above skill scores, we defined an overall skill score which takes into account the TS, POD, and FAR. We define this overall skill score as:
Each of the included three skill metrics is given equal weighting, and the ideal score would be an overall score equal to three. We use this as the main skill score in ranking potential shock detection criteria.
对于自动化IP激波检测算法,其目标是最大化命中数(NHIT)并最小化漏报数(NMISS)与误报数(NFALSE)。基于列联表定义的数值,可进一步计算五种技能指标。下述术语与Owens等[2013]讨论预报技能量化时的表述一致。
首个预报技能评分是威胁评分(TS),亦称关键成功指数(CSI),表示正确预报事件占预报或观测事件总数的比例。TS=1代表完美系统,0为最差值。
另一种评估方式是计算检测概率(POD),即事件发生次数与预报次数的比值(公式4)。POD=1为最佳值,0为最差值。其他两项用于评估自动激波检测算法的技能评分为误报率(FAR)和偏差(B)(公式5-6)。
误报率衡量未观测到的预报事件(即误报)比例,0为最优值,1为最差值。偏差是预报系统的全局指标,为"是"预报总数与"是"观测总数之比,用于判断系统是否持续高估或低估事件。B=1为理想值,B<1表明系统低估IP激波数量,B>1则表明高估。
我们综合这些技能指标优化激波检测算法。为避免仅优化单一评分,本文定义了纳入TS、POD和FAR的综合技能评分(公式7)。三项指标权重均等,理想综合评分为3。该评分作为核心技能指标用于排序潜在激波检测标准。
5 Shock Detection Criteria Optimization
All shock detection algorithms require threshold values in order to identify potential IP shocks, and the approaches to determining these thresholds vary. Several previously developed algorithms have relied on differing threshold values and shock identification criteria [Neugebauer et al., 2003; Vorotnikov et al., 2008, 2011; Kruparova et al., 2013]. Our method, described in section 3, is similar to that used by Vorotnikov et al. [2008] in the first two steps of their seven-step process, in which the minimum criteria are an increase of >1.5% in velocity, >20% in proton density, and >15% in temperature. In addition to these minimum increases in the velocity, density, and temperature, Vorotnikov required a combined increase in all three parameters of at least 68% in order to classify a given discontinuity as a potential shock. These threshold values were obtained via visual inspection of the weakest shocks from 1999.
The approach taken by the Genesis solar wind mission [Neugebauer et al., 2003] was to define the passage of an IP shock as occurring when the following three conditions were met: velocity increased by 40 km/s, the density increased by >40%, and the temperature increased by >50%. These threshold values were chosen to identify strong shocks with a low rate of false positives [Neugebauer et al., 2003].
Kruparova et al. [2013] took a different approach and applied a quality factor and weighting coefficients to the percentage change observed in the three solar wind parameters (density, velocity, and magnetic field magnitude). The combined threshold and weighting factors were chosen through reasoned argument.
所有激波检测算法都需要阈值来识别潜在的行星际激波(IP激波),而确定这些阈值的方法各不相同。先前开发的几种算法采用了不同的阈值和激波识别标准。本文在第3节中描述的方法与Vorotnikov等人[2008]在其七步流程中的前两步使用的方法类似,其中最低标准是速度增加>1.5%、质子密度增加>20%以及温度增加>15%。除了这些速度、密度和温度的最小增幅外,Vorotnikov还要求这三个参数的总增幅至少达到68%,才能将给定的不连续性分类为潜在激波。这些阈值是通过对1999年最弱激波的目视检查获得的。
Genesis太阳风任务采用的方法是定义IP激波的通过需满足以下三个条件:速度增加40 km/s、密度增加>40%、温度增加>50%。这些阈值的选择是为了以低误报率识别强激波。
Kruparova等人[2013]采用了不同的方法,对三个太阳风参数(密度、速度和磁场强度)观测到的百分比变化应用了质量因子和加权系数。组合阈值和加权因子是通过合理论证选择的。
Here we seek to combine the best aspects of all of these algorithms into a code that is optimized for our purposes and that can be used with DSCOVR real-time data. Furthermore, while much of the previous works have arrived at their shock identification criteria via manual analysis, reasoned argument, or methods that had a subjective element and may result in selection of non-optimal thresholds, the approach that we take in this paper is a parameter-space study to determine the shock detection criteria that yield a maximum result for a given skill score criteria. While we used the information obtained from our statistical analysis (section 2) in order to determine the initial range of parameter space across which to scan, this subjective influence was removed by iterating and expanding the parameter range until the optimal threshold values no longer occurred at the maximum or minimum of the tested parameter space. Via a systematic approach, we evaluate a large and comprehensive parameter space in order to optimize our results according to the forecast skill measures presented in section 4.
A range of initial threshold values for each parameter (B_mag, n, V, T) as well as for two combined threshold values were selected based on the statistical analysis presented in section 2. For each parameter, several possible threshold values were tested, and Table 3 gives the range and increments for the various thresholds used within the algorithm. Threshold values are in terms of the percentage change before and after the observed discontinuity; percentage change was used instead of the absolute change in the value of the parameter in order to capture even small changes in a parameter like the magnitude of the magnetic field where changes in nT can be quite small.
在此,本文试图将所有这些算法的最佳特性整合到一个针对我们目的优化的代码中,并可用于DSCOVR实时数据。此外,虽然先前许多工作通过手动分析、合理论证或具有主观成分的方法得出其激波识别标准,这可能导致选择非最优阈值,但本文采用的方法是参数空间研究,以确定在给定技能评分标准下能产生最大结果的激波检测标准。虽然我们使用了从统计分析(第2节)中获得的信息来确定初始参数空间范围,但通过迭代和扩展参数范围,直到最优阈值不再出现在测试参数空间的最大值或最小值处,消除了这种主观影响。通过系统化方法,本文评估了一个大而全面的参数空间,以根据第4节中提出的预报技能指标优化我们的结果。
基于第2节的统计分析,本文为每个参数(B_mag、n、V、T)以及两个组合阈值选择了一系列初始阈值。对于每个参数,测试了多个可能的阈值,表3给出了算法中使用的各种阈值的范围和增量。阈值以观测到的不连续性前后百分比变化表示;使用百分比变化而非参数的绝对变化是为了捕捉像磁场强度这样变化可能很小(以nT为单位)的参数的微小变化。
Table 3. Parameter Space Tested in Order to Determine Optimal Threshold Values
| Parameter | Threshold Values Tested (% Change) |
|---|---|
| Proton density (n) | 10, 15, 20, 40, 60, 80 |
| Proton velocity (v) | 1, 2, 3, 4, 6 |
| Temperature (T) | 5, 10, 15, 20, 25, 30, 50 |
| Magnetic field magnitude (B_mag) | 10, 20, 25, 30, 35, 40, 50, 70 |
| Combined threshold for three parameters | 60, 80, 100, 120, 140 |
| Combined threshold for four parameters | 80, 100, 120, 140, 160 |
| Stand-alone B_mag threshold | 80, 100, 120, 130, 140, 150, 160, 170, 180, 190 |
A total of 10,115 permutations of the threshold values were evaluated systematically. The threshold values were varied one parameter at a time, and each set was applied to the full 8 years (odd months) of ACE data in order to achieve performance statistics for each permutation. From the results, we selected the set of shock detection criteria that optimized the overall forecast skill score (equation 7). We chose to optimize our algorithm according to the overall skill score, since this one value takes into account the TS, the POD, and the FAR rate, with equal weightings. While a high POD is desirable, we also want an algorithm that does not produce too many false alarms or forecasters will not pay attention to the alerts. The optimal shock detection criteria selected are summarized in Table 4. Using these threshold values, we obtained an overall skill score of 1.26, a TS of 0.29, a POD of 0.61, and a FAR of 0.64. Again, the optimization was performed using data from 1998 to 2006 for odd numbered months only, which is different than the data we use in the next section for evaluating and comparing the various shock detection algorithms.
我们系统评估了10,115种阈值组合。每次只改变一个参数的阈值,并将每组应用于8年(奇数月)的ACE数据,以获得每种组合的性能统计。从结果中,我们选择了能优化综合预报技能评分(公式7)的激波检测标准。我们选择根据综合技能评分优化算法,因为该值同等权重考虑了TS(威胁评分)、POD(检测概率)和FAR(误报率)。虽然高POD是理想的,但我们还需要一个不会产生太多误报的算法,否则预报员将不会关注警报。选定的最优激波检测标准总结在表4中。使用这些阈值,我们获得了综合技能评分1.26、TS 0.29、POD 0.61和FAR 0.64。需要说明的是,优化使用的是1998年至2006年奇数月的数据,这与下一节用于评估和比较各种激波检测算法的数据不同。
Table 4. Final Threshold Values Used in Automatic Shock Detection Algorithm
| Threshold Values | Description |
|---|---|
| %Δn(t) ≥ 60% | Minimum individual threshold value to be met for each of the four plasma parameters evaluated |
| %Δv(t) ≥ 4% | |
| %ΔT(t) ≥ 20% | |
| %ΔB_mag(t) ≥ 25% | |
| Σ3(%ΔX) ≥ 80% | Threshold to be met when three out of the four of the above individual threshold values are satisfied |
| Σ4(%ΔX) ≥ 140% | Threshold to be met when four out of the four of the above individual threshold values are satisfied |
| %ΔB_mag(t) ≥ 170% | Stand-alone B_mag threshold to be met in order to classify a discontinuity as a shock regardless of other plasma parameters |
6 Evaluation and Comparison of Shock Detection Algorithms
Using the forecast skill measures outlined above, we compute skill scores for our optimized algorithm and compare our values with results from other automatic shock detection routines. For each of the three published algorithms to which we compare [Neugebauer et al., 2003; Vorotnikov et al., 2008; Kruparova et al., 2013], we enacted the model as described in the published results and ran all codes on the same data set in order to accurately and fairly compare the different algorithms. Validation of each of the IP shock detection algorithms was conducted using ACE Level-2 MAG and SWEPAM data for even numbered months from 1998 to 2006, for which there were a total of 220 events. Data for the entire 8 years is read into each automated detection model and all potential IP shocks reported by the various algorithms are compared to the list of 220 shocks identified on one or both of the above mentioned shock lists: the ACE Science Center's List of Disturbances and Transients and the Richardson and Cane list of Near-Earth ICMEs. Results from all four algorithms are shown in Table 5 in terms of the skill scores discussed in section 4.
基于上述预报技能指标,我们计算了优化算法的技能评分,并将结果与其他自动激波检测程序进行对比。针对用于比对的三种已发表算法[Neugebauer et al., 2003; Vorotnikov et al., 2008; Kruparova et al., 2013],我们严格复现其原始模型描述,并在相同数据集上运行所有代码以确保公平比较。各IP激波检测算法的验证均使用1998-2006年偶数月的ACE二级MAG和SWEPAM数据,共包含220个激波事件。将8年数据输入各自动检测模型后,将所有算法报告的潜在IP激波与ACE科学中心扰动与瞬变事件列表及Richardson和Cane近地ICME列表进行比对。四种算法的技能评分结果如表5所示(指标定义见第4节)。
Table 5. Comparison of Several Different Shock Detection Algorithms in Terms of the Forecasted Skill Scores [a]
| Our Optimized Algorithm | Neugebauer et al. [2003] | Vorotnikov et al. [2008] | Kruparova et al. [2013] | |
|---|---|---|---|---|
| Sample size (n) | 220 | 220 | 220 | 220 |
| Hits | 125 | 70 | 132 | 140 |
| Misses | 95 | 150 | 88 | 80 |
| False positives | 232 | 73 | 920 | 1636 |
| Threat score | 0.277 | 0.239 | 0.116 | 0.075 |
| Prob. of detection | 0.568 | 0.318 | 0.600 | 0.636 |
| False alarm rate | 0.650 | 0.510 | 0.875 | 0.921 |
| Bias | 1.623 | 0.650 | 4.782 | 8.073 |
| Overall | 1.195 | 1.047 | 0.841 | 0.791 |
- [a] All algorithms were run with the same ACE Level-2 science data and compared to the same shock list (n = 220).
Overall, our algorithm does a respectable job of identifying shocks while minimizing the number of false positives and misses. We detect 125 out of the 220 shocks, missing 95 shocks. However, we still manage to maintain a low rate of false positives with only 232 false events. The threat score (TS) takes into account the combination of these three values (hits, misses, and false positives), and we use this value along with the overall skill score to evaluate the results of the various shock detection algorithms. Using our optimized algorithm, we achieve a threat score (TS) of 0.277 and an overall skill score of 1.195 (a perfect TS would be 1 and a perfect overall skill score would be 3). While not a perfect score, these skill scores are still quite good, especially compared to other shock detection algorithms. The other shock detection algorithm that does relatively well with regard to the TS and the overall skill score is the algorithm described by Neugebauer et al. [2003]. Using their shock detection criteria on the 8 years of ACE data used for this validation study, their algorithm yields a TS of 0.239 and an overall score of 1.047.
总体而言,我们的算法在识别激波的同时有效控制了误报和漏报数量。在220个激波中成功检测125个(漏报95个),同时仅产生232个误报事件。威胁评分(TS)综合考量了命中、漏报和误报三项指标,我们将其与综合技能评分共同作为评估标准。优化算法最终获得TS=0.277(完美值为1)和综合技能评分1.195(完美值为3)。虽未达最优,但这些评分已显著优于其他算法——表现次优的Neugebauer等[2003]算法在相同数据上仅获得TS=0.239和综合评分1.047。
7 Discussion
Detecting discontinuities in solar wind data is relatively straightforward; however, in designing an automatic shock detection algorithm, the main challenge is to accurately correlate the size of these discontinuities with shocks, and thereby identify as many real shocks as possible while rejecting false positives. The inclusion of some false positives is seen as permissible as the focus of this work is to design an algorithm capable of identifying IP shocks or discontinuities within real-time solar wind to be used with forecaster input. By identifying the greatest number of shocks, regardless of shock strength, space weather forecasters can then decide which shocks will likely result in the greatest space weather effects. However, while some false positives are acceptable, if the forecasters are overwhelmed by false positives, then the usefulness of the algorithm is diminished.
In terms of the forecast skill scores, we thus want to maximize the POD while minimizing our FAR. One way to view the trade-off between capturing as many shocks as possible while minimizing the number of false alarms is via the scatterplot shown in Figure 4 in which we plot the POD versus the FAR for thousands of runs from our parameter space study. The different colors correspond to different values for the stand-alone B_mag threshold value, and as the stand-alone B_mag threshold value increases, a significant reduction in the number of false alarms is observed without much reduction in the detection rate until high values of the stand-alone B_mag threshold are considered. The spread in the x-direction (from POD 0.45 to 0.6) corresponds to the range in individual threshold values for each parameter with the points near POD 0.45 corresponding to the higher threshold values and the points near POD 0.6 corresponding to the lower threshold values.
检测太阳风数据中的不连续性相对简单,但自动激波检测算法的核心挑战在于:如何准确建立不连续性幅度与激波的关联,从而在最大化真实激波识别率的同时最小化误报。本研究允许存在一定误报,因为算法设计初衷是为预报员提供实时太阳风数据中的IP激波/不连续性识别工具——预报员可据此筛选可能引发显著空间天气效应的激波。但需注意,若误报过多导致预报员"警报疲劳",算法实用性将大打折扣。
从预报技能评分角度看,理想状态是最大化检测概率(POD)同时最小化误报率(FAR)。图4通过散点图展示了这种权衡关系:该图基于参数空间研究的数千次运行结果,横轴为POD,纵轴为FAR,颜色梯度表示独立磁场阈值(B_mag阈值)的取值变化。可见随着B_mag阈值提高,FAR显著降低而POD基本稳定(仅当B_mag阈值极高时POD才开始下降)。POD在0.45-0.6区间的分布反映各参数阈值的设置差异——POD≈0.45对应较高参数阈值,POD≈0.6对应较低阈值。
Figure 4 Scatterplot of the POD versus FAR for thousands of runs from our parameter space study. The different colors correspond to different values for the stand-alone B_mag threshold value. The hand-drawn red line shows the approximate limit of the tested parameter space. Higher POD can be achieved, but that comes at the cost of a higher FAR.
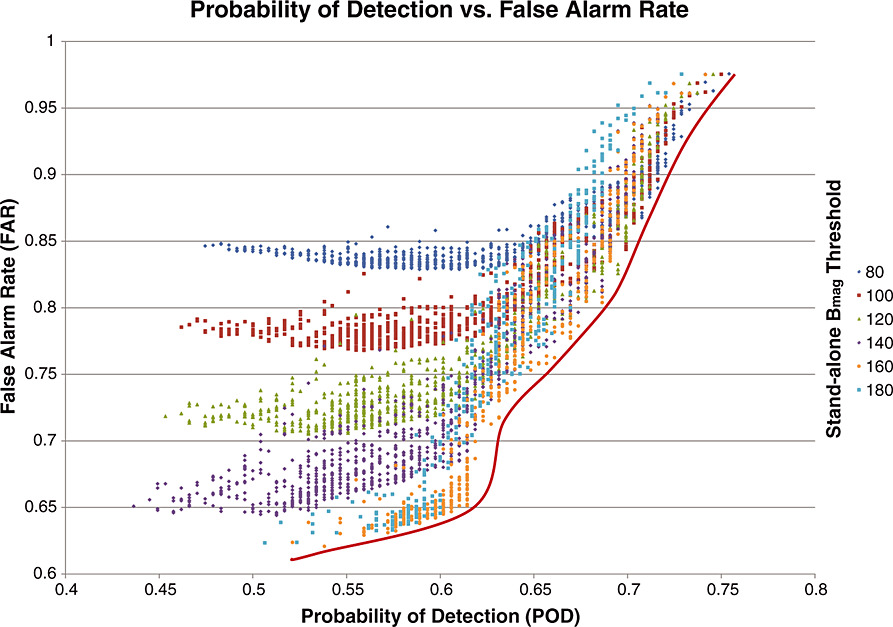
An approximate bounding line has been drawn that notionally represents the lowest FAR for a given POD given our algorithm and the tested threshold values. This **"performance curve"** is the best that this approach can achieve, and by adjusting individual threshold values, one can move along this curve raising the POD at the expense of a higher FAR. As can be seen, higher detection rates often come at the cost of higher false alarm rates. Thus, depending on the specific users' needs and preferences, the algorithm can be tailored to achieve a certain FAR or a given POD. The goal for future automated shock identification routines would be to move to the lower right of the red line shown in Figure 4.
图4 参数空间研究数千次运行的POD-FAR散点图。颜色对应不同B_mag阈值,红色手绘线表示测试参数空间的近似边界。追求更高POD需以更高FAR为代价。
图中红色手绘线代表当前算法和测试阈值条件下给定POD对应的最低FAR边界(即"性能曲线")。通过调整单个阈值参数,可沿该曲线移动:提高POD需承受FAR上升,反之亦然。这说明更高的检测率往往伴随更高的误报风险。因此,用户可根据具体需求定制算法参数,在POD与FAR之间取得平衡。未来自动激波识别研究的改进方向,应是突破图4红线的限制,向右下角(高POD低FAR)区域推进。
Without optimization, it is fairly easy to pick a set of shock detection criteria that do not yield the maximum POD for a given FAR. As was discussed in section 5, the performance of an algorithm depends heavily on the threshold values that are selected for each of the algorithm's independent criteria, and as can be seen in Figure 4, there are many sub-optimal threshold combinations that do not maximize the POD/FAR trade-off. Thus, it is crucial to know what the parameter space for a given shock detection algorithm looks like in order to select the detection criteria that yield the lowest FAR for a given POD.
Each algorithm that incorporates variable thresholds has its own performance curve, which highlights to the user that algorithm's trade-off between the POD and the FAR, depending on the thresholds that the user selects. We believe that this performance curve, in addition to the skill scores defined above, is an important and necessary component in evaluating and comparing IP shock detection algorithms. It would be useful for future shock detection algorithms to present a metric of performance such as the red performance curve shown in Figure 4, for which their performance over their entire range of possible shock detection criteria can be explored. Future work and future algorithms could thus seek to push the performance curve to the right and down—increasing the POD while lowering the FAR. Shifting the performance curve in either one of these directions would indicate an improvement. Comparison of the performance curves generated by different IP shock detection routines would readily show the manner in which one algorithm out-performs another.
未经优化的情况下,很容易选择一组无法实现给定FAR条件下最大POD的激波检测标准。如第5节所述,算法性能高度依赖于为各独立标准选择的阈值参数。从图4可见,存在大量非最优阈值组合未能实现POD/FAR的最佳权衡。因此,了解特定激波检测算法的参数空间特征对选择能在给定POD下实现最低FAR的检测标准至关重要。
每个包含可变阈值的算法都有其独特的性能曲线,直观展示该算法在POD与FAR之间的权衡关系(取决于用户选择的阈值)。我们认为,除前述技能评分外,这种性能曲线是评估比较IP激波检测算法的关键要素。建议未来研究在提出新算法时,均提供类似图4红色性能曲线的量化指标,以全面展示其所有可能检测标准下的性能表现。未来工作的突破方向应是推动性能曲线向右下方移动——在提升POD的同时降低FAR。性能曲线任一方向的移动都意味着算法改进,而不同算法性能曲线的直接对比可清晰展现其优劣差异。
8 Conclusion
We have developed an automated shock detection algorithm capable of autonomously identifying IP shock signatures within real-time solar wind data. Using a methodical approach of evaluating over 10,000 permutations of potential shock detection criteria, we have identified an optimal set of parameters to use in our automated algorithm that yield the best forecast skill scores. Applying traditional measures of forecast skill used by the meteorological community, we have evaluated four different IP shock detection algorithms using a standard set of ACE data. By running each algorithm with the same set of input data and comparing the results to a pre-specified shock list, the strengths and weaknesses of each algorithm can be evaluated based on forecast skill measures.
Comparison of our results to previous automatic shock detection algorithms shows that our optimized algorithm offers improvements in the reliability of automated shock detection for several forecast skill measures including the overall skill score and the threat score. Our algorithm detected 125 out of 220 shocks, missing 95 shocks, and issuing 232 false alarms, resulting in a threat score of 0.277 and an overall skill score of 1.195. Furthermore, we present the concept of a performance curve, whereby the trade-off between the probability of detection and the false alarm rate for a given algorithm can be made readily apparent. We suggest using this performance curve as a metric by which past, present, and future algorithms with variable inputs can be compared.
我们开发了一种能自主识别实时太阳风数据中IP激波特征的自动检测算法。通过系统评估超10,000种检测标准组合,确定了能使预报技能评分最优的参数集。应用气象学界标准预报技能指标,基于统一ACE数据集对比评估了四种IP激波检测算法。通过相同输入数据测试并与预设激波列表比对,可从预报技能角度客观评估各算法优劣。
与既有自动检测算法相比,我们的优化算法在综合技能评分和威胁评分(TS)等多个指标上展现出更高可靠性。算法在220个激波中检测到125个(漏报95个),产生232次误报,最终获得TS=0.277和综合技能评分1.195。此外,我们提出的性能曲线概念可直观呈现算法在检测概率与误报率之间的权衡关系,建议将其作为评估历代算法(含可变输入参数)的标准比较基准。
While the algorithm described above was developed using ACE Level-2 science data, the code was created and tested in a manner that closely resembles the anticipated real-time application for use with the upcoming DSCOVR mission. Automated shock detection algorithms can quickly and automatically alert space weather forecasters to the arrival of a potential shock, providing additional information to assist forecasters in issuing timely space weather alerts and warnings. Such an algorithm does not seek to replace space weather forecasters; instead, it would serve as a tool to enhance forecasters' situational awareness. Forecasters would still be required to use their judgment and expertise to decide upon the geoeffectiveness and potential space weather impacts resulting from any identified solar wind discontinuities. An autonomous IP shock detection algorithm will also be useful in other space weather applications and products, such as in an automatic solar wind regime identification product where it is necessary to discern whether or not a shock has occurred in order to determine the most likely solar wind regime.
The algorithm presented here shows improvement in detecting the greatest number of real shocks while minimizing the number of false positives. We do this by optimizing for the overall skill score. Other users might be interested in optimizing different parameters, and thus we proposed the use of a performance metric such as the ratio of the POD to the FAR to allow for easy comparison of future shock detection algorithms. By comparing the POD-FAR curve for shock detection schemes with tunable inputs, the performance of each algorithm can be evaluated at a glance over their entire parameter space. This would allow a user to select the algorithm and threshold values that optimize the skill score in which they are most interested. Potential optimizations that a user may be interested in include optimizations for a particular data set, satellite, or location, or optimizations for a particular type of shock, such as fast shocks above a given threshold speed.
虽然本算法基于ACE二级科学数据开发,但其代码设计与测试均模拟了即将开展的DSCOVR任务实时应用场景。自动激波检测算法可快速预警潜在激波到达,为预报员发布空间天气警报提供决策支持。该算法并非取代人工预报,而是通过增强态势感知能力辅助预报员——仍需专业人员判断已识别太阳风不连续性的地效影响与空间天气效应。此类算法还可应用于其他空间天气产品,如需要判断激波是否发生的自动太阳风状态识别系统。
本研究通过优化综合技能评分,实现了在最大化真实激波检测数的同时最小化误报。针对不同用户需求,建议采用POD/FAR比值等性能指标便于算法间比较。通过对比含可调参数算法的POD-FAR曲线,可快速评估各算法在全参数空间的性能表现,帮助用户选择最适合其关注指标的算法与阈值组合。潜在优化方向包括:针对特定数据集/卫星/位置的优化,或针对特定类型激波(如超阈值速度的快速激波)的专项优化。