一种高效的端到端计算框架:用于生成心电图校准的人体心房电生理容积模型|文献速递-文献分享
Title
题目
An efficient end-to-end computational framework for the generation of ECGcalibrated volumetric models of human atrial electrophysiology
一种高效的端到端计算框架:用于生成心电图校准的人体心房电生理容积模型
01
文献速递介绍
心房电生理计算模型的应用与技术挑战 心房电生理(EP)计算模型正逐渐应用于多个领域,既涵盖电解剖标测(EAM)系统等设备的工业研发(Reddy等人,2023;Szili-Torok等人,2023),也包括临床治疗的分层与方案制定(Boyle等人,2019)。这些应用以心房电生理生物物理模型的机制特性为基础,且隐含一个核心假设:计算机内(in silico)模拟行为与患者体内观察到的真实心房电生理现象高度一致。若能为这种紧密的因果关系提供符合监管要求的充分证据,相较于当前基于临床前动物实验和临床试验的范式(Dössel等人,2012;Schotten等人,2011),计算机模型可更全面、更安全且更经济地用于心房电生理研究。 然而,目前能为这种紧密因果关系及定量准确性提供支持证据的最先进模型仍十分有限。绝大多数计算研究采用简化的解剖模型(Roney等人,2023;Azzolin等人,2023;Labarthe等人,2014),搭配未经校准的默认参数(Boyle等人,2019;Sakata等人,2024),且与心电图(ECG)等可直接观测指标的对比往往较为局限(Loewe等人,2016;Ferrer等人,2015),甚至完全未纳入考量(Roney等人,2023)。这在很大程度上源于当前建模技术在解剖模型生成、校准及模拟技术方面的能力不足——若与实际观测结果直接对比,会发现物理空间与虚拟空间存在显著差异,进而削弱模型的可信度。 心房解剖结构建模所需的保真度与细节程度,以及用于衡量这些指标的标准,均取决于具体应用场景(Boyle等人,2019;Bhagirath等人,2024)。除“具备机制性关系”这一最低要求(即心房电生理模型需能定性重现所有起作用的心房电生理机制)外,计算机模型还可通过校准,代表特定患者群体(同时涵盖解剖与功能的变异性)(Niederer等人,2020)。这种对患者群体而非个体的代表性,有助于对真实心房的观测结果进行通用解读,并预测电生理系统对治疗干预的响应。这类功能相似的模型集合被称为“虚拟队列”,近年来已开始用于计算机临床试验,以及新设备或新疗法的安全性与有效性测试(Viceconti等人,2020)。尽管如此,构建计算机模型虚拟队列仍需心脏建模领域实现转型——从有限的定制化模型,转向能快速生成大量模型的高效、可扩展工作流程(Niederer等人,2020)。 需求最高的是面向精准心脏病学的临床应用,即针对患者个体定制治疗方案。这类应用需要模型既能重现心脏解剖结构,又能通过定量校准,与患者个体心脏的功能观测结果实现“一对一”匹配。在特定刺激或扰动下,虚拟空间与真实空间在单一时间点产生相同应急响应的功能等效模型,被称为“数字孪生快照”。若模型能通过测量数据持续或定期更新,则会成为真正的“数字孪生体”(Corral-Acero等人,2020;Hopman等人,2023;Bhagirath等人,2024)。 然而,当前心房电生理建模流程在以足够高效、稳健的方式大规模构建高保真数字孪生快照或虚拟队列方面,能力仍存在严重局限。核心挑战在于:需足够精准地描述心房内的电信号源,以预测周围可观测测量信号(如体表心电图)所在区域的电位场。在人体在体(in vivo)场景中,电信号测量形式包括通过设备或EAM系统获取的电描记图(EGMs),以及体表心电图(ECG)。尽管概念上简单,但此类建模流程的实施难度极大,面临诸多尚未解决的严峻挑战。通常,构建心房电生理心脏数字孪生模型的流程分为两个独立阶段:解剖孪生阶段与功能孪生阶段(Roney等人,2023;Azzolin等人,2023;Labarthe等人,2014)。 在解剖阶段,需对断层扫描图像进行多标签分割,以识别所有相关区域(Payer等人,2017),再将这些区域转化为多标签计算网格(Prassl等人,2009;Crozier等人,2016),从而精准呈现双心房解剖结构。相关流程操作繁琐,需训练有素的专家进行大量人工干预,并消耗大量计算资源(Roney等人,2023;Azzolin等人,2023)。在4名患者的正常窦性心律激活状态下,研究团队通过采用Saltelli采样方法优化24个调控心房激活的选定参数,实现了对临床P波的(模型)匹配。 本文结构如下:第2章全面概述所提出的端到端工作流程,包括解剖孪生阶段(2.1节)与功能建模阶段(2.2节)。其中,2.1.1-2.1.4节详细阐述生成解剖结构精准的双心房容积模型(含解剖结构与纤维架构)的方法;2.1.5-2.1.6节描述双心房网格周围的非心房组织(UAC)与躯干模型的计算过程;2.2.1节概述计算心房间连接的新方法;2.2.2节详细说明用于模型校准的参数扫描过程。第3章呈现数值结果;第4、5、6章分别进行讨论、阐述局限性并给出结论。
Abatract
摘要
Computational models of atrial electrophysiology (EP) are increasingly utilized for applications such as thedevelopment of advanced mapping systems, personalized clinical therapy planning, and the generation ofvirtual cohorts and digital twins. These models have the potential to establish robust causal links betweensimulated in silico behaviors and observed human atrial EP, enabling safer, cost-effective, and comprehensiveexploration of atrial dynamics. However, current state-of-the-art approaches lack the fidelity and scalabilityrequired for regulatory-grade applications, particularly in creating high-quality virtual cohorts or patientspecific digital twins. Challenges include anatomically accurate model generation, calibration to sparse anduncertain clinical data, and computational efficiency within a streamlined workflow.This study addresses these limitations by introducing novel methodologies integrated into an automatedend-to-end workflow for generating high-fidelity digital twin snapshots and virtual cohorts of atrial EP.These innovations include: (i) automated multi-scale generation of volumetric biatrial models with detailedanatomical structures and fiber architecture; (ii) a robust method for defining space-varying atrial parameterfields; (iii) a parametric approach for modeling inter-atrial conduction pathways; and (iv) an efficient forwardEP model for high-fidelity electro-cardiogram (ECG) computation.We evaluated this workflow on a cohort of 50 atrial fibrillation (AF) patients, producing high-qualitymeshes suitable for reaction-eikonal and reaction–diffusion models, demonstrating the ability to efficientlysimulate atrial ECGs under parametrically controlled conditions, and, as a proof-of-concept, the feasibilityof calibrating models to clinical P-wave in four patients. These advancements represent a critical steptowards scalable, precise, and clinically applicable digital twin models and virtual cohorts, enabling enhancedpatient-specific predictions and therapeutic planning
人体心房电生理计算模型相关研究 心房电生理(EP)计算模型正日益广泛地应用于多种场景,例如先进标测系统开发、个性化临床治疗方案制定,以及虚拟队列与数字孪生体构建。这类模型有望在模拟的计算机内(in silico) 行为与观察到的人体心房电生理现象之间建立可靠的因果关联,从而为心房动力学研究提供更安全、经济且全面的探索途径。 然而,当前最先进的方法在保真度和可扩展性上仍无法满足监管级应用的需求,尤其是在构建高质量虚拟队列或患者特异性数字孪生体方面。现有挑战包括:生成解剖结构精准的模型、基于稀疏且存在不确定性的临床数据进行模型校准,以及在简化工作流程中保证计算效率。 本研究通过引入创新方法并整合到自动化端到端工作流程中,解决了上述局限性,旨在生成高保真度的心房电生理数字孪生快照与虚拟队列。这些创新方法包括:(1)自动化多尺度生成具有详细解剖结构和纤维架构的双心房容积模型;(2)一种用于定义空间变化性心房参数场的稳健方法;(3)一种用于建模心房间传导通路的参数化方法;(4)一种用于高保真度心电图(ECG)计算的高效正向电生理模型。 我们在包含50名心房颤动(AF)患者的队列上对该工作流程进行了评估,生成了适用于反应-程函(reaction-eikonal)模型和反应-扩散(reaction–diffusion)模型的高质量网格,验证了在参数可控条件下高效模拟心房心电图的能力;同时,作为概念验证,还证实了在4名患者中基于临床P波对模型进行校准的可行性。这些进展为构建可扩展、高精度且具有临床适用性的数字孪生模型与虚拟队列迈出了关键一步,有望为患者特异性预测和治疗方案制定提供更强有力的支持。
Method
方法
We provide a schematic overview of an end-to-end workflow for thegeneration of anatomically accurate volumetric biatrial-torso model inFig. 1.The workflow comprises two major processing stages, (i) an anatomical twinning stage comprising the generation of the atrial anatomicalmodel with structural labels and fiber architecture, the generation ofan atrial reference frame for spatial parameter swiping, and a torsoanatomical model, and (ii) a functional modeling stage, for the definition of inter-atrial pathways, and the setting up of a forward EP modelfor representing and calibrating atrial action potential propagation, andfor generating the associated clinically observable signals, such as theECGs and the EGMs. Both stages are closely linked to the choice offorward EP mathematical model, which influences, for instance, thetargeted spatial mesh resolution of the biatrial anatomical model.The anatomical twinning stage is organized following an almostautomatic and sequential step approach:(i) image segmentation: by exploiting a convolutional neural network, tomographic scans, either computed tomography (CT)or magnetic resonance imaging (MRI), are automatically segmented;(ii) label augmentation on the atrial blood pool: veins and appendages on the atrial blood pools are identified and labeled,for defining the border between atrial myocardium and attachedvasculature;(iii) extrusion of the volumetric atrial walls: by accounting for theidentified labels on the blood pools, a sequence of prescribedoperations is employed on the segmentation to extrude theendo- and epicardial walls endowed with a selected thickness,automatically opening veins and valves, and generating a corresponding smooth volumetric mesh;(iv) selection of atrial orifices: a fully automated process is carriedout to identify the complete set of vein ostia and valves on theatrial walls, separated in endocardial and epicardial tissue;(v) automatic labeling of anatomical structures and fiber generation:the remaining anatomical regions are automatically annotated,and the atrial fiber architecture is computed;(vi) UACs generation: a system of normalized volumetric universalcoordinates is computed;(vii) integration of a torso volumetric conductor: a reference torsoanatomical model is automatically integrated with the biatrialanatomical model and lead fields are computed for all considered electrode positions for computing all clinical ECG signalsof interest.The functional modeling stage comprises:(viii) generating ICs: a flexible set of conduction pathways that cannotbe delineated from images are computed to facilitate inter-atrialimpulse conduction(ix) generate EP clinical outputs: employing either R-D monodomainformulation, or a R-E model to represent the transmembranevoltage, 𝑉**𝑚, in the atrial model, a parameter spaces of EP parameter is selected to be used for the model calibration. TheP-wave of the 12-lead ECGs on the torso are computed usingthe respective lead fields (Potse, 2018; Gillette et al., 2022). Thesame approach can be potentially employed to compute EGMsin the blood pools.
The entire workflow is implemented in a single user-friendly software building on the package meshtool (Neic et al., 2020) and onpython code. For meshing operations the software TetGen (Weierstrass Institute, Berlin, Germany) and NetGen (CerbSim GmbH, Vienna,Austria) have been licensed and integrated with meshtool. An interactive mode is moreover available, allowing for the verification ofthe labeling process, the visual control of all processing stages, andthe correction of any potential software errors, through the use ofthe software NumeriCor Studio (Numericor GmbH, Graz, Austria). Allrequired interactive steps are readily supported by the freely availablestarter version of NumeriCor Studio for academia. Each step of ourworkflow will be extensively described in the following sections.
解剖学精准双心房-躯干容积模型生成的端到端工作流程 我们在图1中提供了生成解剖学精准双心房-躯干容积模型的端到端工作流程示意图。该工作流程包含两个主要处理阶段:(1)解剖孪生阶段,涵盖带结构标签与纤维架构的心房解剖模型生成、用于空间参数扫描的心房参考系生成,以及躯干解剖模型生成;(2)功能建模阶段,用于心房间传导通路定义、正向电生理(EP)模型搭建——该模型可表征并校准心房动作电位传导,同时生成心电图(ECGs)、电描记图(EGMs)等相关临床可观测信号。两个阶段均与正向电生理数学模型的选择紧密关联,例如,该数学模型会影响双心房解剖模型的目标空间网格分辨率。 ## 一、解剖孪生阶段:近自动化的序贯步骤 解剖孪生阶段采用近乎自动化的序贯操作流程,具体步骤如下: 1. 图像分割:利用卷积神经网络(CNN)对计算机断层扫描(CT)或磁共振成像(MRI)等断层扫描图像进行自动分割; 2. 心房血池标签增强:识别并标记心房血池上的静脉与心耳,明确心房心肌与附着血管之间的边界; 3. 心房容积壁挤压生成:结合血池上已识别的标签,对分割结果执行一系列预设操作,挤压生成具有选定厚度的心房内外膜壁,自动打通静脉与瓣膜通道,并生成相应的平滑容积网格; 4. 心房开口选择:通过全自动流程识别心房壁上的全套静脉开口与瓣膜(分为心内膜和心外膜组织); 5. 解剖结构自动标注与纤维生成:对剩余解剖区域进行自动标注,并计算心房纤维架构; 6. 通用坐标系(UACs)生成:计算标准化容积通用坐标系系统; 7. 躯干容积导体整合:将参考躯干解剖模型与双心房解剖模型自动整合,并为所有待考虑的电极位置计算引导场,以用于计算所有目标临床心电图信号。 ## 二、功能建模阶段:心房间传导与电生理输出生成 功能建模阶段的核心任务的是实现心房电生理功能的精准模拟与临床信号生成,具体步骤如下: 8. 传导通路(ICs)生成:计算一组无法通过图像勾勒的柔性传导通路,为心房间冲动传导提供支持; 9. 电生理临床输出生成:在心房模型中,采用反应-扩散(R-D)单域方程或反应-程函(R-E)模型表征跨膜电压(V_m);选择电生理参数空间用于模型校准,并利用相应引导场计算躯干上12导联心电图的P波(Potse,2018;Gillette等人,2022);该方法理论上也可用于计算血池中的电描记图(EGMs)。 ## 三、工作流程的软件实现 整个工作流程基于meshtool软件包(Neic等人,2020)与Python代码,集成于单一用户友好型软件中: - 网格操作:已授权并集成TetGen(德国柏林魏尔斯特拉斯研究所)与NetGen(奥地利维也纳CerbSim GmbH公司)两款软件,用于网格生成与处理; - 交互验证:提供交互模式,可通过NumeriCor Studio软件(奥地利格拉茨Numericor GmbH公司)验证标签标注过程、可视化监控所有处理阶段,并修正潜在软件误差; - 学术支持:NumeriCor Studio提供免费学术入门版,可充分支持所有必要的交互步骤。 后续章节将对工作流程的每个步骤进行详细阐述。
Conclusion
结论
In this study, we developed an automated, efficient, and flexiblemulti-scale workflow for creating anatomically accurate biatrial modelswith high-quality meshes, suitable for various forward EP models,and extended it to a function twinning stage, where efficient modelcalibration based on ECG data is possible. The workflow utilizes asegmented blood pool and a deep learning-based segmentation networkto automatically identify and label principal atrial structures. It moreover generates endocardial and epicardial walls based on predefinedrules, ensuring robust model openings and high mesh quality. Detailedanatomical and functional structures, including fiber architecture andspace-varying parameters, are incorporated into the models. We furtherintroduced a flexible method for representing ICs using auto-generatedcables, allowing for realistic and customizable conduction properties.Our framework finally includes a clinically compatible ECG forwardgeneration system, integrating both R-D and R-E models with LeadField methods for accurate ECG trace generation, and possibly allowsfor the integration of the Pseudo-bidomain approach or 𝜙**𝑒 -recovery.Among these, we show that the RELF method proved effective forreal-time ECG computation and reliable source approximation in sinusrhythm.Overall, our workflow facilitates efficient exploration of the EPparameter space for calibration of biatrial models based on ECG data,making it a valuable tool for advancing cardiac EP research.
该研究核心是开发了一套自动化、高效且灵活的多尺度工作流程,可生成解剖学精准、网格质量高的双心房模型,并能基于心电图数据完成模型校准,为心脏电生理研究提供有力工具。 ### 工作流程的核心功能与优势 1. 自动化模型生成:利用分割血池与深度学习分割网络,自动识别并标记心房主要结构;依据预设规则生成心内膜和心外膜壁,确保模型开口稳定且网格质量高。 2. 精细结构与参数整合:模型中融入了纤维结构、空间变化参数等解剖学与功能性细节,同时通过自动生成导线灵活构建心房间传导通路(ICs),实现真实且可定制的传导特性。 3. 兼容多类电生理模型:构建了临床兼容的心电图正向生成系统,将反应-扩散(R-D)、反应-程函(R-E)模型与导联场方法结合,可精准生成心电图轨迹,还可能整合伪双域法或细胞外电位恢复((\phi_e)-recovery)方法。 ### 关键研究成果 - 高效计算验证:验证了RELF方法在窦性心律下,可实现实时心电图计算与可靠的源近似,解决了传统模型计算效率与准确性难以平衡的问题。 - 临床转化价值:该工作流程支持基于心电图数据的电生理参数空间探索与模型校准,大幅降低了双心房模型的构建与优化成本,为心脏电生理研究的推进提供了实用工具。 要不要我帮你整理一份研究核心技术与成果的提炼清单,把工作流程的关键模块、优势及应用价值按条目梳理,方便快速把握研究重点?
Results
结果
3.1. Model generation workflow performance evaluationWe evaluated our atrial model generation workflow with respect tothe required processing time and the achieved degree of automation.50 contrast CT datasets of AF patients were processed to generatebiatrial models of target resolution of ≈ 0.25 mm and ≈ 0.90 mm, and theexecution times of individual stages of the automated workflow weremeasured. Part of the generated models will be available on the Zenodoplatform, doi: 10.5281/zenodo.17143583After each stage, visual checks were performed to detect processingerrors. Errors that required manual correction were recorded for eachstage and at both target resolutions, and are summarized in Table 6.Benchmark results are reported for the execution of the workflow ona compute workstation equipped with an AMD Ryzen ThreadripperPRO5965wx processor, using 16 CPU cores.Overall, all 50 cases in both resolutions were processed automatically in the majority of cases (38), with only minimal user interventionrequired in 22 cases. The workflow produced anatomically highlydetailed computational meshes, with fine-grained domain annotation,fiber arrangement, and an anatomical reference frame in the formof UACs (referred to Fig. 9). For the lower resolution R-E model,the overall processing per model lasted, on average, less than tenminutes. Higher resolution R-D compatible meshes were more costlyto generate, specifically, the UAC generation stage where more than≈84% of the costs incurred. A comparison with existing UAC software and computations from Roney et al. (2023) was conducted toevaluate the effectiveness of our framework in terms of UAC qualitydistribution, usability, and computational cost. The results are providedin Appendix. Importantly, a fully automatic meshing processes wasachieved in all cases, yielding meshes free of topological errors andof, overall, excellent mesh quality. Worst element quality was alwaysbelow 0.99, according to the quality metric (Karabelas et al., 2018),which is considered a critical threshold in simulations using R-D solverssuch as openCARP. Lower quality elements close to 0.99 clusteredmostly in high curvature regions, around the orifices of the thin-walledatria (referred to Fig. 9).
3.1 模型生成工作流程性能评估 我们从所需处理时间与自动化程度两方面,对心房模型生成工作流程进行了评估。 研究处理了50例心房颤动(AF)患者的增强计算机断层扫描(CT)数据集,生成目标分辨率约为0.25 mm与0.90 mm的双心房模型,并测量了自动化工作流程各阶段的执行时间。部分生成的模型将在Zenodo平台开放获取,数字对象标识符(doi)为:10.5281/zenodo.17143583。 在工作流程的每个阶段后,均通过视觉检查检测处理误差。记录了两种目标分辨率下各阶段需手动修正的误差,结果汇总于表6。基准测试结果基于以下硬件环境:搭载AMD Ryzen Threadripper PRO5965wx处理器的计算工作站,使用16个CPU核心运行工作流程。 总体而言,两种分辨率下的50例数据中,多数案例(38例)可完全自动处理,仅22例需最少的用户干预。该工作流程生成的计算网格具有高度详细的解剖结构,包含细粒度的区域标注、纤维排列,以及以通用坐标系(UAC)形式呈现的解剖参考系(参见图9)。 对于低分辨率的反应-程函(R-E)模型,单个模型的整体处理时间平均不到10分钟。高分辨率的反应-扩散(R-D)兼容网格生成成本更高,其中通用坐标系(UAC)生成阶段的耗时占比超过约84%。 为评估本框架在通用坐标系(UAC)质量分布、可用性与计算成本方面的有效性,研究将其与现有通用坐标系(UAC)软件及Roney等人(2023)的计算结果进行了对比,相关结果见附录。 重要的是,所有案例均实现了完全自动化的网格划分过程,生成的网格无拓扑错误,且整体网格质量优异。根据Karabelas等人(2018)提出的质量指标,最差单元质量始终低于0.99——该值被视为使用openCARP等反应-扩散(R-D)求解器进行模拟时的关键阈值。质量接近0.99的低质量单元主要集中在高曲率区域,即薄壁心房的开口周围(参见图9)。 要不要我帮你整理一份该部分核心数据的提炼表格,将处理时间、误差情况、网格质量等关键信息汇总,方便快速查阅?
Figure
图
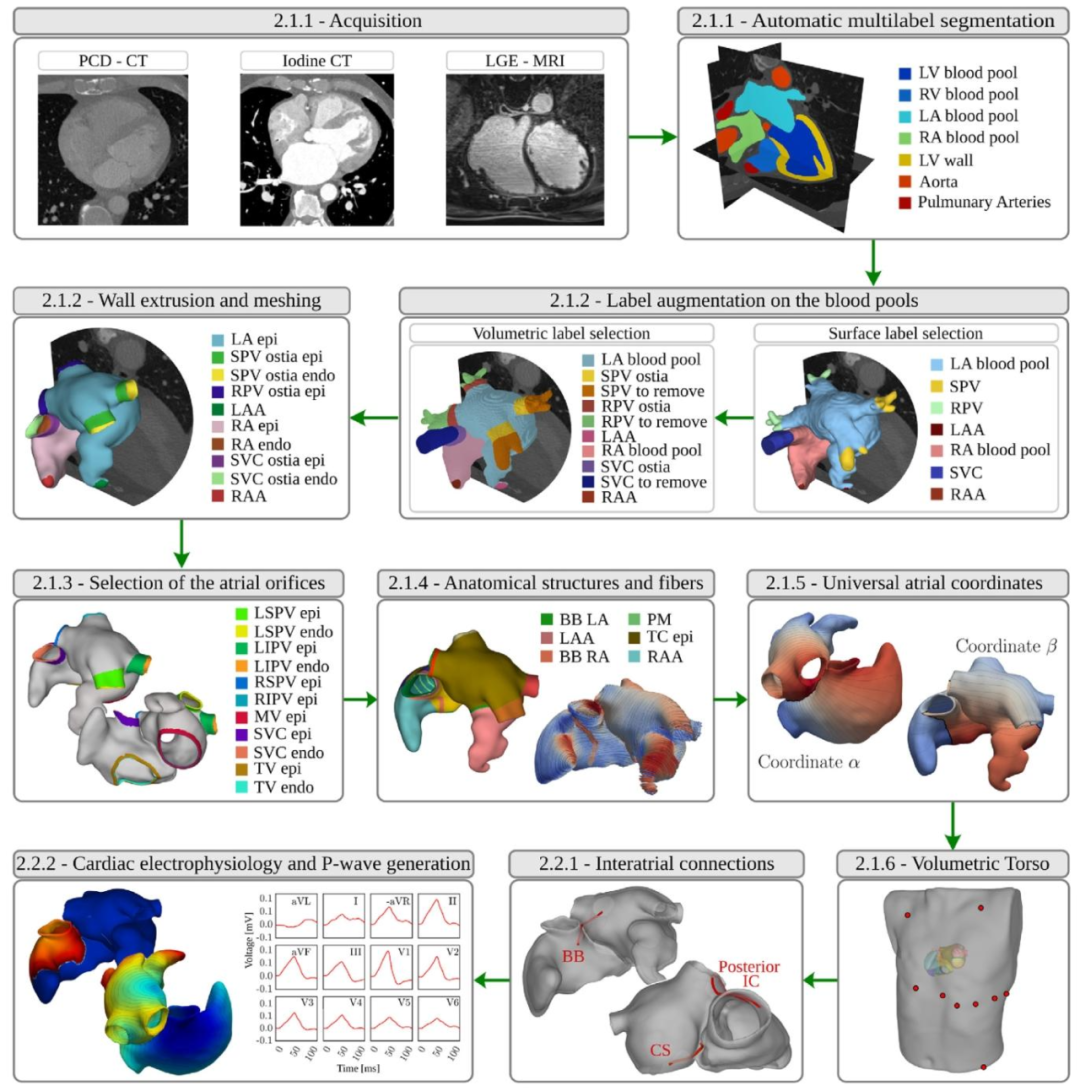
Fig. 1. Schematic outline of the end-to-end framework for the generation of ECG-calibrated volumetric models of patient-specific human atria. After imageacquisition, the workflow comprises nine steps: automatic multilabel segmentation, automatic label augmentation on the blood pools, extrusion of the volumetricbilayer walls, automatic selection of atrial orifices, automatic annotation of anatomical structures and fiber generation, generation of UAC, registration andgeneration of a torso volume conductor, generation of ICs, and cardiac electrophysiological simulation and P-wave generation. We moreover provide the papersection index where each step is detailed.
图1:患者特异性人体心房心电图校准容积模型生成的端到端框架示意图 该图展示了从图像获取到最终生成心电图(ECG)校准模型的完整流程,包含9个核心步骤,同时标注了各步骤在论文中对应的详细阐述章节,具体内容如下: 1. 自动多标签分割:对获取的断层扫描图像(如CT、MRI)进行自动化多标签分割,识别心房相关解剖区域; 2. 血池自动标签增强:在心房血池区域补充标注静脉、心耳等细节结构,明确心肌与血管的边界; 3. 双层容积壁挤压生成:基于血池标签,通过预设操作生成具有双层结构(心内膜、心外膜)的心房容积壁,并构建平滑网格; 4. 心房开口自动选择:全自动识别心房壁上的静脉开口与瓣膜位置,区分心内膜与心外膜组织; 5. 解剖结构自动标注与纤维生成:对剩余解剖区域完成自动标注,并计算心房纤维架构; 6. 通用坐标系(UAC)生成:构建标准化的容积通用坐标系,为后续参数扫描与定位提供参考; 7. 躯干容积导体配准与生成:将躯干解剖模型与双心房模型配准整合,生成容积导体结构,用于计算体表电极引导场; 8. 心房间传导通路(ICs)生成:构建无法通过图像直接勾勒的柔性传导通路,支撑心房间电冲动传导模拟; 9. 心脏电生理模拟与P波生成:通过电生理模型(如反应-扩散模型)模拟心房动作电位传导,生成临床可观测的P波,完成ECG校准。 图中同步标注了每个步骤在论文中对应的详细阐述章节索引,便于读者查阅各步骤的技术细节。
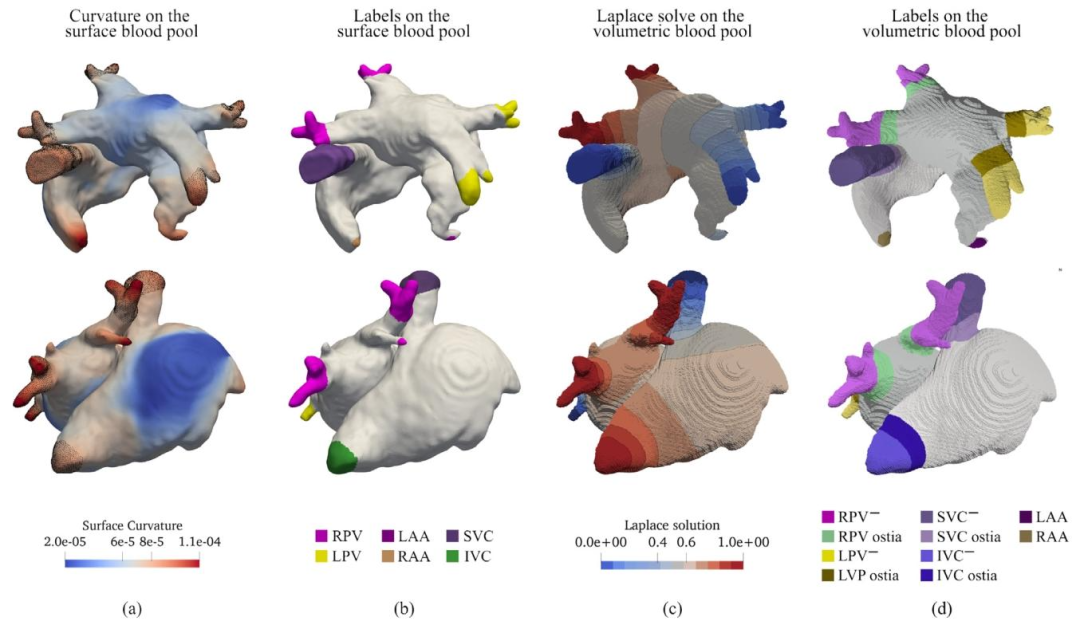
Fig. 2. (a) Point-wise curvature on the blood pool surface mesh. The figure also highlights the correlation between the surface region of high curvature andanatomical structures to mark. (b) Minimal set of labels selected based on surface curvature, including LPV, RPV and LAA on the LA, and IVC, SVC and RAAon the RA. (c) Instance of LD solution and isosurfaces on the blood pool volumetric mesh. (d) Vein ostiae and the discardable tissue labeled on the blood poolvolumetric mesh.
图2 (a)血池表面网格的逐点曲率。该图还突出显示了高曲率表面区域与待标注解剖结构之间的相关性。 (b)基于表面曲率选择的最小标签集,包括左心房(LA)上的左肺静脉(LPV)、右肺静脉(RPV)和左心耳(LAA),以及右心房(RA)上的下腔静脉(IVC)、上腔静脉(SVC)和右心耳(RAA)。 (c)血池容积网格上水平集(LD)求解结果及等值面示例。 (d)血池容积网格上标注的静脉开口与可丢弃组织。
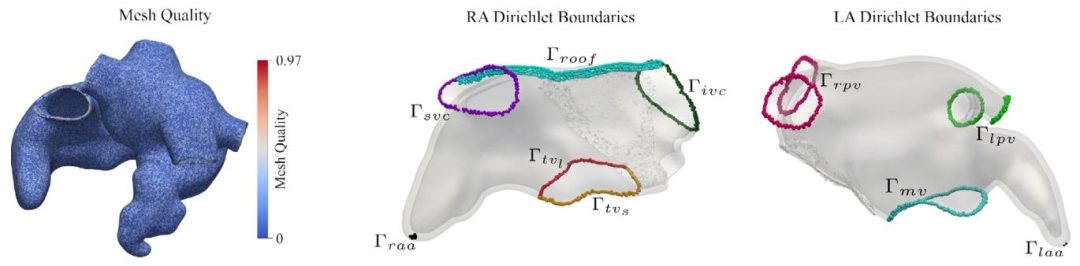
Fig. 3. Left: Mesh quality computed on the biatrial model. Right: Boundaries on the RA and LA 15 LD problems employed to determine atrial anatomical structuresand tissues known to have different EP properties.
图3 左侧:双心房模型的网格质量(计算结果)。 右侧:右心房(RA)与左心房(LA)上的边界——通过15个水平集(LD)问题求解得到,用于确定具有不同电生理(EP)特性的心房解剖结构与组织。
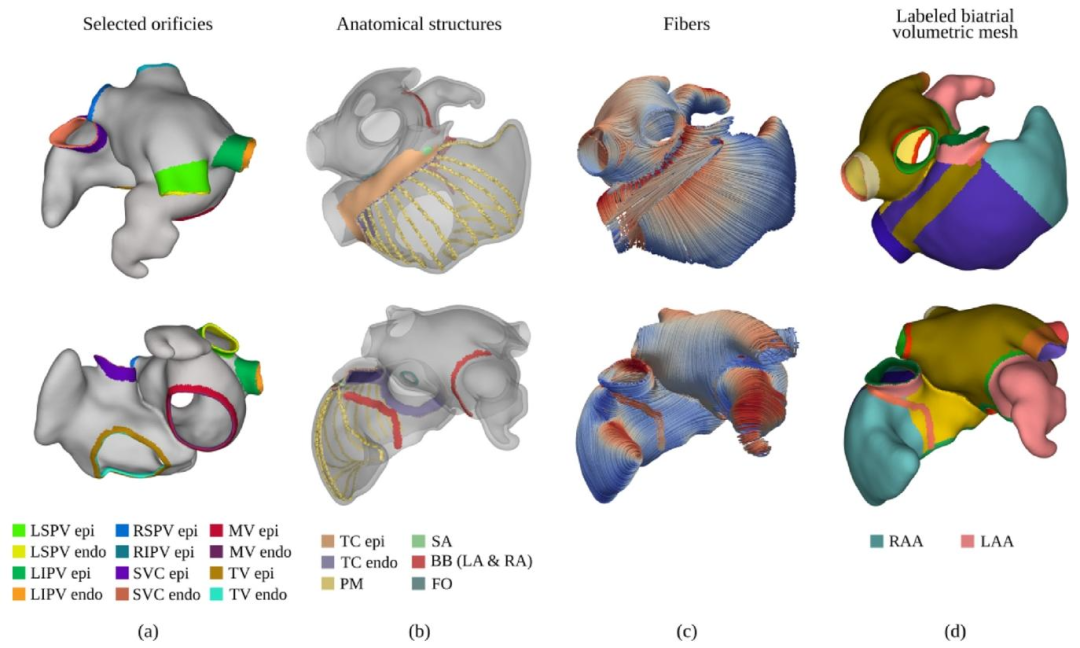
Fig. 4. (a) Identification and labeling of the atrial orifices. Different labels are used for endocardial and epicardial tissue layers. (b) Anatomical structures identifiedon the biatrial anatomy, including TC, SAN, PMs, FO, and part of the BB. (c) Generated rule-based atrial fiber architecture. (d)Final biatrial volumetric mesh,enriched with anatomical structures by merging the labels produced in stages (a) and (b)
图4 (a)心房开口的识别与标注。心内膜层和心外膜层组织采用不同标签。 (b)在双心房解剖结构上识别出的解剖结构,包括界嵴(TC)、窦房结(SAN)、乳头肌(PMs)、卵圆窝(FO)以及部分房室束(BB)。 (c)基于规则生成的心房纤维架构。 (d)最终双心房容积网格——通过融合(a)(b)阶段生成的标签,使网格包含丰富的解剖结构信息。
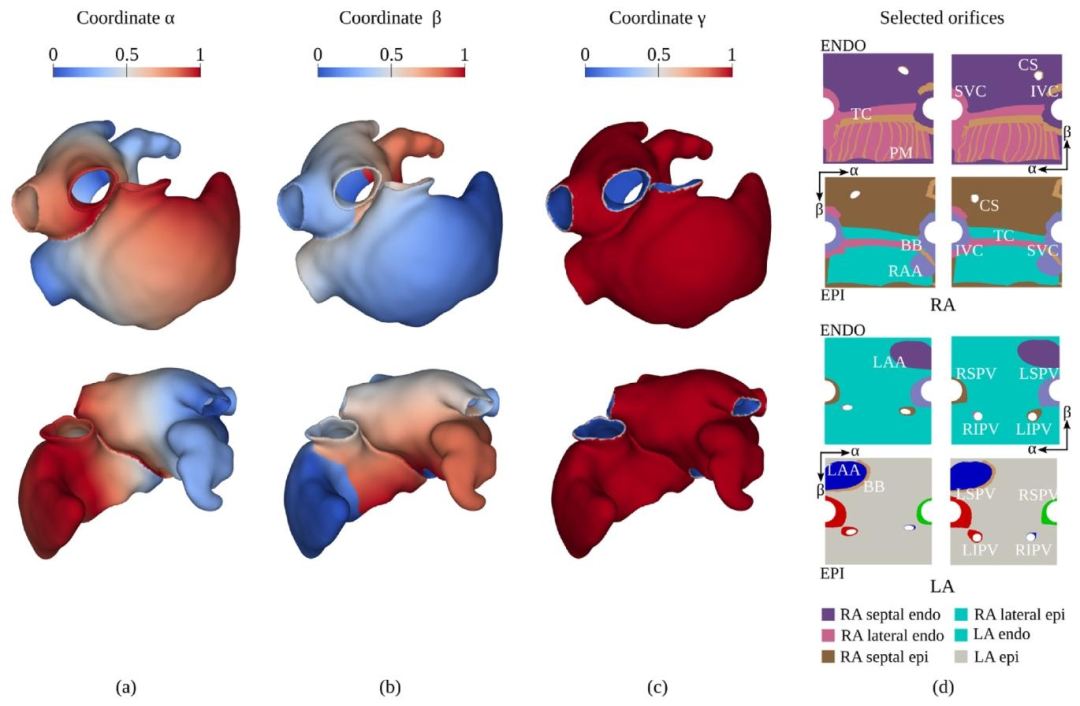
Fig. 5. (a) Distribution of the coordinate 𝛼, representing the 𝑆𝑉 𝐶-to-IVC coordinate for the 𝑅𝐴, and the lateral-to-septal coordinate for the LA. (b) Distributionof the coordinate 𝛽, representing the lateral-to-septal coordinate for the RA, and the posterior-to-anterior coordinate for the LA. (c) Distribution of the coordinate𝛾*, representing the endocardial-to-epicardial coordinate for both atria. (d) Projection of the labels on the space generated by the UAC before (left) and after(right) the solution of the linear elasticity problem.The colors represent the projection on the UAC space of the anatomical structures labeled in the atrial modelrepresented in Fig. 4.
图5 (a)坐标α的分布:对右心房(RA)而言,该坐标代表从上腔静脉(SVC)到下腔静脉(IVC)的坐标;对左心房(LA)而言,代表从侧壁到间隔的坐标。 (b)坐标β的分布:对右心房(RA)而言,该坐标代表从侧壁到间隔的坐标;对左心房(LA)而言,代表从后壁到前壁的坐标。 (c)坐标γ的分布:对两侧心房而言,该坐标均代表从心内膜到心外膜的坐标。 (d)线性弹性问题求解前(左侧)与求解后(右侧),标签在通用坐标系(UAC)生成空间上的投影。颜色代表图4所示心房模型中已标注解剖结构在通用坐标系(UAC)空间上的投影。
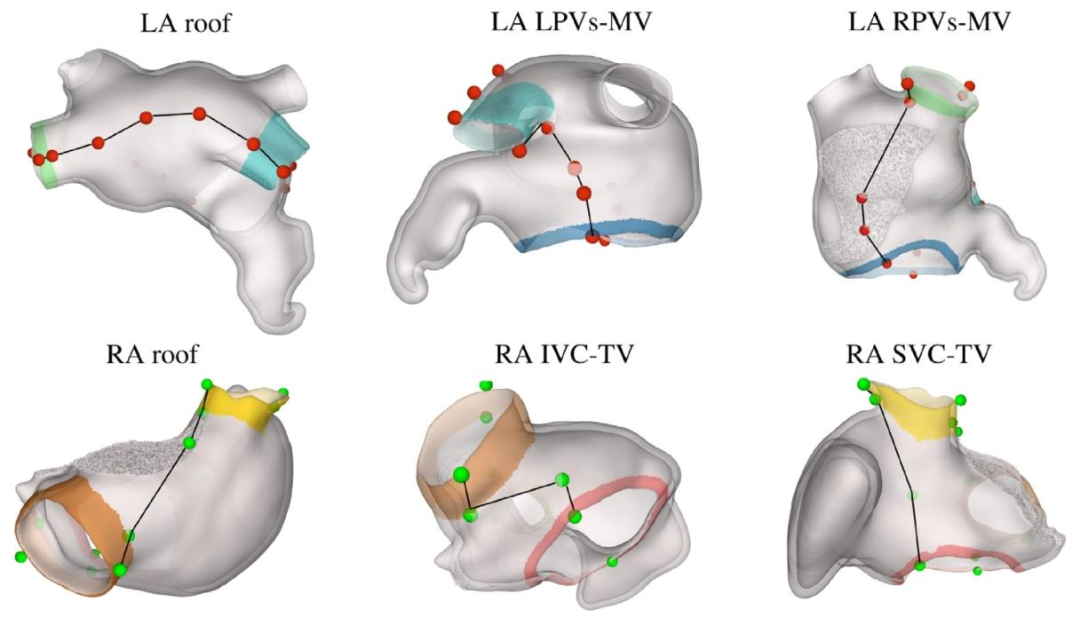
Fig. 6. Set of reproducible points selected on the LA and RA to define the boundaries for the UAC computation.
图6 在左心房(LA)和右心房(RA)上选取的可复现点集合——这些点用于定义通用坐标系(UAC)计算的边界。
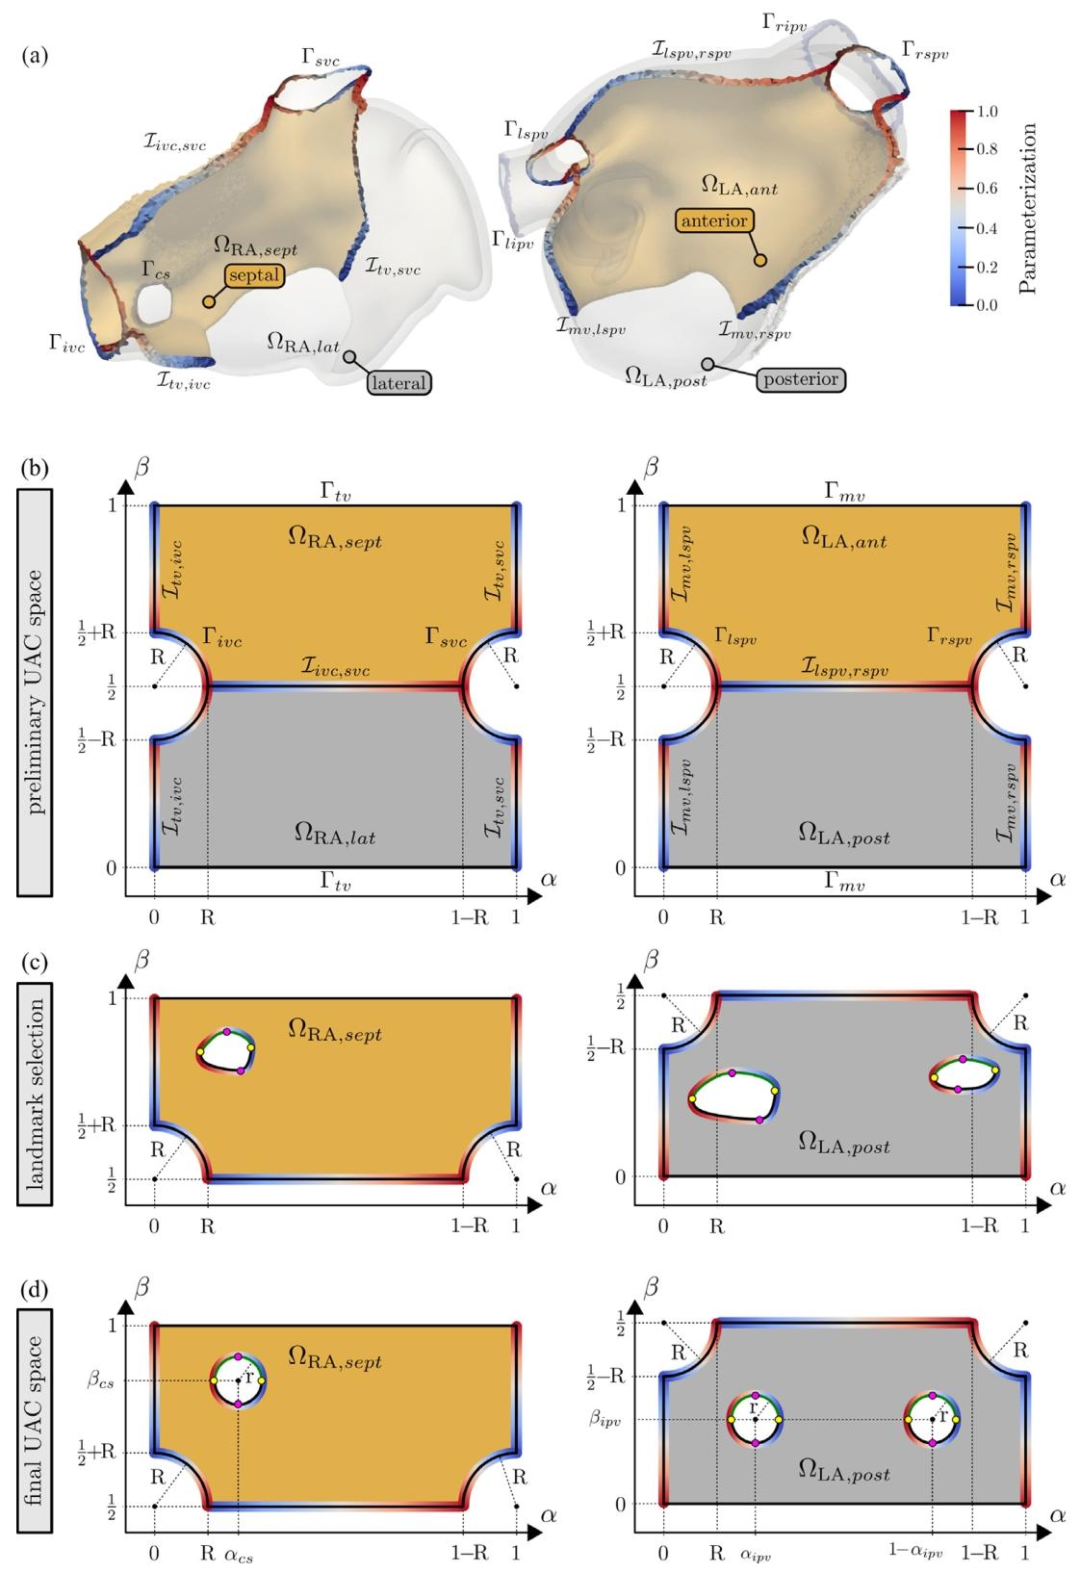
Fig. 7. (a) Interfaces and boundary surfaces in the RA and LA and their parametrization. (b) Dirichlet values at the boundaries and interfaces used to computethe preliminary 𝛼 and 𝛽 components for the RA and LA are shown. (c) Selected landmarks and the parametrization of the CS, the LIPV, and the RIPV. (d) Final𝛼 and 𝛽 components after moving the orifices. The color are coded from blue = 0 to red = 1
图7 (a)右心房(RA)与左心房(LA)中的界面及边界表面,以及它们的参数化结果。 (b)展示用于计算右心房(RA)与左心房(LA)初步α、β分量的边界及界面处的狄利克雷值。 (c)选定的标志点,以及冠状窦(CS)、左肺静脉下口(LIPV)与右肺静脉下口(RIPV)的参数化结果。 (d)调整开口位置后最终的α、β分量(颜色编码:蓝色=0,红色=1)。
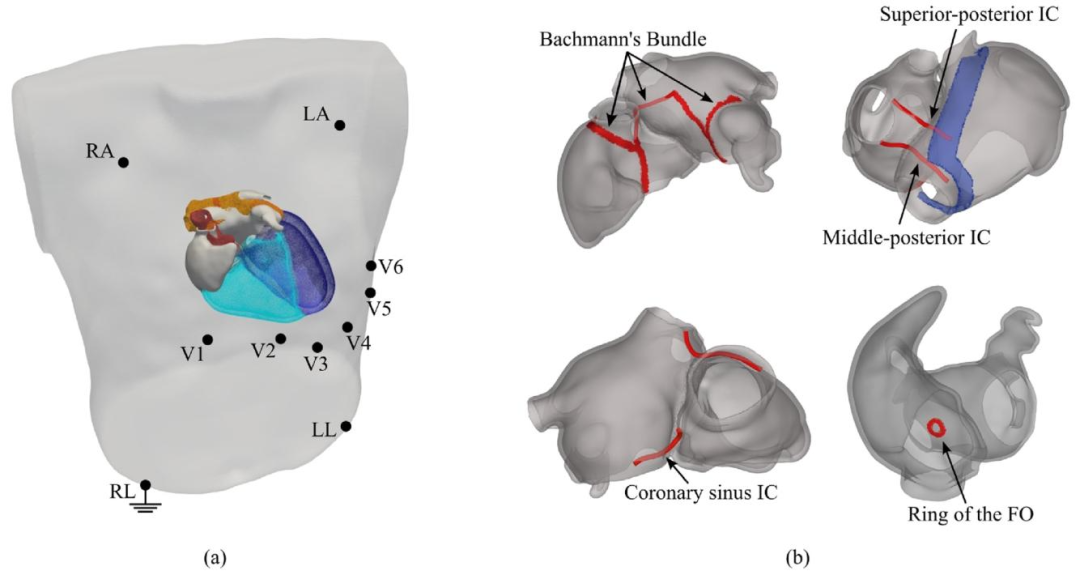
Fig. 8. (a) Combined conformal atria-torso mesh generated by registering a patient atrial model, generated with our workflow, to a selected template torso modelwith positioned ECG electrodes. The ventricles for the template heart are also represented. (b) Representation of the electrical connections between the RA andLA, including four IC and the FO
图8 (a)通过将本工作流程生成的患者心房模型与选定的、带有心电图(ECG)电极位置的模板躯干模型进行配准,所生成的心房-躯干联合共形网格。模板心脏的心室结构也在图中呈现。 (b)右心房(RA)与左心房(LA)之间电连接的示意图,包含4条心房间传导通路(IC)及卵圆窝(FO)。
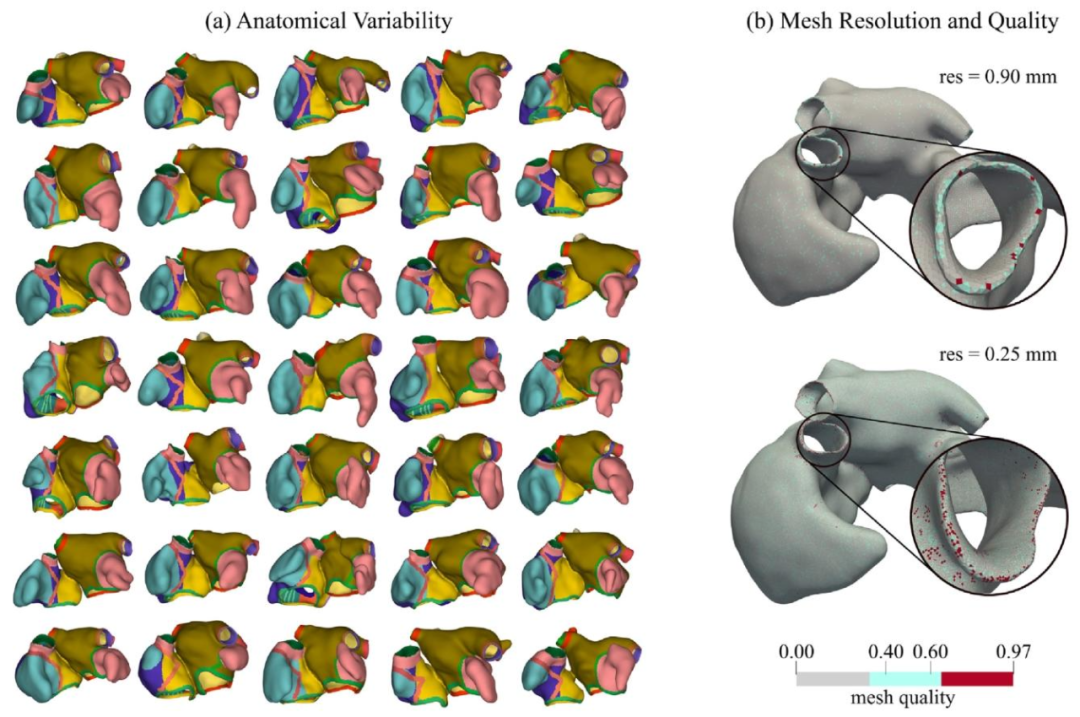
Fig. 9. (a) Representation of 35 out of 50 generated biatrial models. Only a subset of the generated geometries is represented to allow for a better visualization.(b) Examples of computed meshes of resolution of ≈ 0.90 mm and ≈ 0.25 mm and corresponding obtained mesh quality
图9 (a)50个生成的双心房模型中35个的展示图。为便于更好地可视化,仅呈现了生成几何模型的一个子集。 (b)分辨率约为0.90 mm与0.25 mm的计算网格示例,以及对应的网格质量结果。
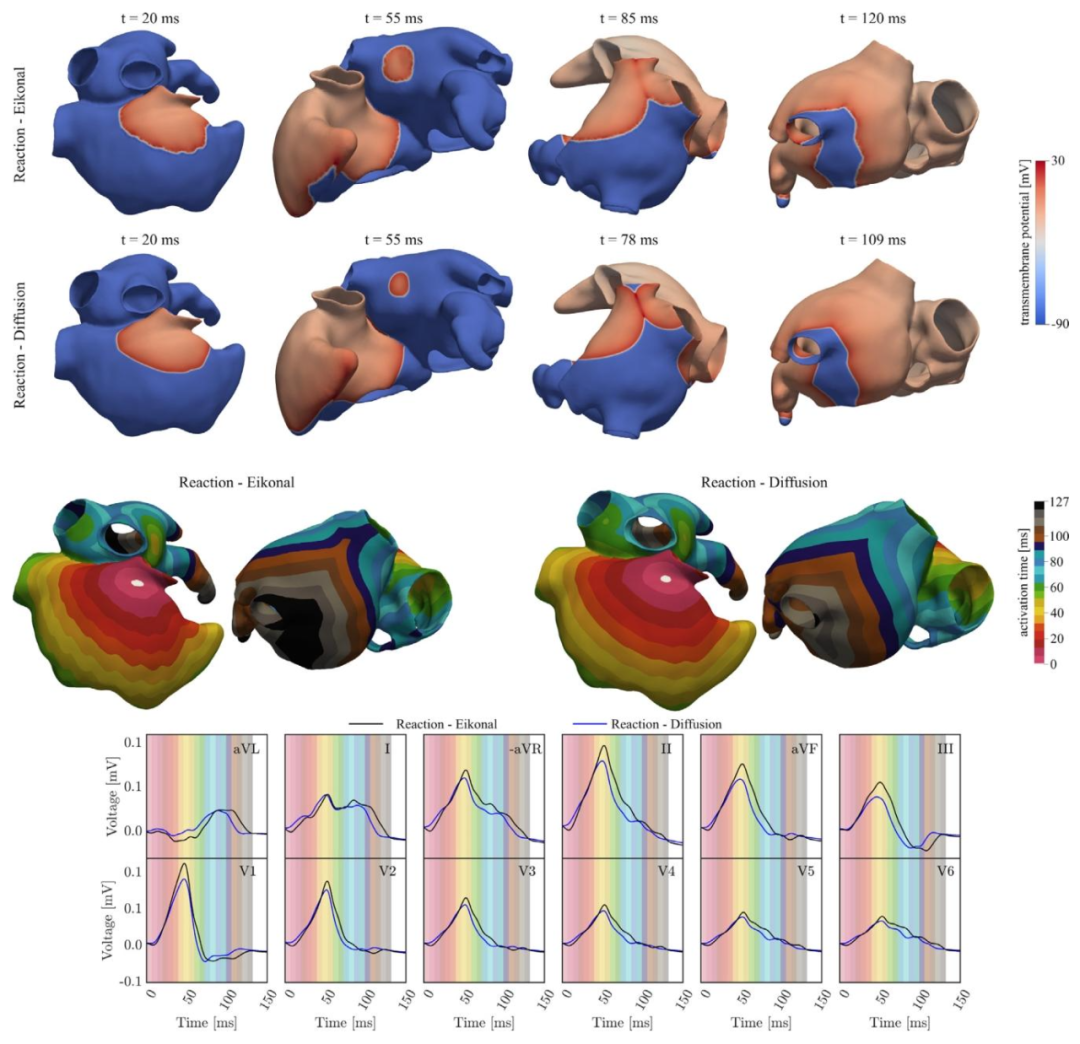
Fig. 10. First/Second row: Transmembrane potential 𝑉𝑚 propagation computed with the R-E and R-D models, at different time instants. Third row: Activationmap obtained by solving the R-E and the R-D model. Fourth row: ECGs obtained by solving the R-E (black) and R-D (blue) models coupled with the lead field.The background colors refer to the activation map. By coloring the background with time-bands of colors corresponding to the activation map, the activationmap is compared with the ECG, highlighting the relation between regional atrial activation and P-wave.
图10 第一行/第二行:在不同时刻,通过反应-程函(R-E)模型和反应-扩散(R-D)模型计算得到的跨膜电位(\(V_m\))传导情况。 第三行:求解反应-程函(R-E)模型和反应-扩散(R-D)模型得到的激活图。 第四行:通过与导联场耦合的反应-程函(R-E)模型(黑色)和反应-扩散(R-D)模型(蓝色)得到的心电图(ECGs)。 背景颜色对应激活图。通过用与激活图对应的时间带颜色为背景着色,将激活图与心电图进行对比,突出区域性心房激活与P波之间的关系。
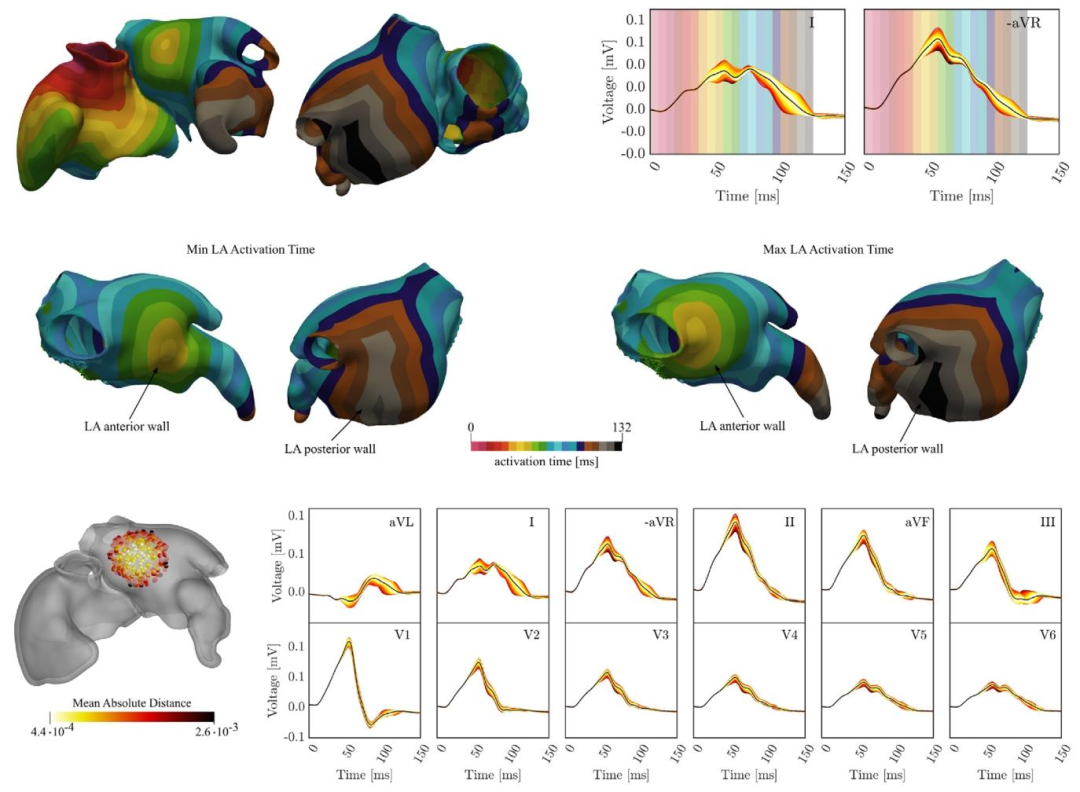
Fig. 11. Influence of BB LA insertion site. First row: Biatrial activation map obtained for BB reference insertion site along with P-waves in leads I and -aVR. Thebackground of P-wave traces is color coded according to the activation map to highlight the relation between the dipole layer of depolarization wave fronts andthe associated amplitude in the P-wave. Second row: LA activation maps corresponding to the minimum and maximum total activation time. Third row: P-wavevariation due to varying the BB insertion site in the LA. Insertion site an ECG are color coded corresponding to the absolute distance from the mean ECG (black),averaged over time and the 12 leads.
图11 左心耳(LA)球囊(BB)植入部位的影响: 第一行:球囊参考植入部位对应的双心房激活图,以及I导联和-aVR导联中的P波。P波轨迹背景采用与激活图对应的颜色编码,以突出去极化波前的偶极层与其在P波中相关振幅的关系。 第二行:对应总激活时间最小值和最大值的左心房(LA)激活图。 第三行:左心房(LA)内球囊植入部位变化引起的P波变异。植入部位与心电图(ECG)根据与平均心电图(黑色)的绝对距离进行颜色编码(该平均心电图为12导联心电图的时间平均值)。
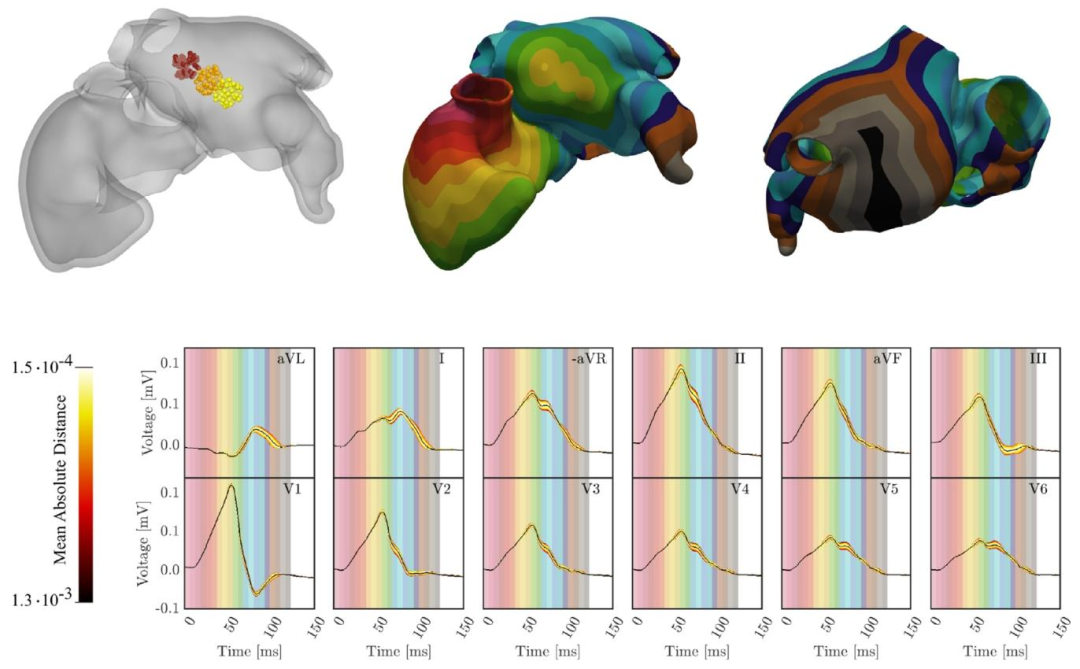
Fig. 12. First row-left: Investigated LA entry site areas of the three cables representing the BB. The different colors identify the three different regions of search.First row-center and right: An example of activation map obtained with the three-cable BB. Second row: P-wave variation obtained by moving the LA entrysites of the three cables representing the BB. The signals coloration correspond to the absolute distance from the mean ECG, averaged over time and the leads.The mean ECG is shown in black. By coloring the background of the lead with time-bands of colors corresponding to the activation map, the activation map iscompared with the ECG, highlighting the relation between regional atrial activation and P-wave.
图12 第一行左侧:代表球囊(BB)的三根导线在左心房(LA)的植入部位研究区域,不同颜色标识三个不同的搜索区域。 第一行中间与右侧:采用三根导线球囊(BB)得到的激活图示例。 第二行:通过移动代表球囊(BB)的三根导线在左心房(LA)的植入部位所获得的P波变异。信号颜色根据与平均心电图(黑色)的绝对距离进行编码,该平均心电图为各导联心电图的时间平均值。 通过用与激活图对应的时间带颜色为导联背景着色,将激活图与心电图进行对比,突出区域性心房激活与P波之间的关系。 要不要我帮你梳理一个图中关键元素的标注说明表,把区域、颜色、图表类型对应的含义整理清楚,方便快速理解图中信息?
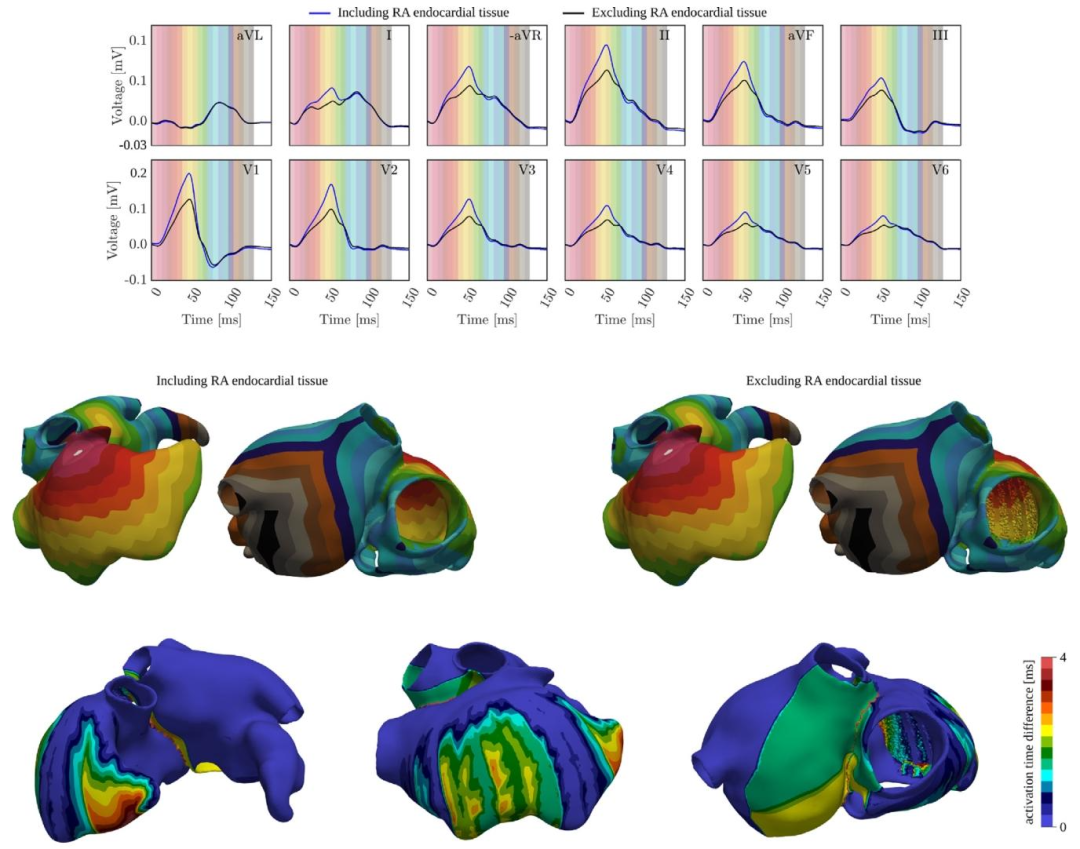
Fig. 13. First row: P-wave obtained when including (blue) and excluding (black) the RA endocardial tissue outside of the PMs and TC. The P-wave of all leads iscompared to the activation map by coloring the background. Second row: Activation maps obtained when including (left) and excluding (right) the RA endocardialtissue. Third row: Absolute difference between the activation maps obtained when including and excluding the RA endocardial tissue.
图13 第一行:包含(蓝色)与排除(黑色)界嵴(TC)和乳头肌(PMs)外的右心房(RA)心内膜组织时得到的P波。通过为背景着色,将所有导联的P波与激活图进行对比。 第二行:包含(左侧)与排除(右侧)右心房(RA)心内膜组织时得到的激活图。 第三行:包含与排除右心房(RA)心内膜组织时所获激活图之间的绝对差值。 要不要我帮你整理一份图中数据对比的核心要点清单,把“包含/排除组织”对P波、激活图的关键影响提炼出来,方便快速抓取核心结论?
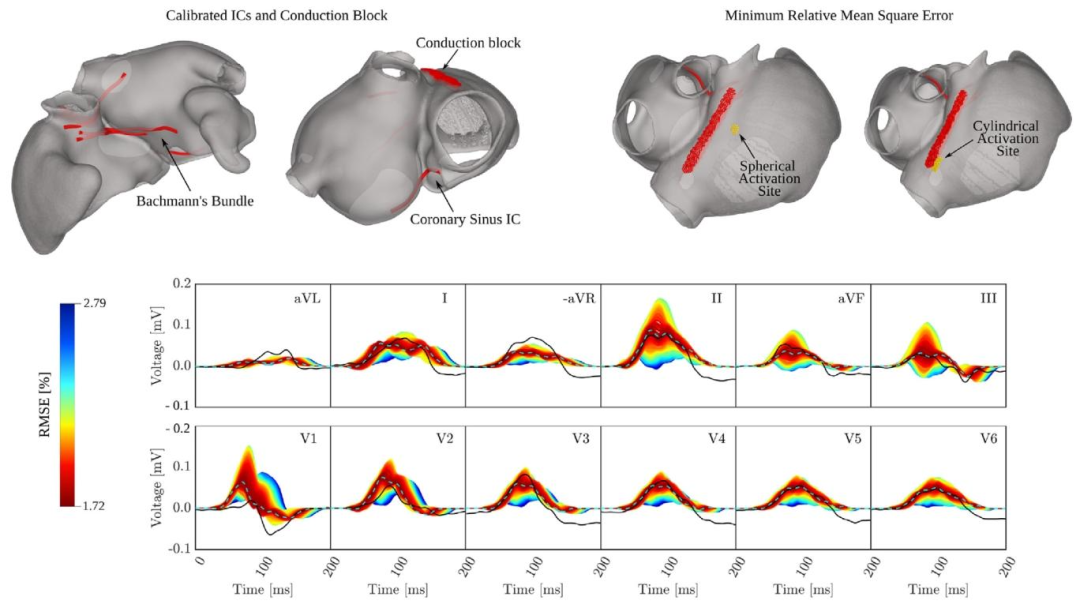
Fig. 14. P-wave based calibration of the atrial activation sequence. Top row, left: Constant ICs configuration obtained by interactive pseudo-calibration. Top rowright: Spatial sampling ranges of SAN exit sites with optimal location that minimized the mismatched as measured by the RMSE. Bottom row: Physiologicalenvelope of P-waves (colored traces) obtained by varying SAN exit site, and the velocities 𝑣**𝑓 and 𝑣**𝑠 in the RA together with the clinical P-wave (black line), andthe computed P-wave with minimum RMSE (light blue and dashed line). Traces are color-coded according to their distance to the clinical P-wave measured asRMSE.
图14 基于P波的心房激活序列校准: 上行左侧:通过交互式伪校准获得的固定心房间传导通路(ICs)配置。 上行右侧:窦房结(SAN)出口位点的空间采样范围,其中最优位点可将均方根误差(RMSE)衡量的不匹配度降至最低。 下行:通过改变窦房结(SAN)出口位点、右心房(RA)内传导速度(v_f)与(v_s)所获得的P波生理包络(彩色轨迹),同时呈现临床P波(黑色实线)与具有最小均方根误差(RMSE)的计算P波(浅蓝色虚线)。 轨迹颜色根据其与临床P波的距离(以RMSE衡量)进行编码。 要不要我帮你梳理一份图中关键校准步骤的拆解说明,把SAN位点调整、速度参数优化等核心操作与结果的对应关系讲清楚,方便理解校准逻辑?
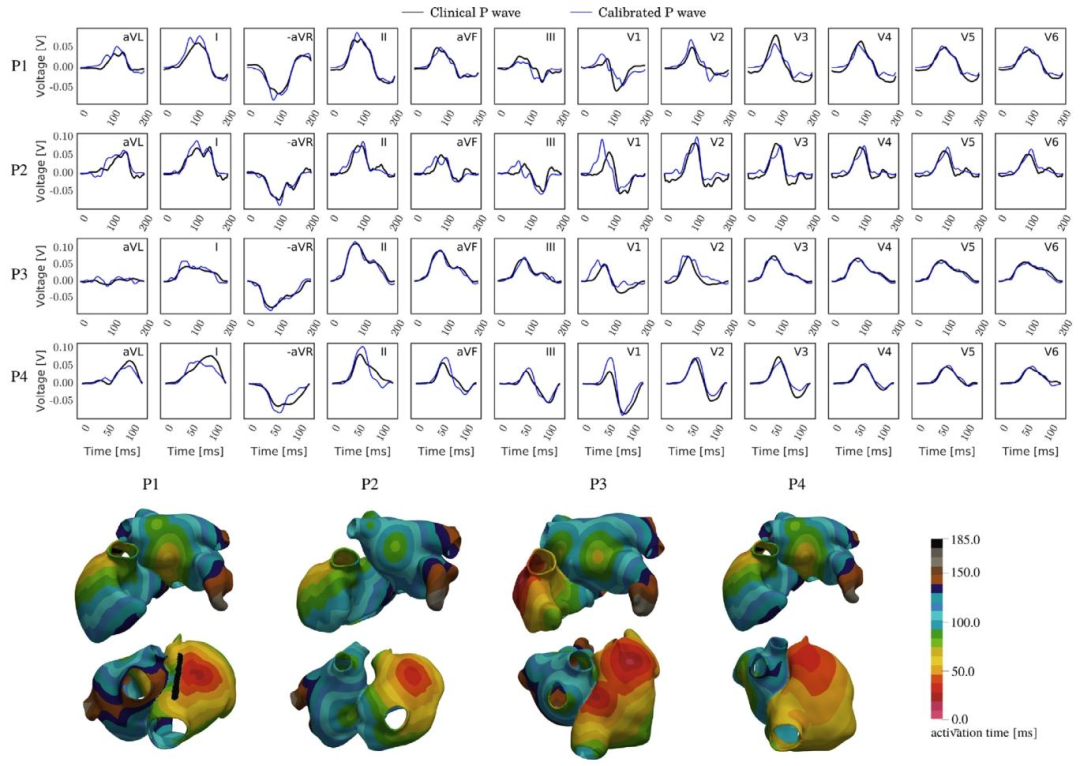
Fig. 15. P-wave based calibration of the atrial activation sequence of four atrial anatomies randomly selected between the available in the AF dataset. Top:Qualitative comparison between the clinical P-waves (black) and the simulated ones (blue). Bottom: Atrial activation sequences obtained from the calibrationprocess
图15 基于P波的4个心房解剖结构(从心房颤动数据集随机选取)的心房激活序列校准: 上方:临床P波(黑色)与模拟P波(蓝色)的定性对比。 下方:通过校准过程得到的心房激活序列。
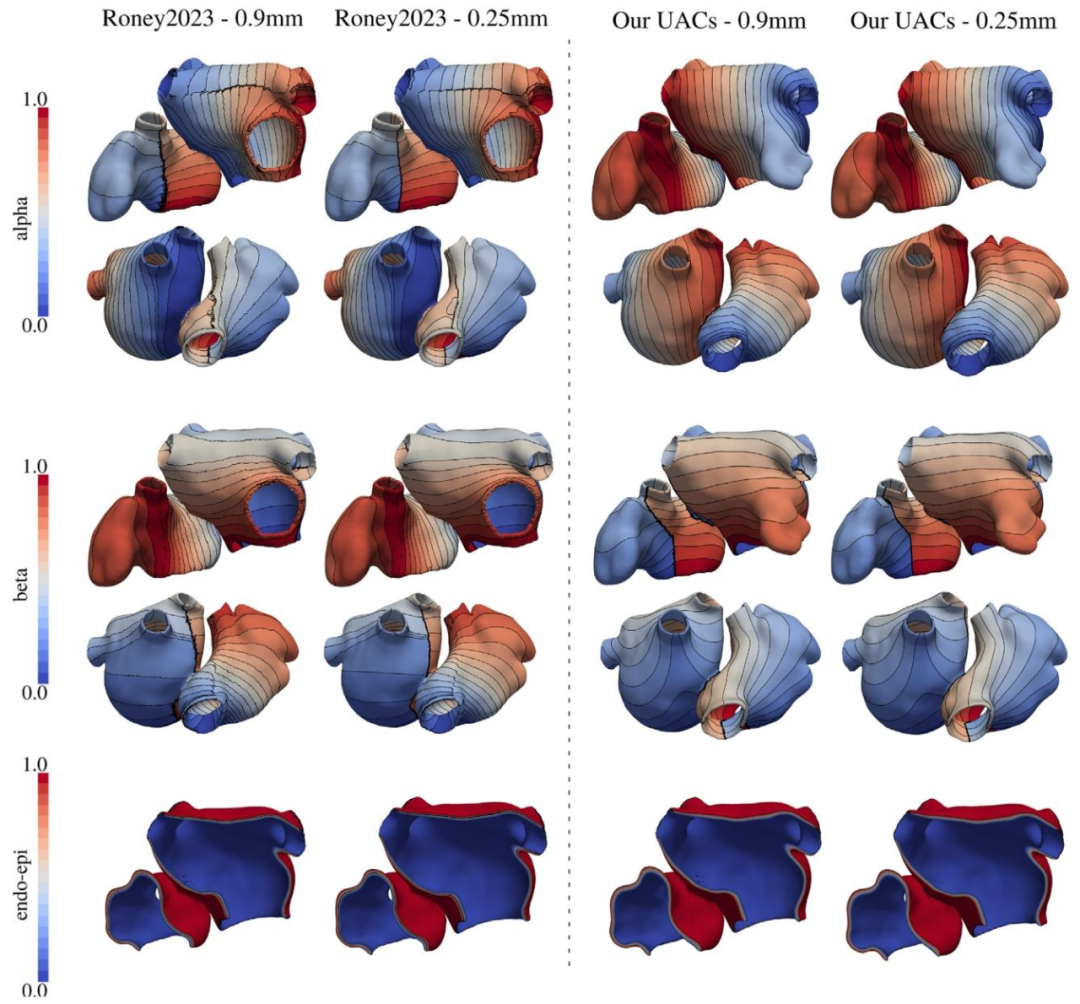
Fig. A.16. Qualitative comparison between the UAC generated on a model randomly selected in the AF dataset employing the method and code presented byRoney and coauthors in Roney et al. (2019a) (left), and with the method presented in this work (right), with a mesh resolution of 0.90 mm (first and third column)and 0.25 mm (second and fourth column)
图A.16 对心房颤动(AF)数据集中随机选取的一个模型,分别采用Roney等人(2019a)提出的方法与代码(左侧)和本研究提出的方法(右侧)生成的通用坐标系(UAC)进行定性对比。 图中第一列与第三列对应网格分辨率为0.90 mm的结果,第二列与第四列对应网格分辨率为0.25 mm的结果。
Table
表
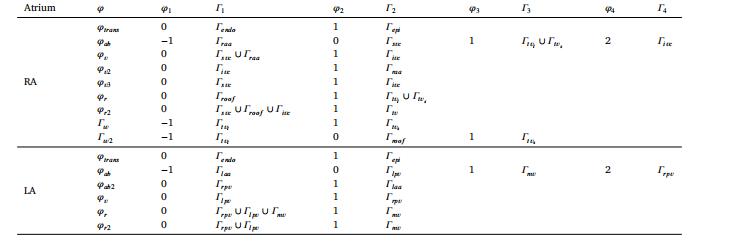
Table 1DBCs for the 15 LD problems employed to determine atrial anatomical structures and tissues known to have different EP properties.
表 1:用于确定具有不同电生理(EP)特性的心房解剖结构与组织的 15 个水平集(LD)问题的 Dirichlet 边界条件(DBCs)
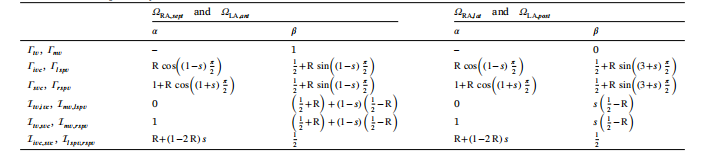
Table 2Dirichlet boundary conditions for the Laplace problems that are solved to obtain the preliminary UAC space in the septal andlateral RA and the posterior and anterior LA where 𝑠 ∈ [0, 1] is a parametrization value of the corresponding boundary surfaceand interface, respectively. In our framework, R = 0.1.
表2 为获取右心房(RA)间隔部与侧壁、左心房(LA)后部与前部的初步通用坐标系(UAC)空间而求解的拉普拉斯问题的狄利克雷边界条件 其中,(s \in [0,1]) 分别为对应边界表面与界面的参数化数值;在本框架中,(R = 0.1)。
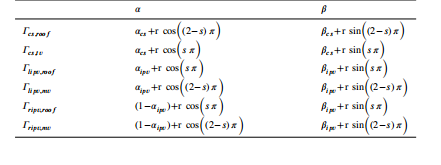
Table 3Final position of the CS, LIPV, and RIPV orifices with parametrization value𝑠 ∈ [0, 1].
表 3:冠状窦(CS)、左肺静脉下口(LIPV)及右肺静脉下口(RIPV)开口的最终位置(含参数化数值𝑠* ∈ [0, 1])
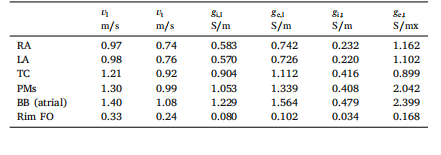
Table 4Conduction velocities in longitudinal and transverse directions, 𝑣𝑙 and 𝑣𝑡 ,prescribed in the R-E model along with calibrated conductivities yieldingmatching velocities in the R-D models at the target average mesh resolutionof 𝛥𝑥 ≈ 0.25 mm. The bidomain surface-to-volume ration was chosen as𝛽 =1400.00 cm−1
表4:反应-程函(R-E)模型中设定的纵向与横向传导速度((v_l)、(v_t)),以及在目标平均网格分辨率(\Delta x \approx 0.25\ \text{mm})下,使反应-扩散(R-D)模型达到匹配速度的校准电导率 其中,双域模型的表体比(surface-to-volume ratio)设定为(\beta = 1400.00\ \text{cm}^{-1})。
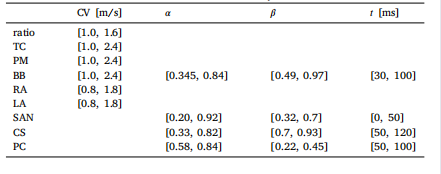
Table 5Bounds defined for varying the parameters in 𝝎𝑜𝑝𝑡.
表 5:为优化参数集𝝎𝑜𝑝𝑡中各参数设定的取值范围
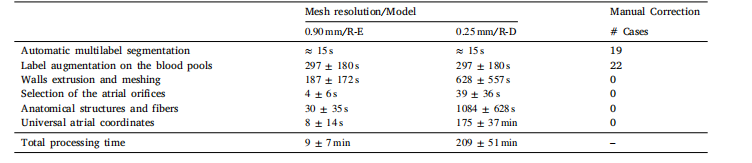
Table 6Average timings for the generation of all the 50 biatrial geometries at target resolutions of ≈ 0.90 mm and ≈ 0.25 mm and thenumber of models requiring manual corrections are given for each processing stage.
表 6:50 个双心房几何模型在目标分辨率(≈0.90 mm 与≈0.25 mm)下的各生成阶段平均耗时,以及各处理阶段需手动修正的模型数量
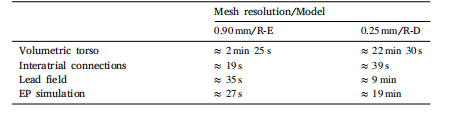
Table 7Execution times of setup and simulation using R-E or R-D models.
表 7:使用反应 - 程函(R-E)模型与反应 - 扩散(R-D)模型时的设置时间与模拟时间
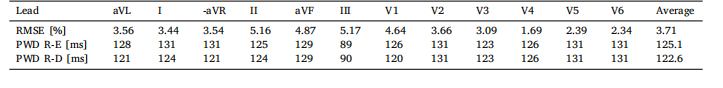
Table 8RMSE in percentage, between ECG signals computed with the R-E and R-D models coupled with the lead field. The PWD of theECG traces obtained with the R-E and the R-D models coupled with the lead field are also reported
表8:反应-程函(R-E)模型与反应-扩散(R-D)模型结合导联场计算得到的心电图(ECG)信号之间的均方根误差(RMSE,百分比),同时还报告了两种模型结合导联场得到的心电图轨迹的P波持续时间(PWD)。
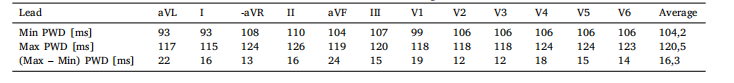
Table 9Maximum and minimum PWD, and their differences, for each lead and averaged over all leads
表 9:各导联的 P 波持续时间(PWD)最大值、最小值及其差值,以及所有导联的 P 波持续时间(PWD)平均值
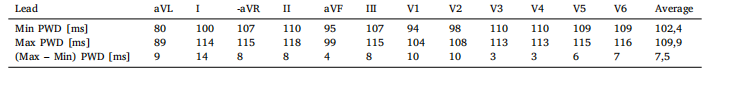
Table 10Maximum and minimum PWD, and their differences, for each lead and averaged over all leads.
表 10:各导联的 P 波持续时间(PWD)最大值、最小值及其差值,以及所有导联的 P 波持续时间(PWD)平均值

Table 11RMSE between the ECGs obtained when excluding the RA endocardial tissue outside of the PMs and TC, and the ECGs signal obtained including the RA endocardialtissue, and PWD, for each lead and averaged over all leads
表11:排除界嵴(TC)与乳头肌(PMs)外的右心房(RA)心内膜组织时得到的心电图(ECG),与包含该右心房心内膜组织时得到的心电图信号之间的均方根误差(RMSE),以及各导联的P波持续时间(PWD)和所有导联的P波持续时间(PWD)平均值 要不要我帮你设计一个表格内容的结构化框架,清晰区分RMSE数据与PWD数据的列项,避免信息混淆?
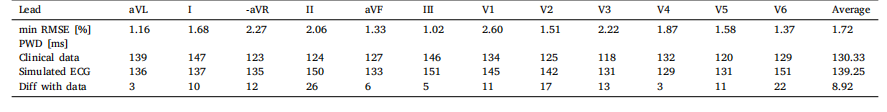
Table 12Minimum RMSE, in percentage, PWD of the ECG data, of the computed ECG with minimum RMSE, and their difference, obtained by varying the position of thespherical or cylindrical activation impulse representing the SAN, and the conduction velocity 𝑣𝑓 and 𝑣𝑠 of the RA.
表12:通过改变代表窦房结(SAN)的球形或圆柱形激活脉冲的位置,以及右心房(RA)的传导速度(v_f)和(v_s)所获得的最小均方根误差(RMSE,百分比)、心电图(ECG)数据的P波持续时间(PWD)、具有最小RMSE的计算心电图的P波持续时间(PWD)及其差值。
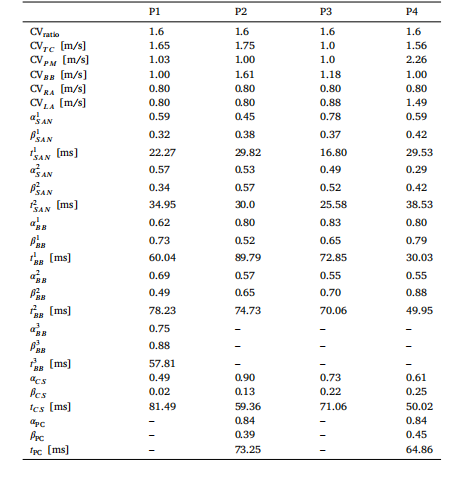
Table 13Optimal values for the parameters of 𝝎𝑜𝑝𝑡 for each calibrated patient.
表 13:每位校准患者的优化参数集𝝎𝑜𝑝𝑡的最优值
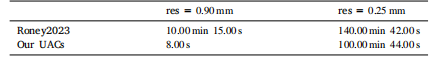
Table A.14Execution times for computing the UAC system with Roney2023 method (firstrow), and our method (second row), at mesh resolution of 0.90 mm (secondcolumn), and 0.25 mm (third column).
表 A.14:采用 Roney2023 方法(第一行)与本研究方法(第二行)计算通用坐标系(UAC)系统的执行时间,分别对应网格分辨率 0.90 mm(第二列)和 0.25 mm(第三列)